---
title: 100+ mobile payments statistics for 2026
slug: mobile-payments-statistics
excerpt: "Discover 100+ mobile payment statistics covering market growth, adoption, payment methods, consumer preferences, fraud, challenges, and emerging trends."
customExcerpt: "Discover 100+ mobile payment statistics covering market growth, adoption, payment methods, consumer preferences, fraud, challenges, and emerging trends."
metaTitle: 100+ mobile payments statistics for 2026
metaDescription: "100+ mobile payment statistics covering market growth, adoption, payment methods, consumer preferences, fraud, challenges, and emerging trends."
featureImage: "https://storage.ghost.io/c/12/7b/127b828b-bdc2-4972-9cf2-de857df9c324/content/images/2026/10/blog-mobilepayouts-stats.jpg"
status: published
publishedAt: "2026-10-06T06:13:35.000Z"
updatedAt: "2026-10-06T11:45:36.000Z"
createdAt: "2026-10-06T05:40:32.322Z"
tags:
- { name: Payments, slug: payments }
- { name: Statistics, slug: statistics }
- { name: "#Mobile payments", slug: hash-mobile-payments }
authors:
- { name: Emily Dean, slug: emily }
- { name: Keisha Singleton, slug: keisha }
---
# 100+ mobile payments statistics for 2026
## Key takeaways
- Mobile payments are becoming the default channel, heading toward $38.5 trillion by 2030 worldwide.
- Digital wallets now outpace cards online and in-store, so merchants should prioritize wallet acceptance everywhere.
- Merchant apps convert better than mobile sites, making checkout friction and processing errors costly lost sales.
Whether through digital wallets, apps, QR codes, or mobile money accounts, consumers are increasingly using their phones for everyday transactions.
For businesses, this creates a clear opportunity to meet customers where they already pay, reduce friction and encourage repeat purchases.
To help you make informed decisions about which methods to support, where to invest, and how to plan around customer behavior, we’ve gathered 100+ mobile payment statistics for 2026.
Keep reading to explore market growth, adoption, preferences, emerging trends, and key challenges.
## Mobile payments statistics highlights
- The global mobile payments market is expected to reach $38.50 trillion by 2030.
- More than 97% of global internet users aged 16 and older own a mobile device, creating a vast potential audience for mobile payments.
- Digital wallets are projected to account for 65% of global ecommerce transaction value by 2030.
- Mobile devices now account for 90% of scam sessions.
- Payment friction remains a challenge, with 23% of mobile shoppers reporting a processing error compared with 17% of computer users.
- AI is expected to play a larger role in payments, with 64% of consumers expecting to use shopping agents within two years.
## Mobile payments market statistics
**The global mobile payments market was expected to increase by 13.1% to $25.96 trillion in 2026, up from $22.95 trillion in 2025**[1](#sources)**.**
The industry is projected to expand at a CAGR of 10.4% to reach $38.50 trillion in 2030, driven primarily by the growth of rising mobile wallet adoption, broader contactless acceptance, and [embedded financial services](https://whop.com/blog/what-is-embedded-finance/).
**According to Worldpay, global ecommerce spending has increased more than sixfold from $1.2 trillion in 2014 to over $6.8 trillion in 2024**[2](#sources)**.**
Smartphones have taken a growing share of this market, accounting for 57% of global ecommerce spend in 2024, up from 19% in 2014. Over the same decade:
- Digital wallet use grew tenfold online and in-store, accounting for $3.6 trillion and $12 trillion in spend, respectively.
- [Buy now pay later](https://whop.com/blog/buy-now-pay-later-on-whop/) (BNPL) saw rapid market acceptance, with online spending increasing from $2.2 billion in 2014 to $342 billion in 2024.
- Global A2A ecommerce spend is projected to hit $936 billion by 2030, up from $152 billion in 2014.
Together, these figures highlight that the wider payment mix is shifting towards methods consumers can access through their phones and mobile apps.
**Global non-cash transactions have increased more than tenfold in less than 20 years, expanding the broader market for mobile wallets, payment apps, QR payments, and mobile A2A transfers**[3](#sources)**. As of 2026, over 90% of non-cash transactions took place in retail and B2C settings.**
By 2029, as consumers continue to move away from cash payments, non-cash transactions are expected to grow at a CAGR of 16% from 1.685 trillion in 2024 to 3.54 trillion. According to Capgemini, Asia-Pacific is expected to record the fastest growth in non-cash transaction volumes with a projected CAGR of 20.2%.
This is followed by:
- Latin America with a projected CAGR of 17.4%
- Europe with a projected CAGR of 10.8%
- North America with a projected CAGR of 7.8%
- The Middle East and Africa with a projected CAGR of 13.9%
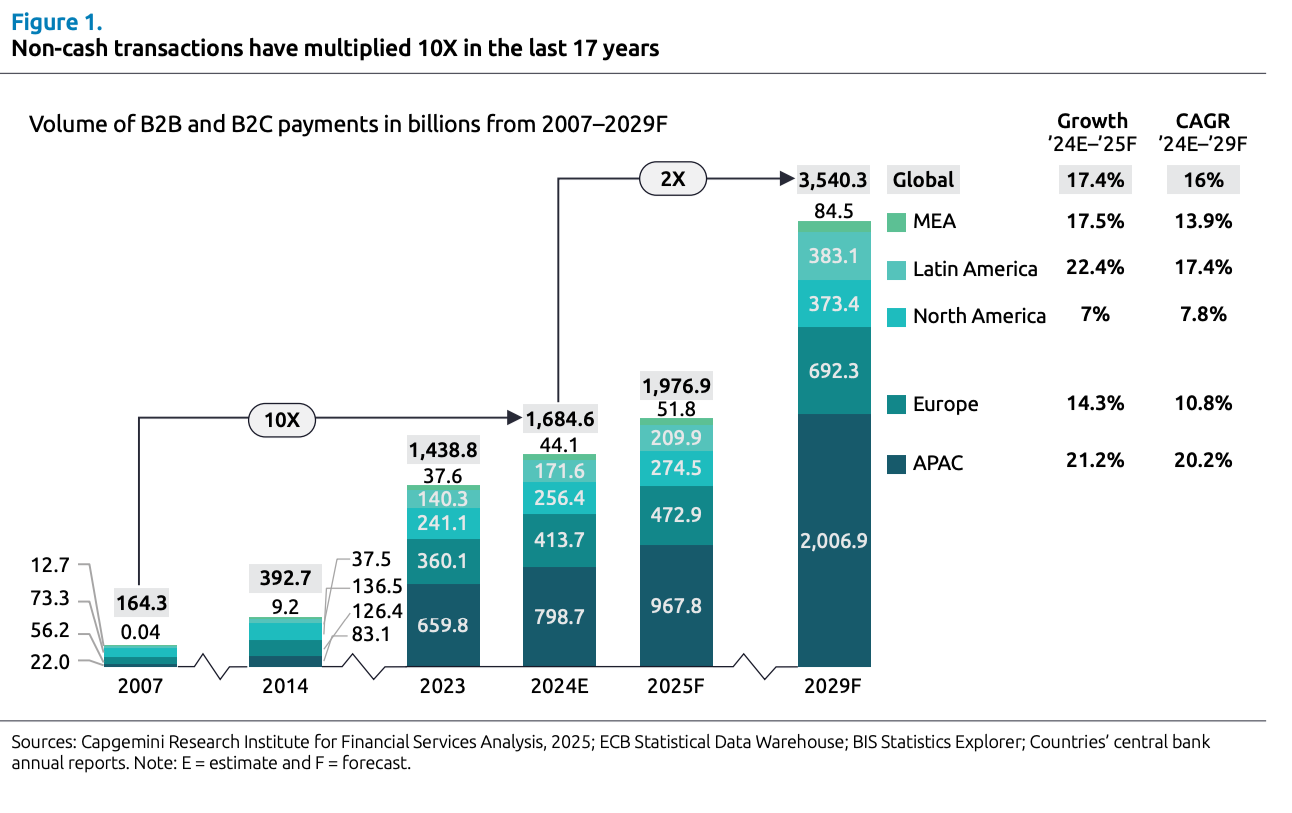
*Image source: Capgemini*
**As of October 2025, DataReportal reported that more than 97% of global internet users aged 16 and over owned a mobile device, creating a large potential audience for mobile payments**[4](#sources)**.**
- 70% of the world's population, or 5.78 billion internet users, owned mobile phones.
- The global mobile-user base increased by 108 million, or 1.8%, year-over-year.
- 96% of internet users over 16 accessed the internet via a mobile phone.
**The** [**ecommerce payments**](https://whop.com/blog/ecommerce-payment-processing/) **market, where mobile payments make up a significant share, was worth $8.3 trillion in 2025**[5](#sources)**.**
By 2030, it is expected to grow by 57% to over $13 trillion. Ecommerce payment transactions will grow by 60% from 277 billion in 2025 to 440 billion globally over the same period.
**In 2025, global mobile commerce revenue was estimated at $2.5 trillion**[6](#sources)**.**
By 2029, this is expected to nearly double, with mobile commerce accounting for 63% of total retail ecommerce revenue.
- According to eMarketer, mobile will account for over 50% of total ecommerce sales in the US by 2027[7](#sources).
- Retail mobile commerce sales were forecasted to hit $661.45 billion in 2026 and rise to $951.92 billion by 2030.
**The total value of global POS transactions, which includes payments made through traditional terminals, contactless cards, mobile wallets and other in-store methods, is expected to grow from $30 trillion in 2026 to $41 trillion by 2031**[8](#sources)**.**
- Within the POS market, global mobile POS transaction value, which measures merchants using smartphones or tablets to accept payments, is forecast to increase by 83% from $2.7 trillion in 2025 to $4.9 trillion by 2030.
- Meanwhile, global soft POS, which turns NFC-enabled smartphones or tablets into contactless payment terminals merchants can use to accept mobile wallet transactions, is expected to surge from $23.9 billion in 2025 to $540 billion by 2030.
**Global instant payment transaction value was around $60 trillion in 2025**[9](#sources)**.**
Estimated to increase by 115% to $129 trillion by 2030, instant payments are a key part of the mobile-payment market. That’s because services such as banking apps, QR payment systems, and pay-by-bank options give consumers mobile access to real-time A2A payment rails.
## Mobile payments adoption statistics
**In the previously mentioned DataReportal report, 54% of all ecommerce purchases were made via mobile as of October 2025, up 5.3% year-over-year.**
Digital wallets were the leading payment method, accounting for 53% of purchases.
**A 2025 PYMNTS report across 11 countries found that mobile wallets powered 35% of online and 21% of in-store transactions**[10](#sources)**.**
This was an increase of 5.2% and 10.9%, respectively, since 2022, highlighting a shift in how consumers access payments.
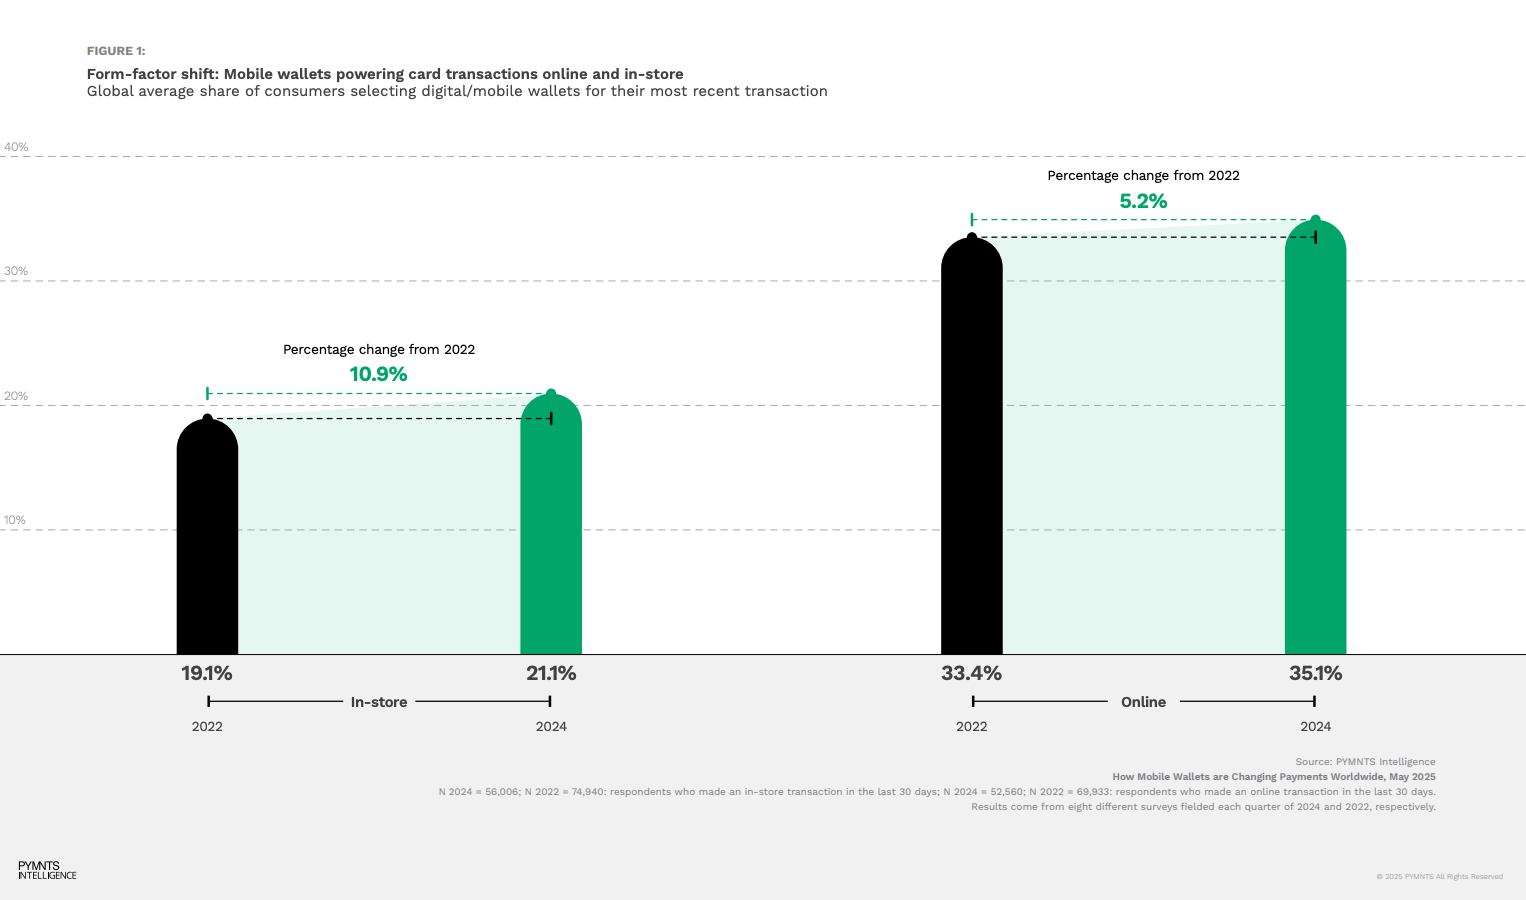
*Image source: PYMNTS *
**Meanwhile, by country, in-store mobile wallet usage was highest in Singapore at 35.4%, and Japan at 34.8%.**
The UK followed at 30.7% and Australia at 25.7%. The biggest jumps in usage between 2022 and 2024 were recorded in:
- Netherlands at 35%
- France at 34.5%
- Australia at 25%
**In a 2026 Sensor Tower report, digital wallets and P2P payments surpassed 1.8 billion downloads in 2025, up 3% from 2024**[11](#sources)**.**
They also accounted for around 22% of all global financial services app downloads, making them the third largest financial services app category behind credit, financial services (29%) and banking apps (26%).
**A 2026 Visa Acceptance report found that 48% of merchants accepted mcommerce mobile payments, while 68% accepted digital wallet payments**[12](#sources)**.**
Over the past 12 months, 22% of merchants added mobile payments. 34% added digital wallets, making them the fastest-growing [payment method](https://whop.com/blog/payment-methods/) among those measured.
**By merchant size, 47% of SMBs, 48% of mid-market firms and 49% of enterprise firms accepted mcommerce mobile payments.**
Meanwhile, 55% of SMBs, 63% of mid-market firms and 80% of enterprises accepted digital or ewallets.
**In a 2026 Global Payments report, 97% of the world’s point-of-sale (POS) terminals accepted digital wallets as of 2026**[13](#sources)**.**
This infrastructure allows consumers to use mobile wallets at physical checkouts, often with smartphone biometrics such as facial recognition or fingerprints used to authenticate payments. By 2027, mobile wallets are expected to account for 31% of POS transactions versus only 23% for debit cards.
**A 2025 FRB study found that mobile payment adoption was also spreading across major markets, although usage patterns differed between countries.**
For example, US consumers made an average of 11 payments per month via a mobile phone in 2024, up from four payments since 2018[14](#sources). In addition, mobile phones were used for:
- 23% of all payments
- 45% of remote payments
- 11% of all in-person non-bill payments
**In the UK, 7% of adults were registered for at least one mobile payment service in 2024, up from 42% in 2023**[15](#sources)**.**
Among registered users, 87% made a mobile payment at least once a month. Across the total adult population, 50% used mobile [contactless payments](https://whop.com/blog/tap-to-pay-guide/) at least monthly.
## Mobile payment methods statistics
Mobile payment methods typically span digital wallets, in-app checkout QR codes, contactless payments, and mobile money accounts.
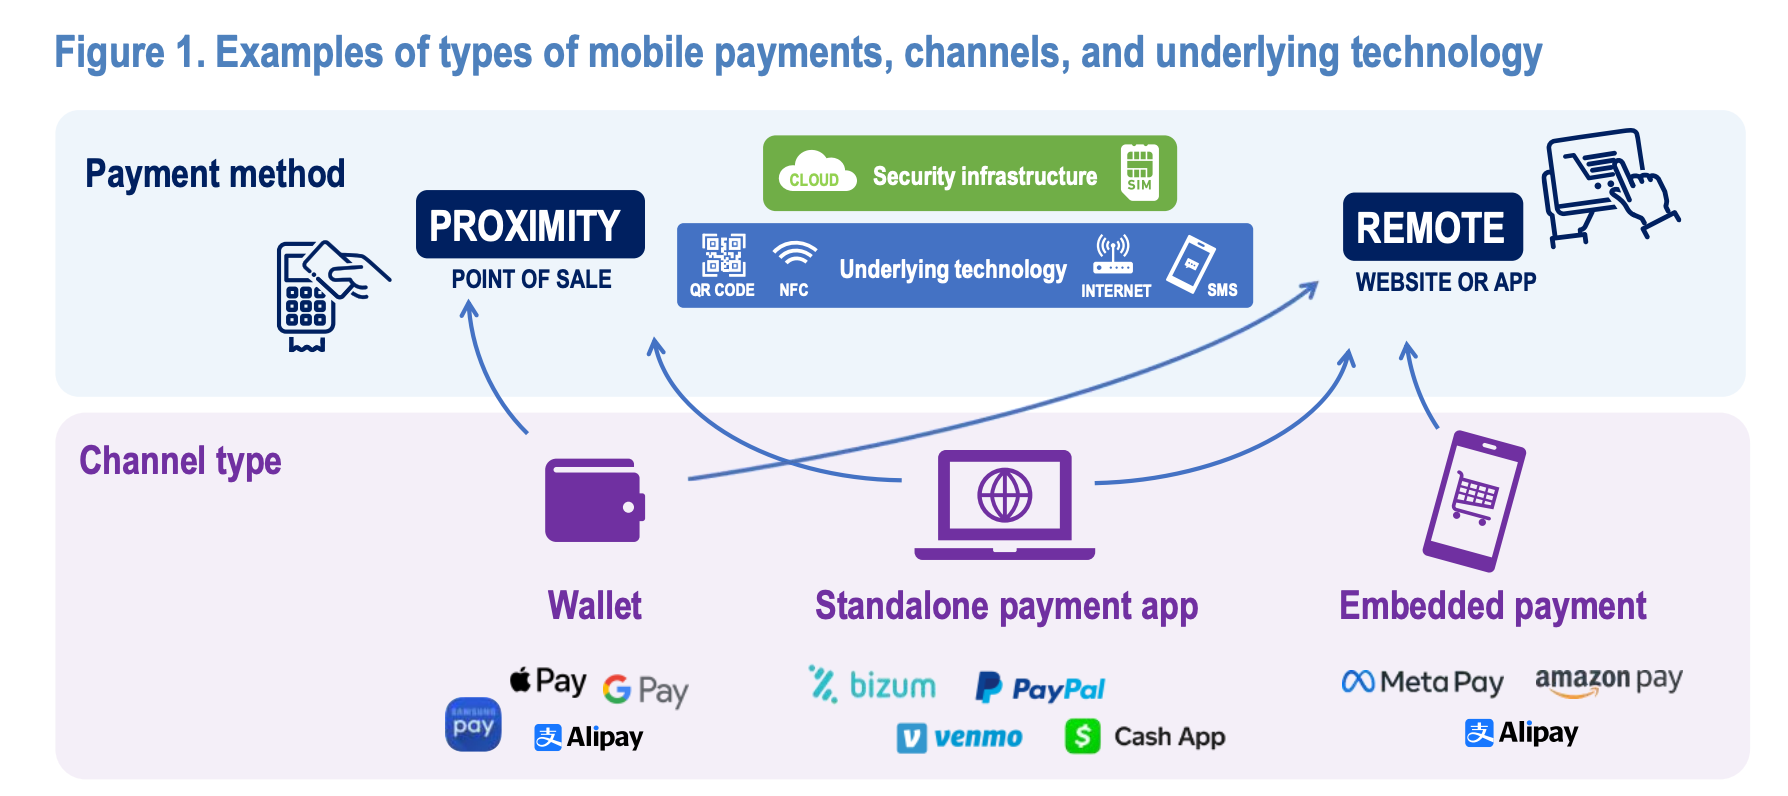
*Image source: OECD*
### Mobile wallets
**In 2024, digital wallets accounted for 53% of transaction value in ecommerce and are projected to reach 65% by 2030**[16](#sources)**.**
According to a 2025 Thunes report, by 2029, over 65% of the world’s population is expected to own a mobile wallet to store money, make payments, manage accounts, and access financial services without needing a traditional bank account[17](#sources).
**There were over 4.3 billion mobile wallets globally in 2024.**
This is expected to grow by around 35% to 5.8 billion in 2030.
**Global digital wallet transaction value hit $10 trillion in 2024.**
By 2029, this figure is expected to grow by 73% to $17 trillion.
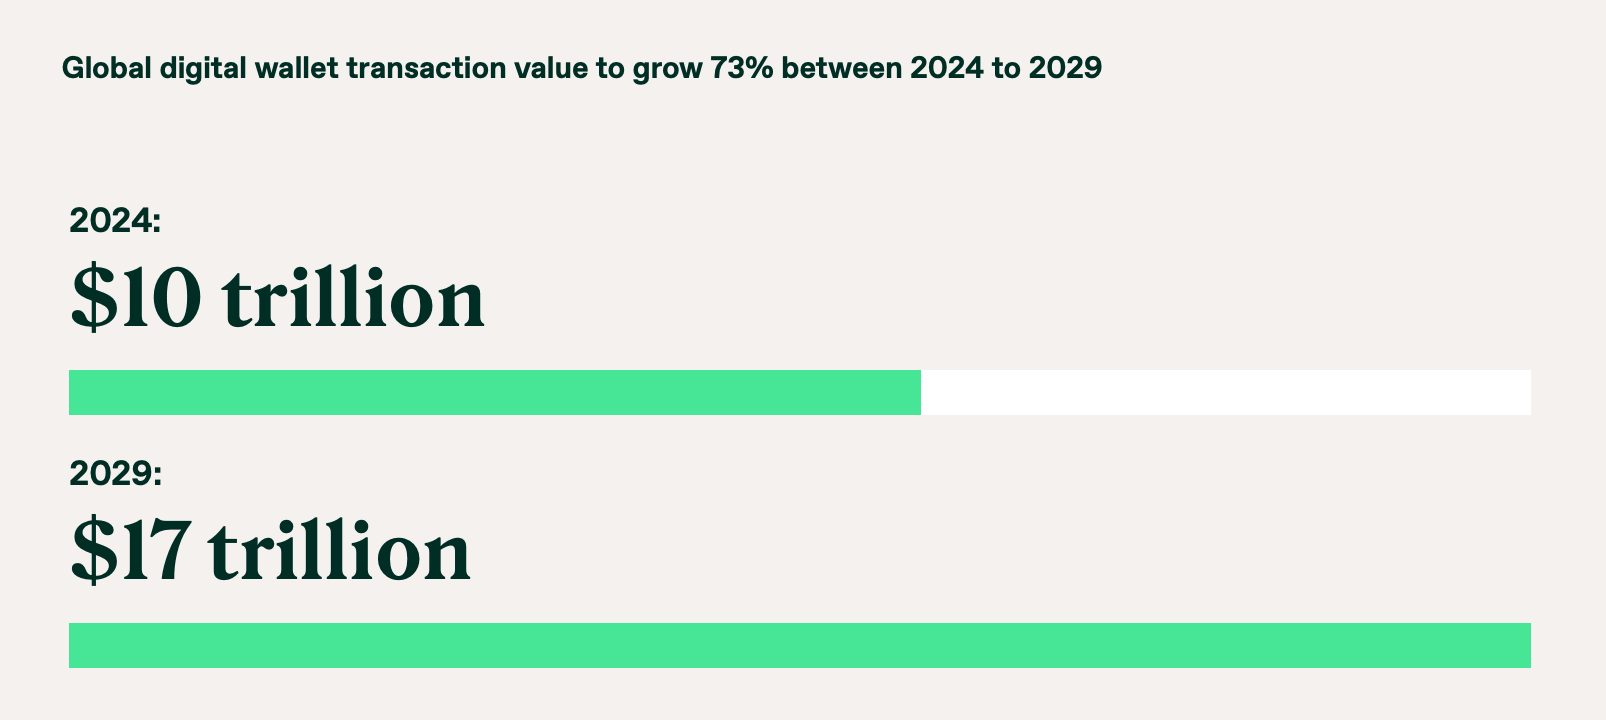
*Image source: Thunes *
**In a 2026 Worldpay report, payment apps, including digital wallets, BNPL, A2A and banking apps, accounted for 37% of global POS transaction value in 2025**[18](#sources)**. Notably:**
- Across ecommerce and in-person payments, apps such as Alipay, [Apple Pay](https://whop.com/blog/apple-pay-whop/) and [PayPal](https://whop.com/blog/paypal-for-business/) now account for over 50% and over 33% of in-person transaction value.
- By 2030, these apps will account for 46% of global POS value or $15.6 trillion.
- Mobile wallets alone will account for 31% of point-of-sale transactions by 2027, overtaking debit cards at 23%.
**Diving deeper, the average digital wallet transaction value was $12.55 in 2026**[19](#sources)**.**
Values were considerably higher in North America, where the typical wallet transaction was $37.81, or roughly three times the global average.
**In the Thunes report, leading mobile wallet providers also varied considerably by market:**
- **US:** Apple Pay (28%) and PayPal (28%)
- **Canada:** Apple Pay (42%) and PayPal (23%)
- **UK:** Apple Pay (51%) and Google Pay (24%)
- **Australia:** Apple Pay (47%) and Google Pay (26%)
- **Germany:** PayPal (38%) and Apple Pay (22%)
- **Brazil:** Bank mobile wallet apps (32%) and PicPay (31%)
- **Mexico:** Mercado Pago (38%) and bank mobile wallet apps (26%)
- **South Africa:** Bank mobile wallet apps (41%) and Samsung Pay (16%)
- **UAE:** Apple Pay (27%) and Google Pay (19%)
### In-app and mcommerce payments
**EMarketer reported that 181.5 million US consumers, or 69.2% of US smartphone users, were expected to use a shopping or retail app at least once a month in 2026.**
By 2029, this is expected to reach 193.2 million users, or 71.1% of US smartphone users.
**77.4% of consumers used smartphones to make online purchases, ahead of computers at 46%.**
Mobile apps were the most popular purchase channel at 70%.
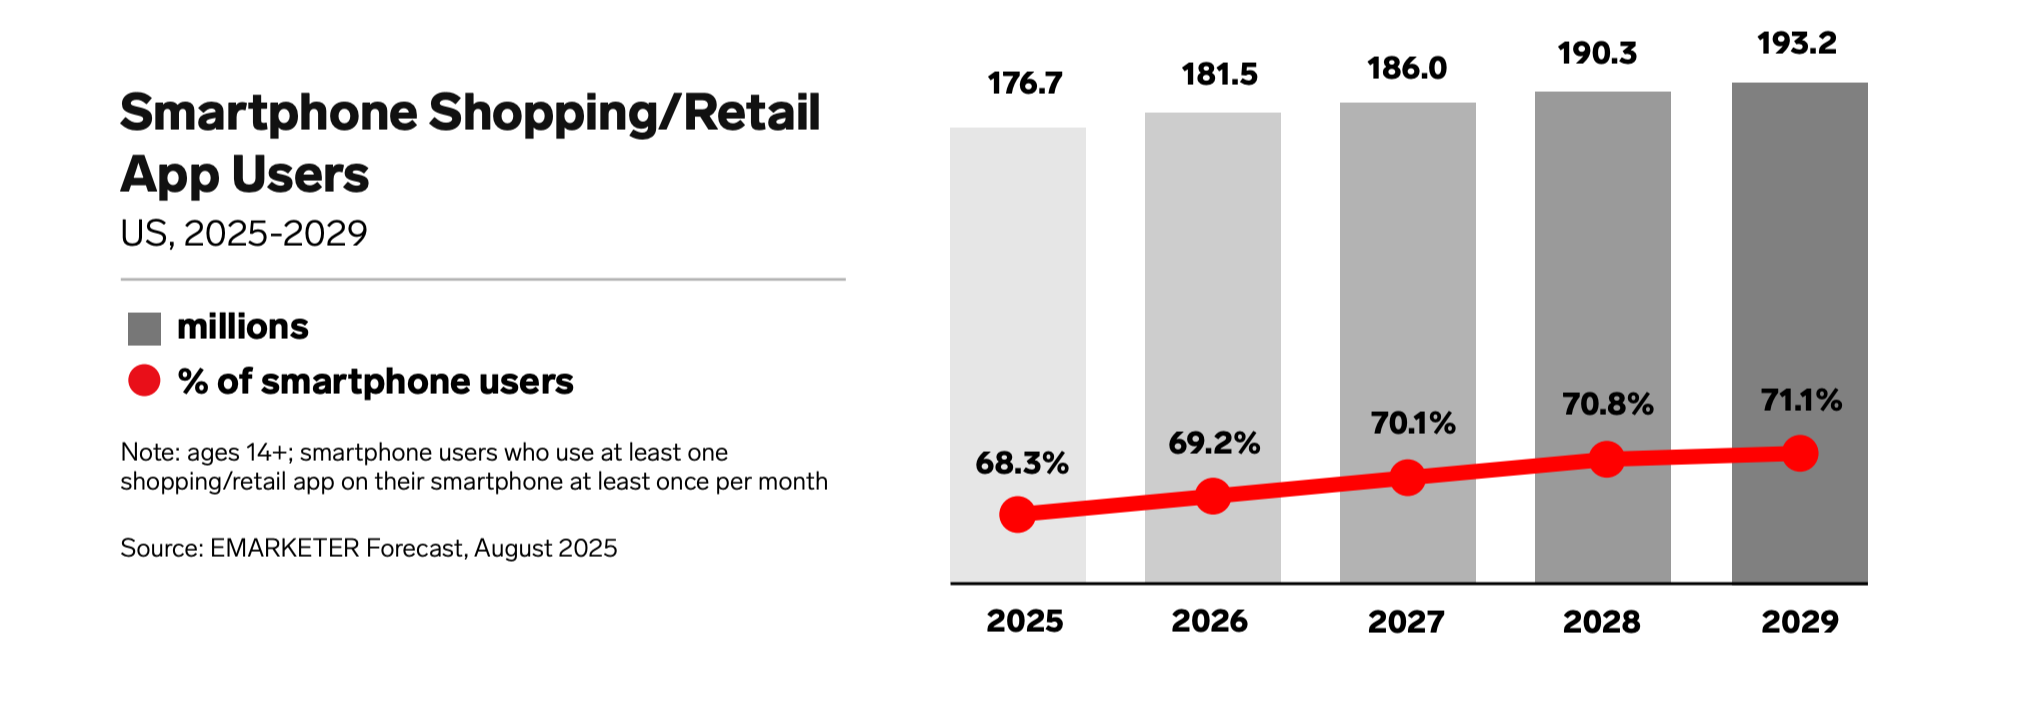
*Image source: EMarketer *
**In a 2026 PYMNTS report, merchants’ own mobile apps stood out as key growth drivers for sales in 2026. 57% saw channel sales climb via mobile**[20](#sources)**.**
Merchant apps also offered a wider range of checkout options than websites, such as:
- Biometrics - 42%
- QR code - 59%
- Digital wallet - 67%
- Payment app - 60%
- BNPL - 46%
- One-click checkout - 61%
**According to a 2024 McKinsey report, digital payments were used for 60% of in-app purchases in the US, up eight percentage points from 2019**[21](#sources)**.**
Meanwhile, in-store mobile wallet usage was 28%, up from 19% in 2019.
**A 2025 NMI report found that 50% of consumers paid through apps weekly or more**[22](#sources)**.**
Usage was much more frequent among younger consumers, with 70% of Gen Z paying through apps daily or more, compared with 32% of millennials.
**In-app payment availability also influenced where consumers chose to shop, with 50% saying it affected their choice of business.**
Among Gen Z and millennials, 64% said it was a deciding factor.
**The report further found that consumers valued when apps eliminated friction and enabled seamless payments (like one-click checkout or auto-pay).**
- 59% of consumers wanted to set up [recurring payments](https://whop.com/blog/recurring-payments-guide/) through an app, particularly for memberships and [subscriptions](https://whop.com/blog/subscription-billing-software/).
- 56% said they’d pay for everything through an app if they could.
**In the previously mentioned EMarketer data, 21.9% of US consumers used retailer apps for mobile checkout or self-checkout while shopping in-store.**
Another 20.4% said they used a retailer’s app in-store to pay with a digital wallet or app-linked payment option.
### QR payments and contactless payments
**The value of global contactless payments made through QR codes, digital ticketing, and near-field communication (NFC) reached $17.3 trillion in 2026**[23](#sources)**.**
By 2031, the market is expected to grow by 86% to $32.2 trillion.
**Breaking it down by type, digital ticketing will see the fastest growth at 126.7%.**
This is followed by contactless payments at 90.2% and QR code payments at 66.7%.
**In 2025, 454 billion retail QR code payments were made globally**[24](#sources)**.**
By 2030, this is expected to increase by 79% to 741 billion.
**In the 2025 Worldpay report, consumers were asked how they typically pay in-store using a mobile device; the share selecting QR codes was:**
- 84% in Argentina
- 80% in China
- 76% in Colombia
- 74% in the Philippines
- 72% in Malaysia
- 71% in Peru
- 66% in Brazil
**Mobile contactless payments were used by 29% of Southeast Asian consumers.**
Usage was considerably higher in Singapore at 53%, Thailand at 47%, and Vietnam at 46%. Among consumers who did not already use contactless payments, 79% expressed interest in mobile contactless options.
**Tap to phone usage grew 200% worldwide year-over-year in 2025**[25](#sources)**.**
Tap to phone lets merchants accept NFC/contactless payments directly on a smartphone, and nearly 30% of sellers using it were new small businesses.
**A 2025 Epos Now survey of merchants found that over 96.5% accepted contactless, tap to pay options**[26](#sources)**.**
50% of merchants saw an increase in contactless payments in the previous 12 months. Looking ahead, 70.2% of merchants identified contactless payments and 62.7% identified digital or mobile wallets as payment trends they expected to affect their businesses over the next three to five years.
### Mobile money
**A 2026 GSMA report found that more than $2.1 trillion flowed through mobile money accounts in 2025, up from $1.7 trillion in 2024**[27](#sources)**.**
Mobile money accounts refer to services that let people store value, send and receive money, and make payments through a mobile account, typically with a network of physical agents for cash-in and cash-out, such as:
- M-Pesa in Sub-Saharan Africa
- Orange Money in the Middle East and North Africa
- JazzCash in South Asia
- Wave Money in East Asia and the Pacific
- Digicel/Haitipay in Latin America and the Caribbean
P2P transfers accounted for 42% of transaction value, followed by cash-based transactions at 37% and ecosystem transactions at 21%.
**In the same report, there were 2.3 billion registered mobile money accounts worldwide in 2025.**
This was up 268 million accounts or 13% more than the previous year. Active 30-day accounts also increased by 15% to 593 million, taking the global monthly activity rate to 25.7%.
**Merchant payments were also the fastest-growing mobile money use case, growing by 42% to $155 billion in 2025.**
They overtook bulk disbursements to become the highest-value ecosystem transaction.
**Additionally, between September 2024 and June 2025, registered merchant accounts grew 41%.**
Meanwhile, monthly active merchants grew 59% among participating providers.
**Showing the growing connection between mobile money and traditional bank accounts, Bank-to-mobile transfers were $167 billion in 2025, while mobile-to-bank transfers were $163 billion.**
These figures increased 37% and 35%, respectively, from 2024.
## Consumers and mobile payments statistics
**In the previously mentioned DataReportal report, over 23% of internet users over 16 used mobile payment services each month.**
Usage was highest among people aged 25 to 34, reaching 25.3% for men and 24.7% for women.
**According to the McKinsey report, digital payments amounted to $10 trillion of annual consumer-to-business spending across the US and Europe.**
Around 90% of consumers in both markets made some kind of digital payment.
**In the same report, ease of checkout and security were among the features consumers valued most in digital payment methods.**
These factors were cited by 74% of US consumers and 71% of European consumers and were also key reasons for using digital wallets.
**In the 2025 FRB study, 58% of consumers used digital wallets for a better payment experience.**
Usage was highest among Gen Z consumers at 80%, followed by millennials at 78% and Gen X at 59%.
**Additionally, while all ages increased their use of phones to pay in person, consumers younger than 35 used their mobile phones more.**
Younger consumers made an average of four in-person non-bill payments, compared with only two payments per month for consumers aged 55 and older.
**In the 2025 PYMNTS report, consumers were 50% more likely to use digital wallets for online purchases than in-store purchases.**
The probability of using a digital wallet online was highest in:
- Germany at 36.2%
- The UK at 34.3%
- Italy at 34.2%
Men also showed a higher probability of using digital wallets overall, at 39%, compared with 34.2% for women.
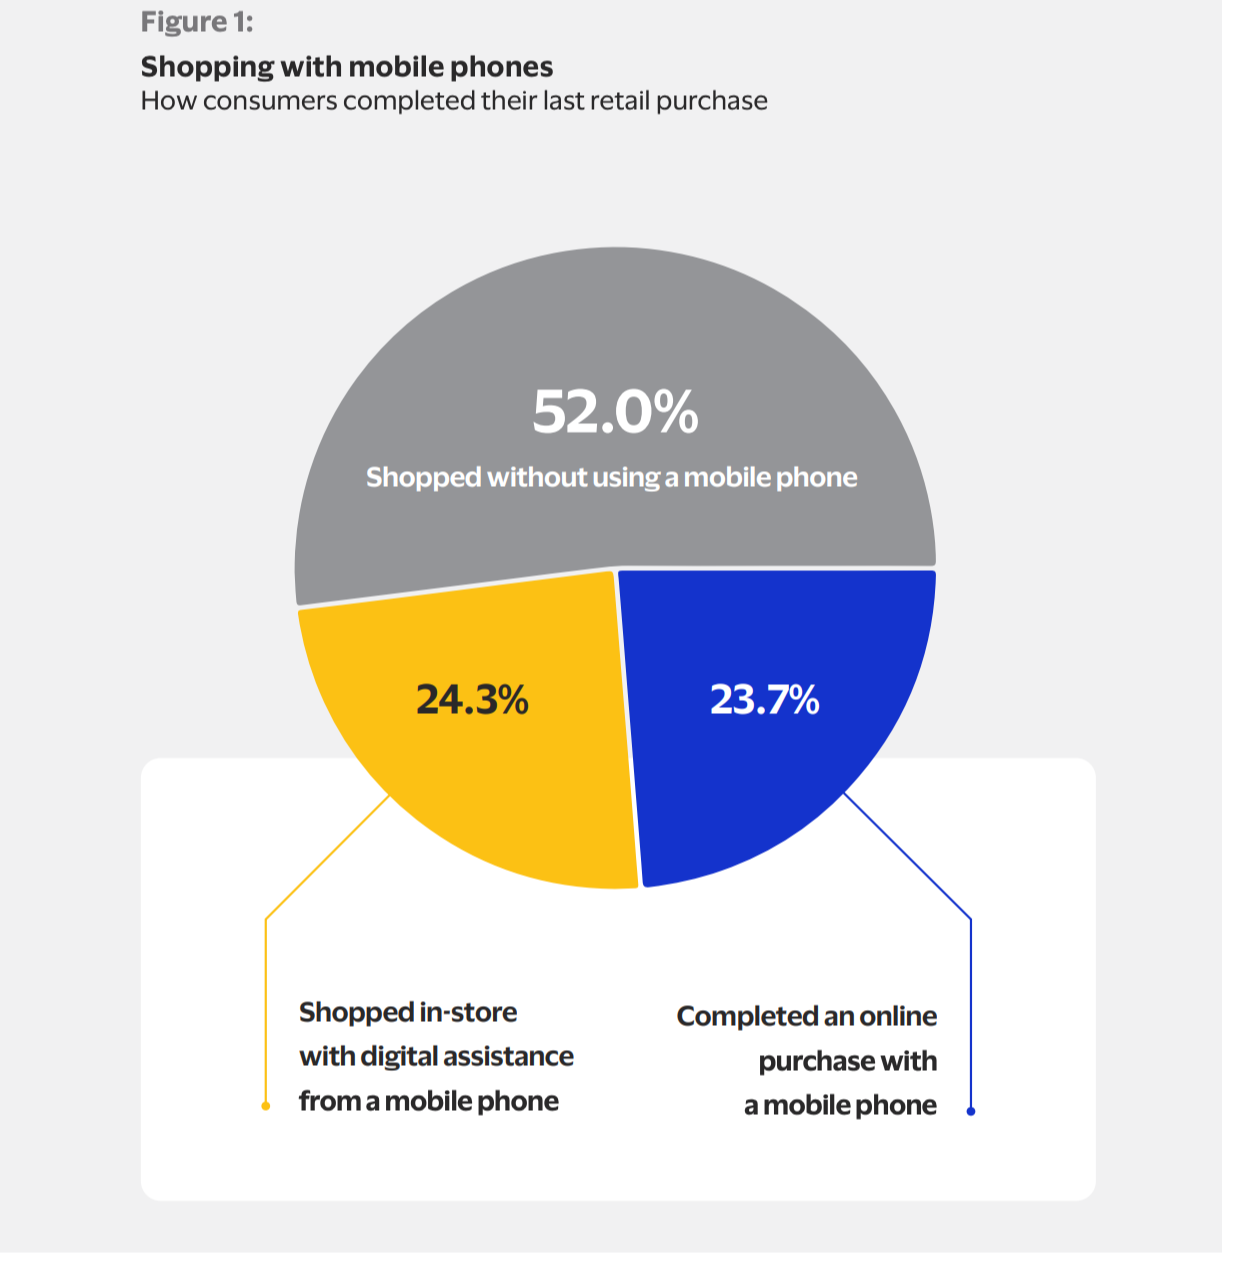
*Image source: PYMNTS *
**Mobile payments usage for in-store transactions was also highest among Gen Z consumers at 35.2%, up 23% from 2022. This was followed by:**
- Millennials at 28%, up 3.7% from 2022
- Generation X at 18.9%, up 5.1% from 2022
- Boomers 9.8%, up 9.9% from 2022
**According to a 2025 Visa Acceptance report, global consumers used a smartphone in nearly 50% of their most recent retail purchases**[28](#sources)**.**
65% of consumers in emerging regions and more than 50% of consumers in younger generations used mobile phones to shop and buy.
**Around 60% of consumers browsed merchant websites on their phones multiple times per week.**
From those visits, consumers went on to make a purchase 50% of the time.
**In the same report, fast and convenient payment experiences also influenced where consumers chose to shop.**
Roughly 56% of consumers chose merchants offering fast payments, secure credential storage, and biometric checkout features.
**Security was also an important consideration for consumers, with 60% of respondents in the report citing data concerns about storing payment information with merchants.**
30% said they only stored their payment information with merchants they trusted.
**The report found that biometric authentication was used by 22% of shoppers for their most recent online purchase made on a mobile device.**
Shoppers around the world looked for five other key features when choosing a merchant, this included:
- Preferred payment method - 74.2%
- Rewards - 67.3%
- Coupon usage - 65.9%
- Easy to navigate online stores - 65.9%
- Product details - 65.2%
**Shoppers also preferred to purchase on a mobile device for these reasons:**
- Convenience - 77.6%
- Not having to go to a store - 61.8%
- Faster purchases - 58.1%
- Saving money and time 54.8%
## Mobile payments fraud statistics
**In the Capgemini report, merchants lost around 2% of their total revenue to payment fraud over the past year.**
Credential abuse and low-value fraud were the most prevalent issues, each affecting 65% of merchants.
**It was estimated that** [**ecommerce fraud**](https://whop.com/blog/ecommerce-fraud-prevention-tools/) **would cost merchants $66.4 billion in 2026**[29](#sources)**.**
Digital goods fraud was highlighted as a key concern with estimated losses of $12.4 billion.
**Juniper Research projected that the total number of fraudulent transactions across digital banking and money transfers would reach 773.7 million in 2026 and rise to 2.2 billion in 2031**[30](#sources)**.**
This represents a 180.3% increase over the forecast period as digital banking, mobile payment platforms and mobile money services continue to expand.
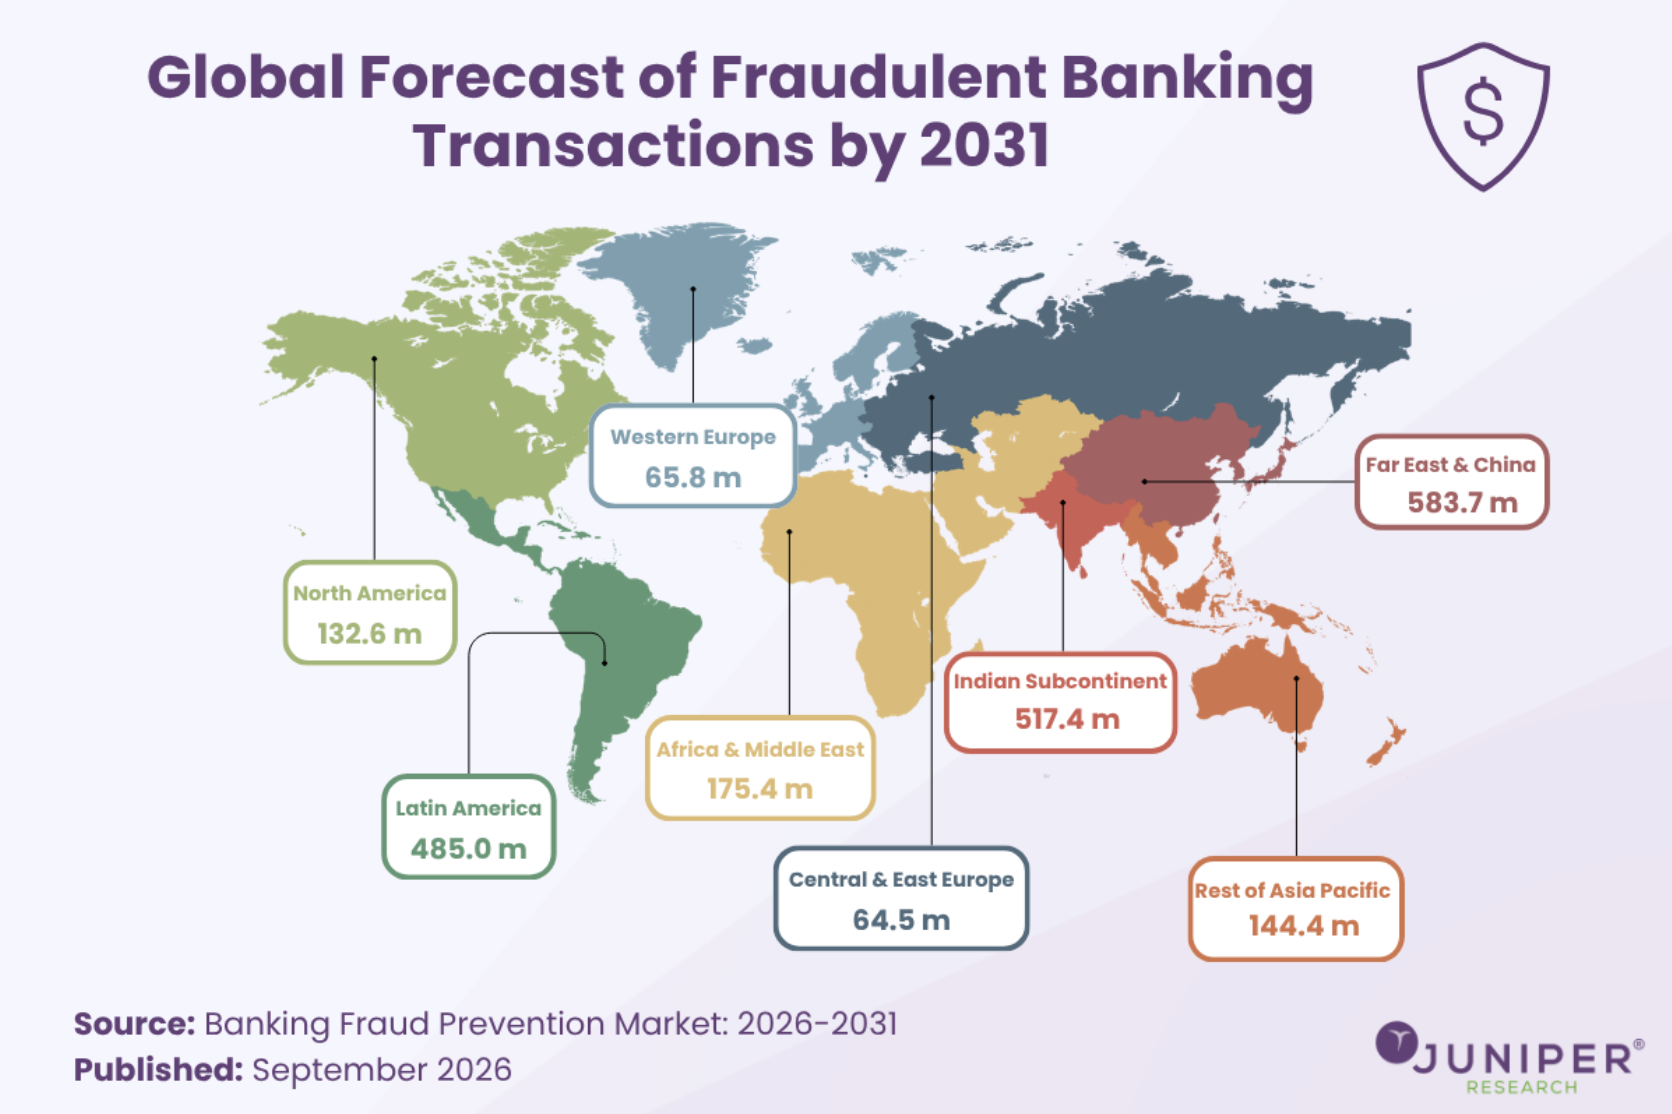
*Image source: Juniper Research*
**Global research across 42 markets conducted by GASA and Feedzai found that in 2025, 23% of adults lost money to scams**[31](#sources)**.**
Global losses were estimated at $442 billion, and among people who lost money, 17% paid scammers through a digital wallet, and 14% through a peer-to-peer online payment service.
**The same report also found that 53% of people approached by scammers were contacted by phone call, while 51% were contacted by text/SMS.**
These were the two most common scam contact channels globally, ahead of email at 47%.
**According to a 2026 BioCatch report, 90% of all reported scam attacks took place on mobile devices**[32](#sources)**.**
This was up 5 percentage points from 2025. By comparison, mobile devices accounted for 75% of traditional unauthorized fraud cases.
**In a 2026 Zimperium report, 54% of consumers selected mobile apps as their primary method for managing bank accounts, making mobile a growing target for fraud**[33](#sources)**.**
In fact, 80% of fraud events occurred through online or mobile platforms. The same report also highlighted the rise in banking trojans as one sign of the shifting threat landscape. Attacks on Android smartphones increased 56% in 2025, while unique banking-trojan installation packages rose 271% year-over-year.
**A 2025 IC3 report highlighted several fraud types affecting mobile payment and banking users:**
- Account takeover fraud, which generated about $359.7 million in losses[34](#sources)
- SIM-swap fraud, which accounted for $17.4 million in losses
- Phishing and spoofing, which caused $215.8 million in losses
- Cryptocurrency-related losses of around $11.37 billion
**According to the Global Payments report, 86% of merchants said security and fraud prevention technology was important when choosing a payment technology partner.**
This came in second only to customer support.
**In the PYMNTS report, merchants reporting an increase in the frequency of selected fraud types highlighted:**
- Account takeovers - 14%
- Friendly fraud - 16%
- Card testing - 16%
**The same report also showed improvements in several other areas:**
- Fraudulent charges: 16% of merchants reported an increase, down 9 percentage points from 2024.
- False declines: 16% reported an increase, down 8 percentage points.
- Disputes: 18% reported an increase, also down 8 percentage points.
**Despite these improvements, 60% of merchants were very or extremely interested in upgrading their fraud protection.**
Interest was highest in Brazil at 67%, followed by the UAE at 60% and the US at 54%. Large merchants and SMBs also showed similar levels of interest, at 62% and 59%, respectively.
## Mobile payments challenges statistics
**In the previously mentioned Visa Acceptance report, nearly 60% of merchants were concerned their payment technology could not support the growing demands of mobile-first shoppers.**
The top 5 challenges to providing a more unified shopping experience included:
- Complexity managing multiple sales channels
- Data security risks
- Customer service challenges
- Difficulty integrating different software or systems
- Data management difficulties
These concerns were highest in Mexico at 71.9%, followed by Brazil at 69.4% and Saudi Arabia at 66.3%. Merchants in the UK and UAE also reported relatively high concern, at 64.1% and 62.1%, respectively.
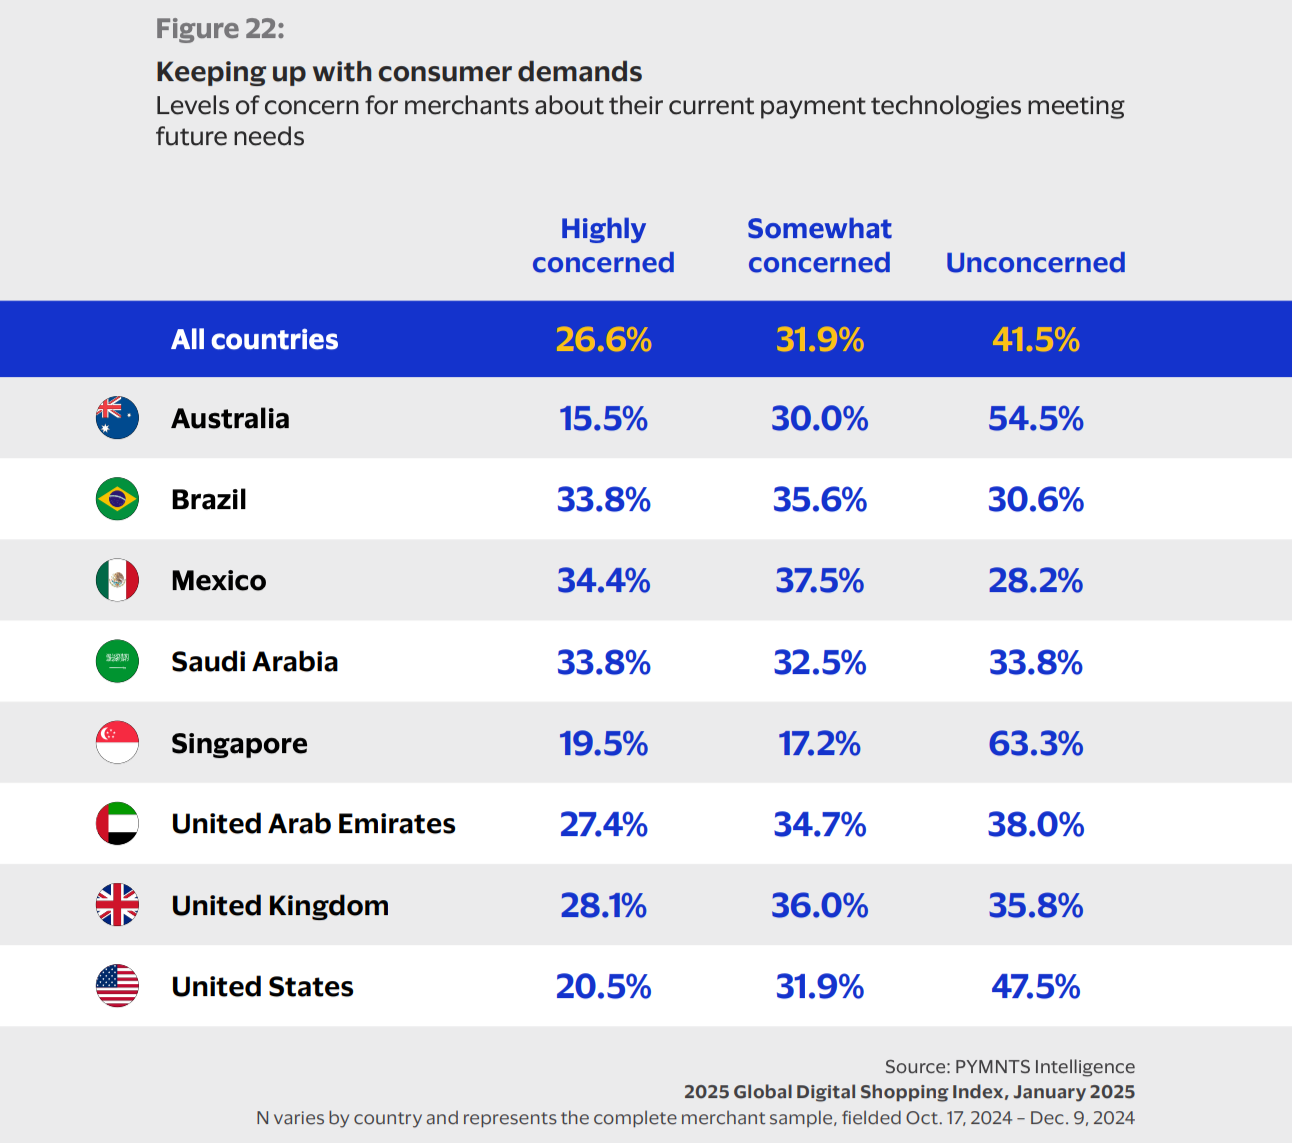
*Image source: PYMNTS *
**87% of merchants said their checkout experience needed at least some improvement in the 2026 PYMNTS report. Notably:**
- Only 38% of merchants currently included biometric authentication across their apps or websites.
- Buy now, pay later (BNPL) was another in-demand feature, yet offered by only 51% of merchants.
**According to the Visa Acceptance report, mobile shoppers were more likely to experience payment problems, with 23% reporting a processing error during their latest online purchase.**
This was compared with 17% of shoppers who completed their last purchases on a computer.
**24% of ecommerce businesses considered limited payment options as the key reason customers abandoned their carts**[35](#sources)**.**
This was among other key factors like no stock (38%), delivery options (31%), and returns policy (26%).
**In a 2024 FRB study, 45% of consumers identified high fees charged by payment service providers as a top challenge**[**36**](#sources)**.**
This was followed by slow speed of funds (25%), inadequate security features (18%), and processing errors (15%).
**Similarly, in the Epos Now survey, 77.6% of merchants identified high transaction fees as a leading challenge.**
Meanwhile, over 50% saw lower transaction fees as the one key factor that would improve their payment system experience.
## Mobile payments trend statistics
**Among the key technologies enabling more secure mobile payments is biometric authentication. The global biometric payment market is expected to grow to $25.7 billion by 2030**[37](#sources)**.**
This represents an 87% increase from $13.72 billion in 2026, linked partly to greater smartphone adoption, fraud concerns, and biometric authentication being built into mobile wallets and banking apps
**Mobile payments are expected to play a larger role in broader digital experiences, with the global super apps market projected to grow from $114.2 billion in 2025 to $595.8 billion by 2034**[38](#sources)**.**
That’s a CAGR of 20.15% between 2026 and 2034, driven primarily by rising smartphone use, demand for convenience, and wider use of integrated digital payment options.
**Mobile payments are also expanding into new applications such as ticketing. According to earlier Juniper Research, 31% of people are expected to use mobile ticketing technology by 2026, typically through QR codes or NFC for contactless access to events, stadiums, and transport systems.**
Air travel is one example, with 1.7 million airline tickets expected to be issued directly to mobile phones in 2026, helping make check-in and boarding faster for travelers.
**Mobile users are also gaining access to more payment options through digital currencies, with stablecoins emerging as a growing use case for digital transfers and remittances.**
As of 2025, [stablecoins](https://whop.com/blog/accept-crypto-payments/) reached a market capitalization of around $210 billion, up 57% year-over-year, and generated more than $26 trillion in transaction volume[39](#sources).
**Consumer interest is particularly visible in cryptocurrency payments and stablecoin-based international transfers. A 2025 Visa report found that:**
- 45% of Gen Z in the US would be excited to receive cryptocurrency[40](#sources).
- 41% of US remittance users say they’re likely to use stablecoins for international money transfers in the future.
- Interest in using stablecoins for future remittances was highest in the UAE at 66%, followed by Brazil at 65%, Mexico at 62%, and South Africa at 57%.
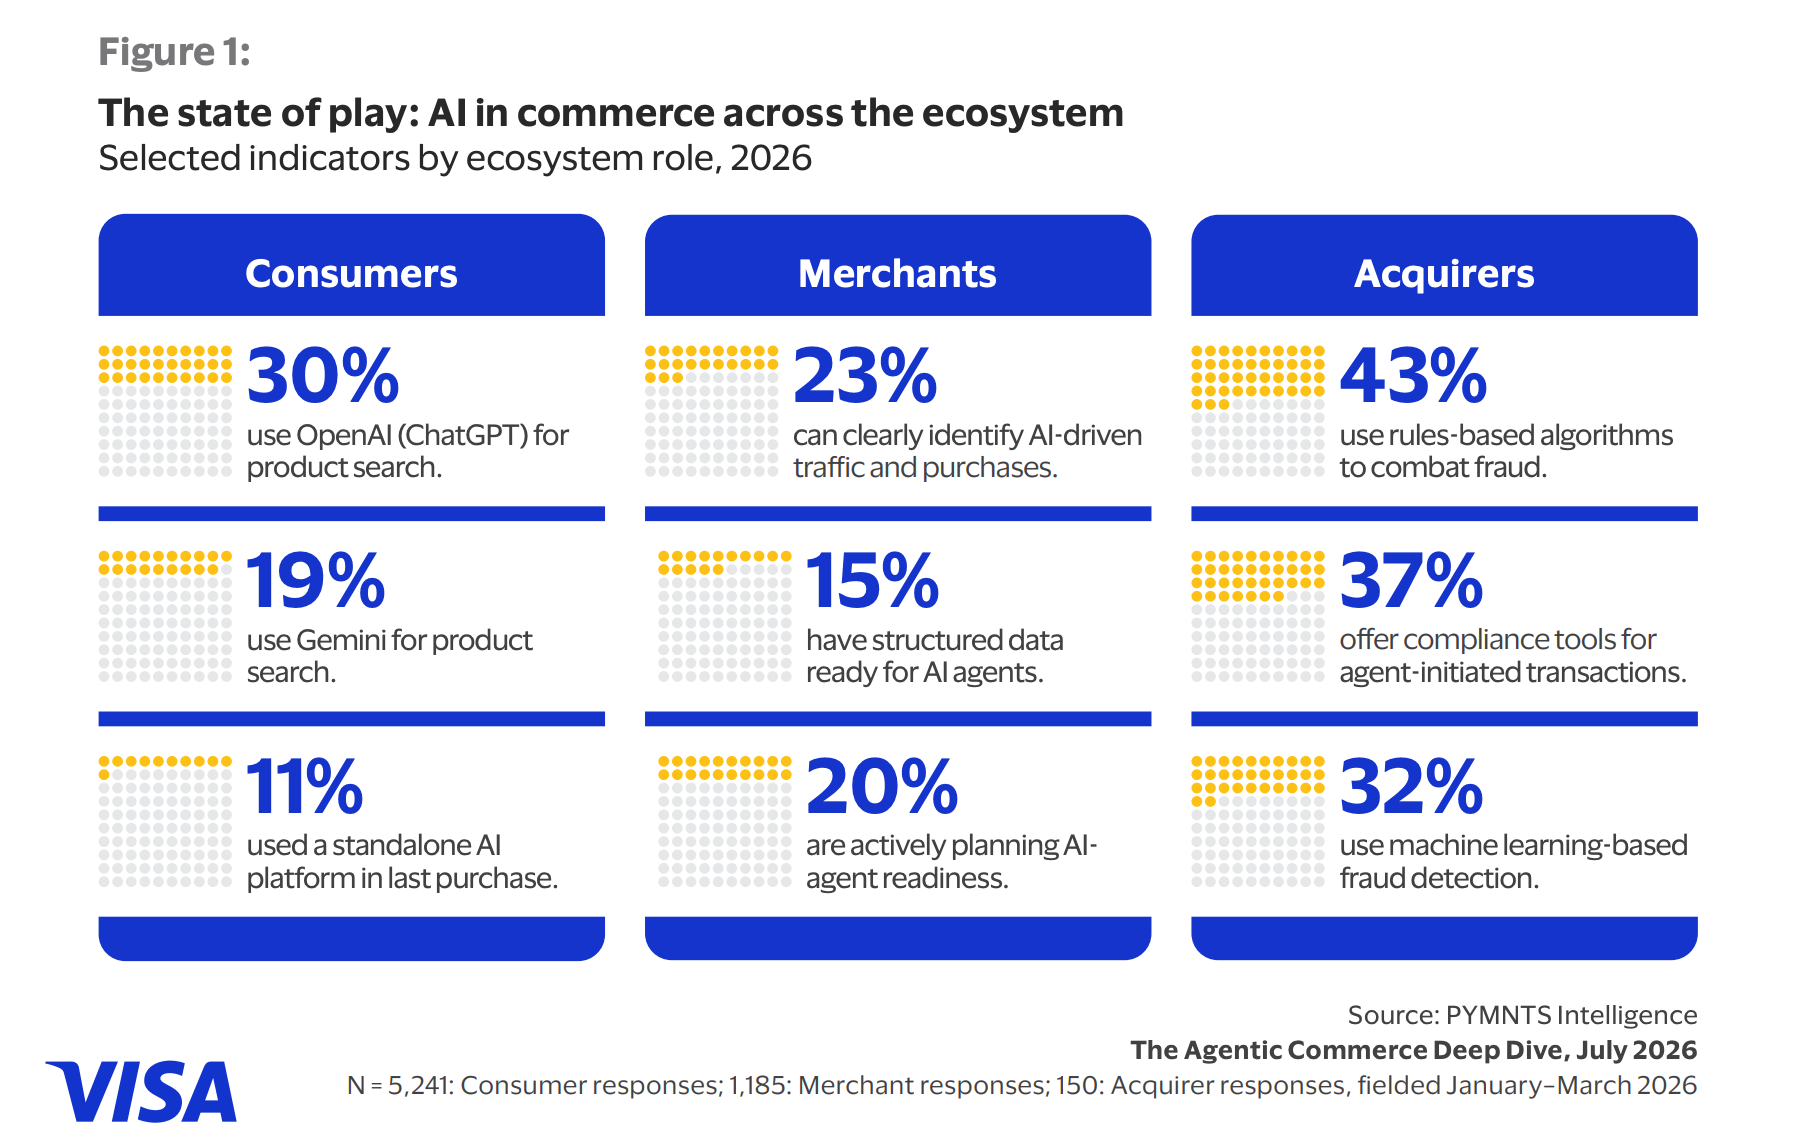
*Image source: Visa Acceptance*
**AI is starting to play a larger role in mobile payments. In a 2026 Visa Acceptance report looking at agentic commerce, overall consumer usage of AI-powered shopping tools roughly doubled between mid-2024 and early 2026**[41](#sources)**.**
64% of consumers expected to use AI shopping agents within two years, including 30% who expected to use them frequently or always.
**Consumers are already comfortable giving AI a role in parts of the shopping journey, although they remain more cautious about payments.**
Some 48% of online shoppers used AI to research a recent purchase, 56% were comfortable allowing an agent to search for and compare products, and 51% would let one manage their loyalty program. Only 35% would give an agent access to saved payment credentials.
**The same report found that 15% of merchants expected AI agents to generate more than 30% of their sales within two years.**
Meanwhile, 67% expected agents to account for at least 5%.
**That expected shift is already influencing payment technology investment.**
28% of merchants planned to invest within 12 months in technology that would allow AI agents to select payment methods or financing options at checkout. Another 27% planned to invest within 24 months.
## Accept mobile payments anywhere with Whop

[Watch video](https://storage.ghost.io/c/12/7b/127b828b-bdc2-4972-9cf2-de857df9c324/content/media/2026/07/gif_tapping_1920x1080--1-.mp4)
Mobile is fast becoming the default way to pay, but many businesses are still catching up. Whop gives businesses a checkout built for the way that customers want to pay.
With Whop, you can embed checkout directly on your own site or app, with Apple Pay and Google Pay built in. Add a one-press express checkout, and for US-businesses, take in-person payments with Tap to Pay on iPhone.
**Ready to accept more mobile payments?**
**[Join Whop](https://whop.com/network/)**
---
## FAQs
### What are the three types of mobile payments?
The three common types of mobile payments are mobile wallets like Apple Pay, QR code payments, and NFC/contactless payments that enable tap-to-pay via a phone or wearable. Other popular forms include in-app payments, mobile money, and mobile bank transfers.
### What is the most widely used mobile payment app in the world?
With a user count of more than 1 billion, Alipay is the most widely used mobile payment app in the world.
## Sources
> **References**
>
> - [Research and Markets](https://www.researchandmarkets.com/reports/6241846/global-mobile-payments-market-size-and-forecast?utm_source=GNE&utm_medium=PressRelease&utm_code=z6sp9g&utm_campaign=2324806+-+Global+Mobile+Payments+Market+Databook+2026%3a+Presents+Transaction+Value+and+Volume+Across+70%2b+KPIs&utm_exec=jocamsai)
> - [Worldpay](https://www.worldpay.com/en/press-releases/10-years-cash-cards-and-crypto-worldpays-global-payments-report)
> - [Capgemini](https://www.capgemini.com/insights/research-library/world-payments-report-2026/)
> - [DataReportal](https://datareportal.com/reports/digital-2026-global-overview-report)
> - [Juniper Research ](https://www.juniperresearch.com/research/fintech-payments/ecommerce/ecommerce-payments-market-report/)
> - [Statista ](https://www.statista.com/topics/11883/mobile-commerce-worldwide/?srsltid=AU7gw4UgFIpM4hUOidK5XA_JO3l8vpPkveax8RNzsrPLWoaw3i5A-Elj)
> - [EMarketer](https://image.insight.insiderintelligence.com/lib/fe2d11737164047b7c1576/m/1/T-Mobile_EMARKETER_Snapshot_2026.pdf?_gl=1*1rw3vdt*_gcl_au*MTYwNjA4NzkyLjE3OTA2Mzc1OTMuNDQ1MDM4ODgwLjE3OTA2Mzc2MjcuMTc5MDYzNzYyNy4xNDk0NzcwNDEyLjE3OTA2Mzc2MjcuMTc5MDYzNzYyNw..*_ga*MzMwODQ4NDU2LjE3OTA2Mzc1OTM.*_ga_XXYLHB9SXG*czE3OTA2Mzc1OTMkbzEkZzEkdDE3OTA2Mzc2MzIkajIxJGwwJGgyOTM3MjY2OTc.)
> - [Juniper Research](https://www.juniperresearch.com/press/mpos-transactions-to-grow-by-83-percent)
> - [Juniper Research](https://www.juniperresearch.com/research/fintech-payments/emerging-payments/instant-payments-research-report/)
> - [PYMNTS](https://www.pymnts.com/wp-content/uploads/2025/06/PYMNTS-How-the-World-Does-Digital-June-2025.pdf)
> - [Sensor Tower](https://go.sensortower.com/rs/351-RWH-315/images/2026_Digital_Wallet_Payments_Report.pdf)
> - [Visa Acceptance](https://www.visaacceptance.com/content/dam/documents/campaign/fraud-report/2026_Global_eCommerce_PaymentsandFraudReport.pdf?utm_source=chatgpt.com)
> - [Global Payments](https://cdn.bfldr.com/LIZ7AMUB/at/xgvmnhw745x7xxtzb5n6kz6/2026_Global_Payments_Commerce_and_Payment_Trends_report)
> - [FRB](https://www.frbservices.org/news/research/2025-findings-from-the-diary-of-consumer-payment-choice)
> - [UK Finance](https://www.ukfinance.org.uk/system/files/2025-10/Payment%20Markets%20Report%20Summary.pdf)
> - [Global Payments](https://www.worldpay.com/en/global-payments-report-2025)
> - [Thunes](https://www.thunes.com/wp-content/uploads/2025/09/The-Complete-Guide-to-Mobile-Wallets_20250527_v11.pdf)
> - [WorldPay](https://www.worldpay.com/en-GB/insights/articles/gpr-2026-trend-1)
> - [Juniper Research](https://www.juniperresearch.com/resources/blog/11-payment-stats-you-need-to-know-for-2026/)
> - [PYMNTS](https://www.pymnts.com/wp-content/uploads/2026/06/PYMNTS-Intelligence-Global-Digital-Shopping-Index-Merchant-Edition-June-2026.pdf)
> - [McKinsey](https://www.mckinsey.com/industries/financial-services/our-insights/banking-matters/state-of-consumer-digital-payments-in-2024)
> - [Juniper Research ](https://www.juniperresearch.com/press/contact-free-payments-become-default-as-contactless-exceed-32tn/)
> - [Juniper Research](https://www.juniperresearch.com/press/digital-wallets-qr-codes-to-constitute-half-wallet-transactions/)
> - [Visa](https://sg.review.visa.com/content/dam/VCOM/regional/ap/singapore/global-elements/documents/visa-cpa-2024-report-smt.pdf)
> - [Visa](https://corporate.visa.com/en/sites/visa-perspectives/newsroom/visa-tap-to-phone-adoption-soars.html)
> - [Epos Now](https://www.eposnow.com/us/resources/payment-trends-in-2026-evaluation-and-predictions/)
> - [GSMA](https://www.gsma.com/sotir/wp-content/plugins/plugin_gsma_sotir/reports/The-State-of-the-Industry-Report-2026_English.pdf)
> - [Visa Acceptance](https://www.visaacceptance.com/content/dam/documents/campaign/shopping-index/global-digital-shopping-index-2025-global-edition-en-us.pdf)
> - [Juniper Research](https://www.juniperresearch.com/resources/blog/11-payment-stats-you-need-to-know-for-2026/)
> - [Juniper Research](https://www.juniperresearch.com/resources/infographics/how-large-will-the-digital-fraud-problem-become-by-2031/)
> - [GASA ](https://gasa.org/knowledge-base/blog/global-scams-on-the-rise-over-half-of-adults-worldwide-report-scam-encounters?utm_source=chatgpt.com)
> - [BioCatch ](https://www.biocatch.com/hubfs/FINAL_ENG_global%20scams.pdf)
> - [Zimperium](https://lp.zimperium.com/hubfs/MAPS/REPORT/FIN/2026%20Mobile%20Banking%20%20Report.pdf)
> - [IC3](https://www.ic3.gov/AnnualReport/Reports/2025_IC3Report.pdf)
> - [DHL](https://www.dhl.com/content/dam/dhl/local/global/dhl-ecommerce/documents/pdf/g0-ecs-e-commerce-trends-report-business-edit.pdf)
> - [FRB](https://fedpaymentsimprovement.org/wp-content/uploads/2024-consumer-payments-study.pdf)
> - [Research and Markets ](https://www.researchandmarkets.com/report/biometric-payments)
> - [IMarc](https://www.imarcgroup.com/super-apps-market)
> - [BCG](https://web-assets.bcg.com/25/91/2269153c468ca43684442f055cb0/2025-global-payments-report-sep-2025.pdf)
> - [Visa ](https://corporate.visa.com/en/sites/visa-perspectives/trends-insights/2025-spending-shift-report.html/)
> - [Visa Acceptance](https://www.visaacceptance.com/content/dam/documents/campaign/shopping-index/2026-global-digital-shopping-index-agentic-edition.pdf)