
Extremes 月額 / Extremes
先物・FX対応|当日の伸び切った位置を上下の帯で表示 / Where price has stretched today, futures and FX
※ English below
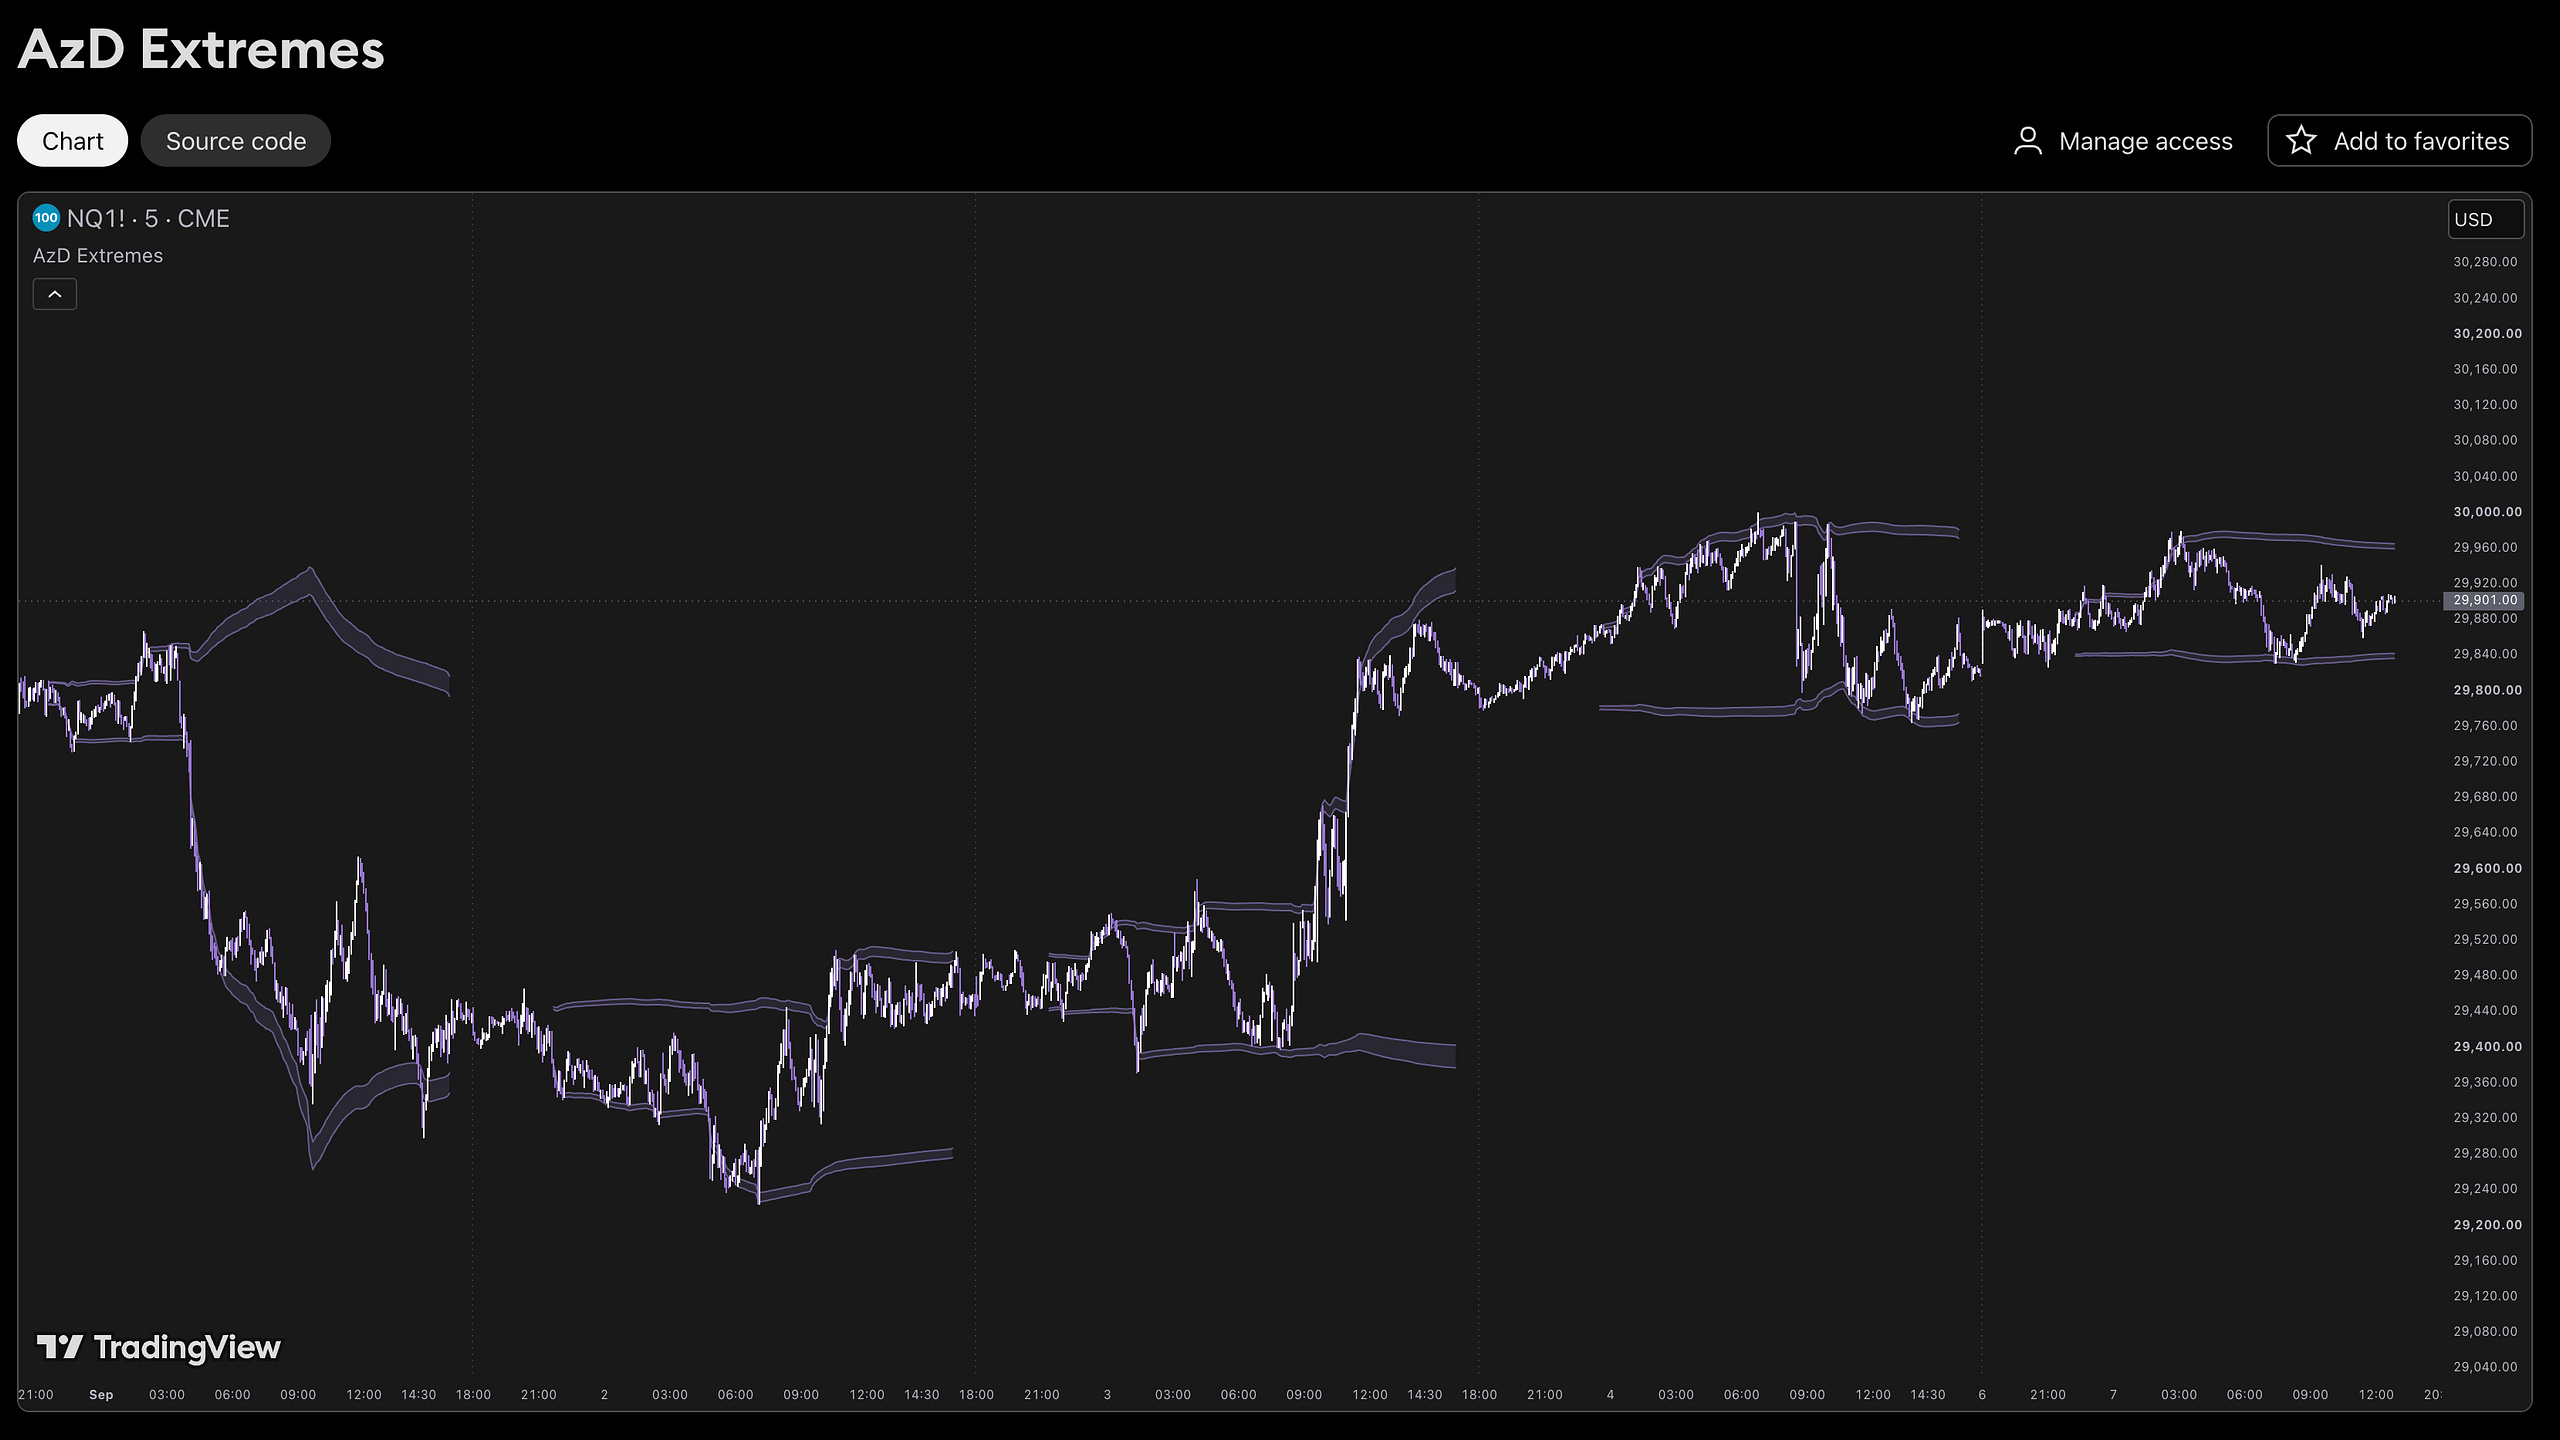
当日の値動きから見て価格が伸び切った位置を、上下2本の帯で表示する TradingView インジケーターです。水準を示すだけで、売買シグナル・目標値・損切り位置は一切出しません。
■ 表示されるもの
上下2本の帯だけです。中心線は引きません。使うのは端だけだからです。
帯は進行中の当日の値動きだけから毎足作り直されます。幅も価格からの距離も日によって変わります。上下は左右対称ではありません。
■ 出るタイミング
時刻ではなく、当日が読めるだけ動いた時点で出ます。夜間が活発だった日は早く、静かだった日は遅く出ます。現物市場の引けで止まり、直近5営業日分がチャートに残ります。
■ 設定でできること
表示のみ。表示の有無と色だけです。帯を動かす設定はありません。同じチャートを見ている全員に同じ帯が出ます。
■ 対応銘柄・時間足
CME の先物(株価指数・エネルギー・金属・金利・通貨・暗号資産/ミニ・マイクロ)と現物FX。穀物先物は対象外です。時間足は1・2・3・5・6・10・15・30分足。
───
■ English
Two bands, one above price and one below, marking where the current trading day has left price stretched. It reports a level; it never issues a buy or sell signal, a target or a stop.
■ What it draws
Two bands and nothing else. There is no centre line — the edges are the part you use.
Rebuilt every bar from the day in progress alone. Not the same width and not the same distance out every day. The upper and lower band are not symmetrical.
■ When it appears
Not at a clock time — once the day has moved enough to be read. Earlier after a busy night, later after a quiet one. It stops at the cash close, and the last five sessions stay on the chart.
■ What the settings control
Display only — visibility and colour. Nothing moves a band, so everyone on the same chart sees the same two bands.
■ Supported
CME futures on the 18:00–17:00 clock (index, energy, metals, rates, currency, crypto / mini and micro) and spot forex. Grains excluded. Timeframes 1, 2, 3, 5, 6, 10, 15 and 30 minutes.
- 2 months agoAmazing indicator! The developer is incredibly responsive to user feedback and constantly updates it. Highly recommend checking it out!Written 25 days after purchase
- 2 months agoA convenient indicator because it is very easy to see and easy to understand.Written 20 days after purchase
- 2 months agoI Love the indicator, I use it as a confluence but, si powerfull that he can be use and traded only by itself 🔥🔥. It's definitly a good investment.Written 4 days after purchase
- 2 months agoここ3日間このインジケーターを使ってみました。週末ということもあってリアルタイムの相場があまり動いていなかったので、主にバックテストをしていました。 今のところ、バックテストではかなり良い結果が出ています。特にLiquidityがとても役立っていて、重要な流動性を見つけやすいです。また、相場のBiasもかなり特定しやすくなったと感じています。 インジケーター自体も見やすくて、チャートがごちゃごちゃしないところも気に入っています。 まだ実際の相場で十分なsetupを確認できていないので、週明けからリアルトレードでも使いながら、さらに検証していきたいです。 これからもっと使って、気づいたこ...Written 2 days after purchase