
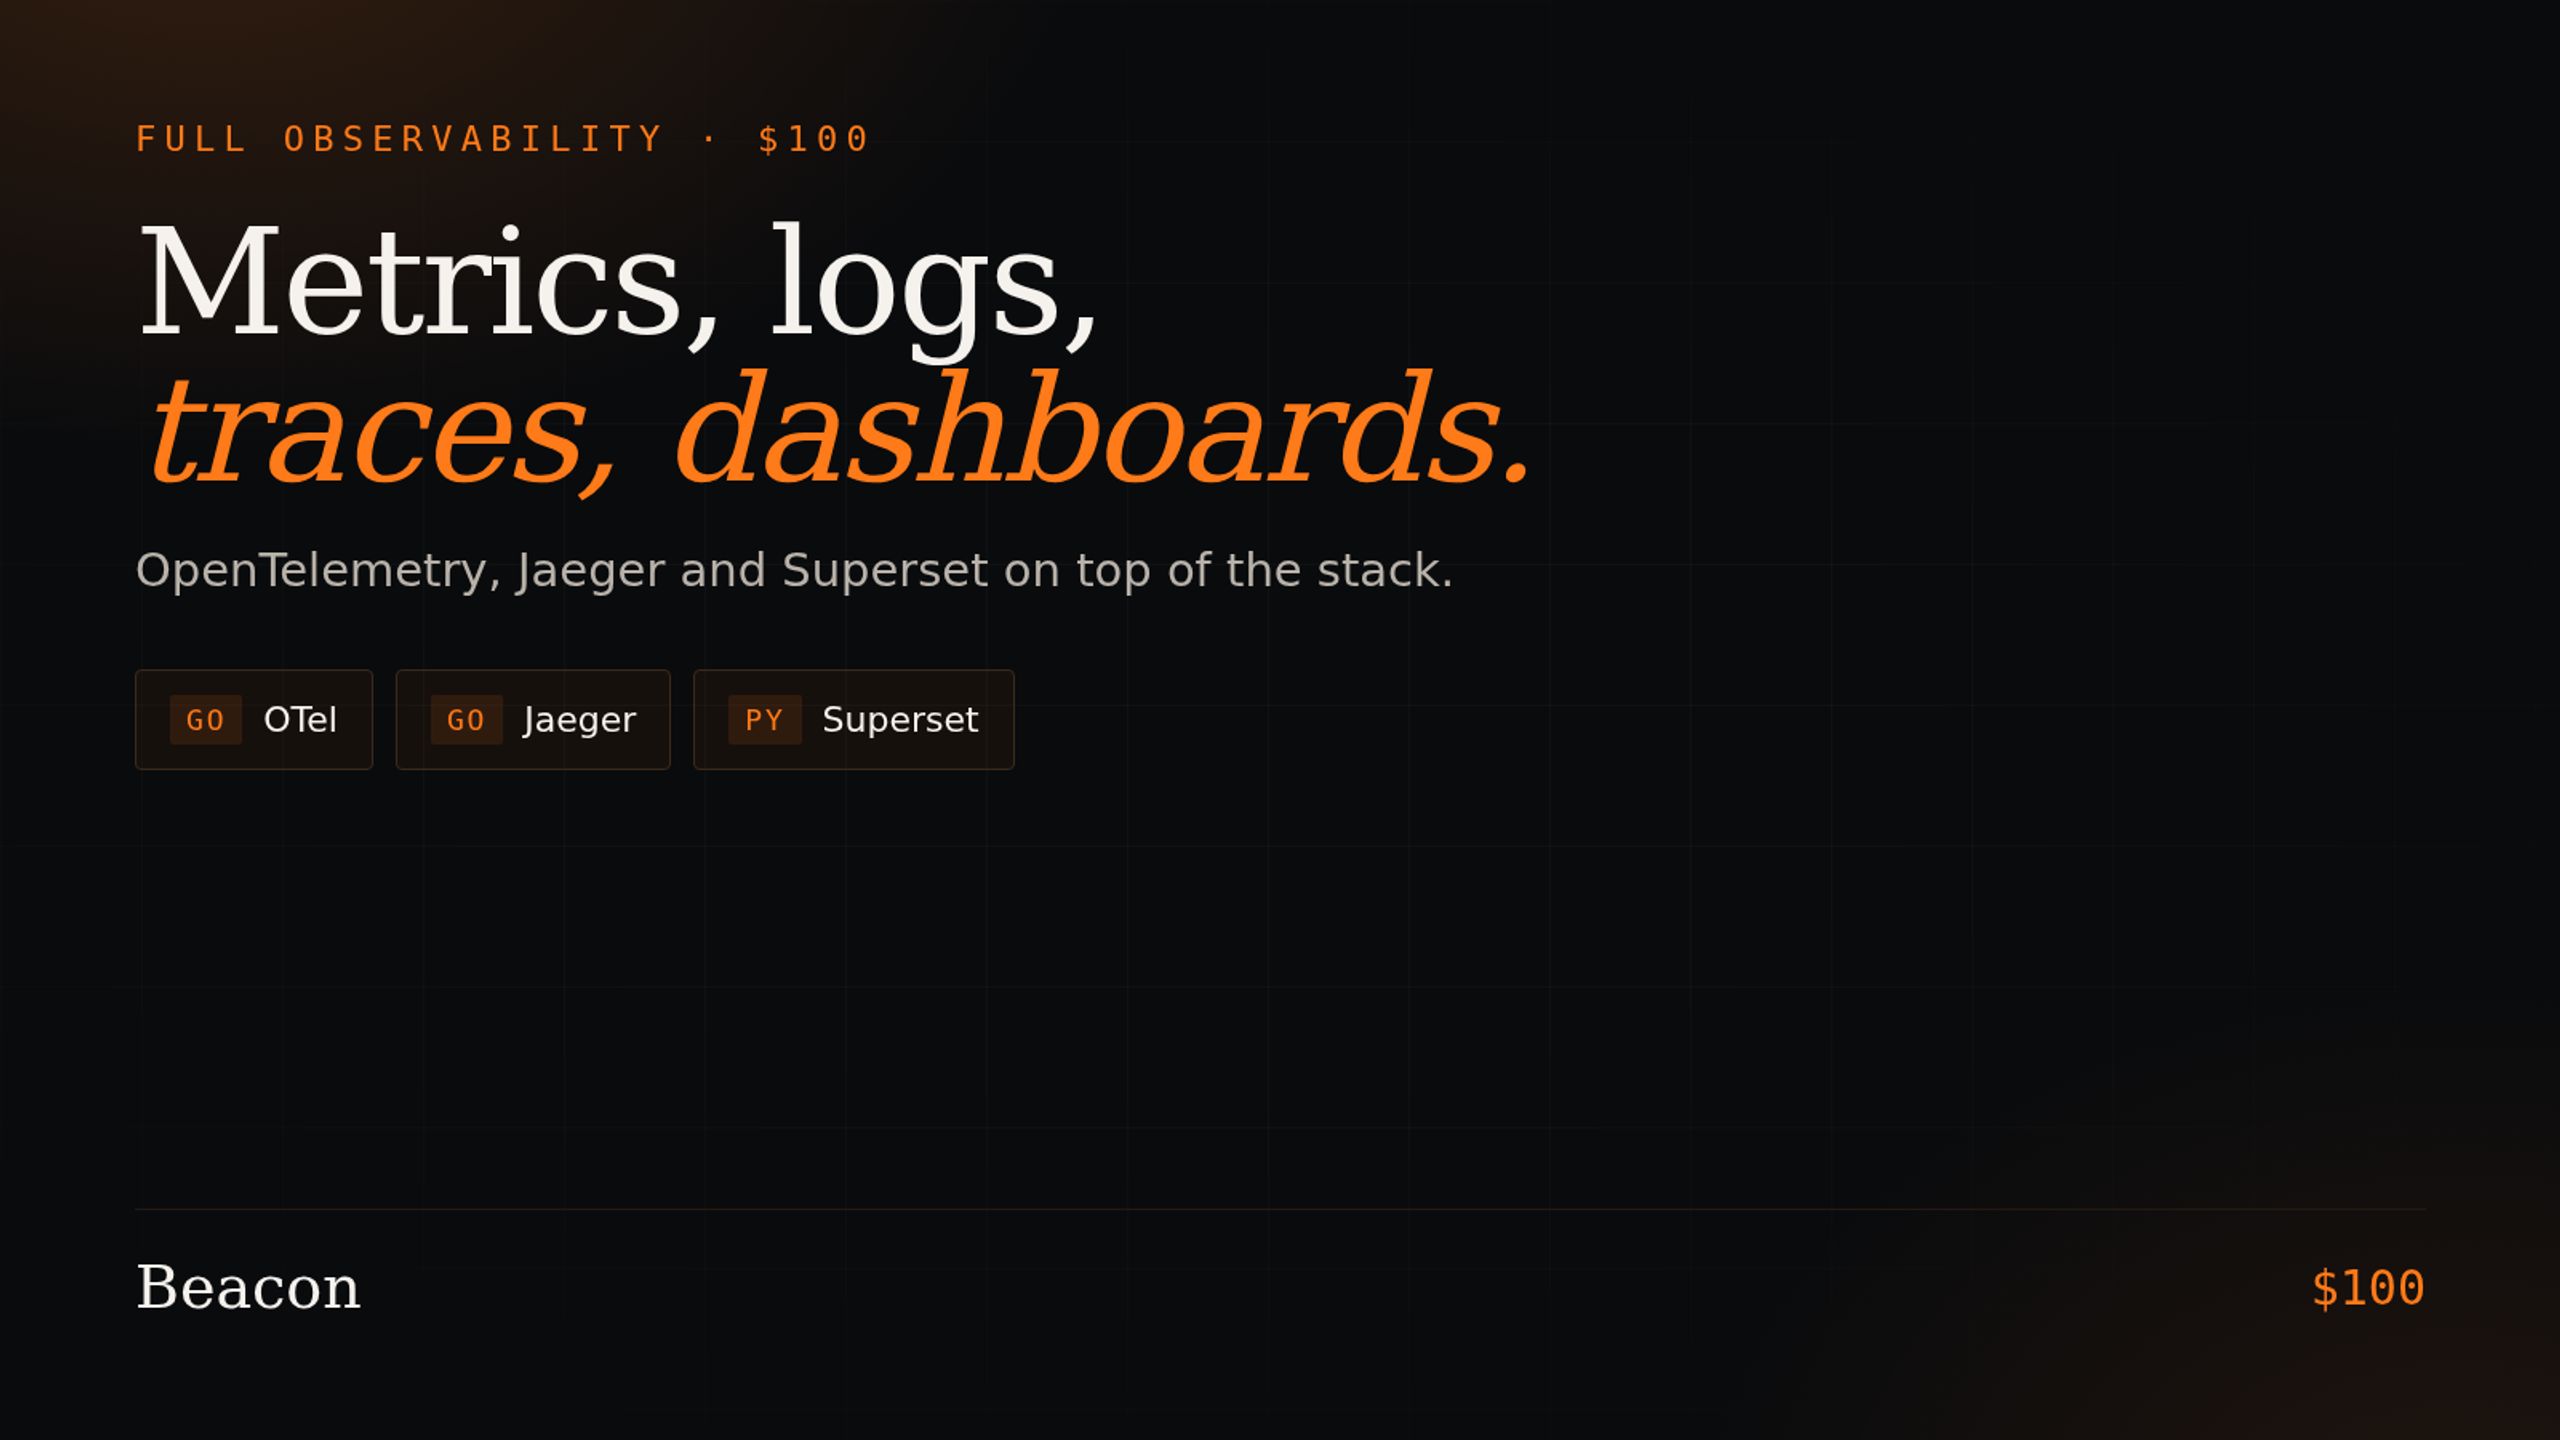
Beacon Full Observability
Metrics, logs, traces and dashboards.
Everything in Logs & Metrics, plus tracing and dashboards.
WHAT YOU GET
Everything in Beacon Logs & Metrics, plus:
OpenTelemetry Collector (Apache-2.0) - one pipeline for metrics, logs and traces. Vendor-neutral, and where the industry is standardising.
Jaeger (Apache-2.0) - distributed tracing. Follows a single request across every service it touches, which is the only reliable way to find where latency actually comes from.
Superset (Apache-2.0) - dashboards on top of your metrics and business data. One place to look at everything instead of three.
Plus a dashboard guide covering what to put on a first dashboard and what to leave off.
WHY TRACING HERE
Metrics show a p99 went up. Traces show which service and which query caused it. Without traces, latency investigations are guesswork.
ALL OPEN SOURCE, ALL PERMISSIVE
Apache-2.0 throughout. Full attribution with pinned commits included.
REQUIREMENTS
Docker Engine 24+ with Compose v2. 12 GB RAM recommended.
Instant delivery. One-time purchase, free updates.