
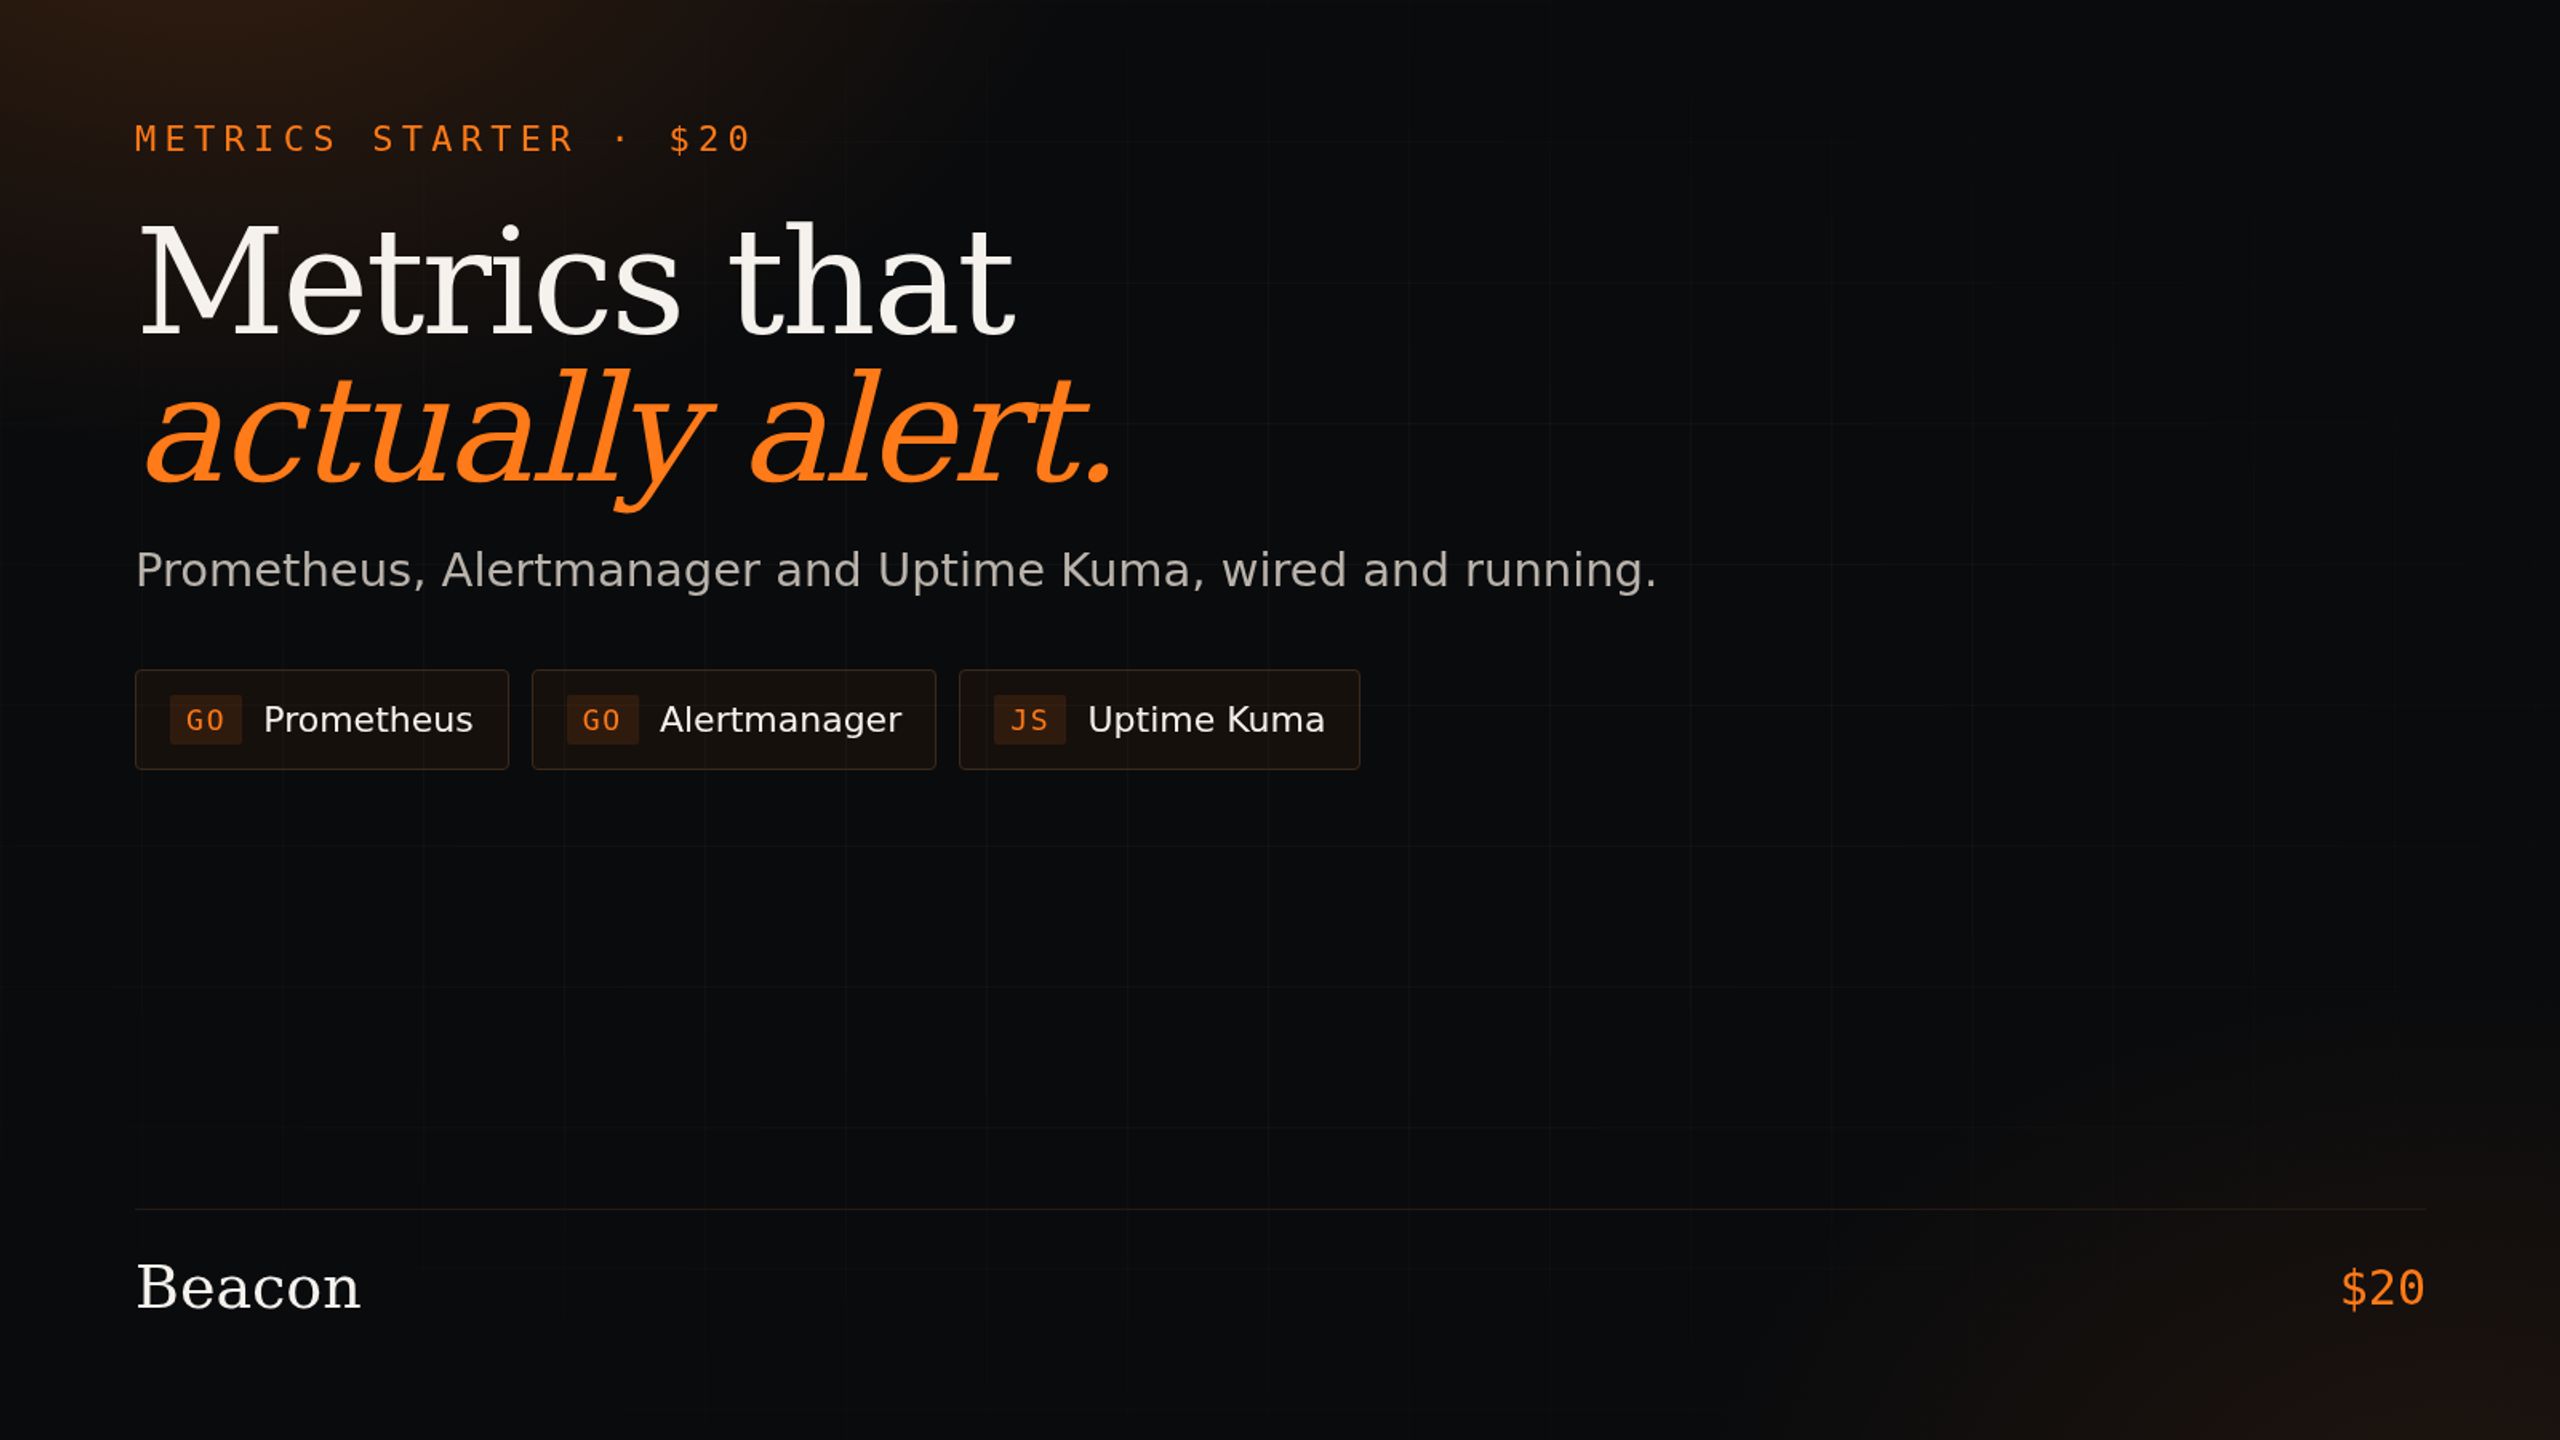
Beacon Metrics Starter
Collect metrics and get alerted when something breaks.
A working, pinned Docker Compose stack for self-hosted metrics. Not a link dump - the integration layer, done for you.
WHAT YOU GET
- docker-compose.yml wiring the services together
- .env.example with pinned image tags
- README quickstart
- verify.sh - checks each service is actually serving
- RUNBOOK.md - operations, troubleshooting, retention sizing
- fetch-sources.sh - pulls each project at an exact pinned commit
- docs/ - one page per component
WHAT’S INSIDE
Prometheus (Apache-2.0) - the default for time-series metrics. Scrapes your services on an interval and stores what it finds. Query with PromQL, graph over time, and see what changed before an incident.
Alertmanager (Apache-2.0) - takes alerts from Prometheus and gets them to a human. Routing, grouping and deduplication, so you are not woken by the same alert twelve times.
Uptime Kuma (MIT) - watches your endpoints from outside and tells you when they stop responding. The check that catches what internal metrics miss.
WHY THESE THREE
Internal metrics tell you what a service thinks it is doing. External checks tell you what users actually experience. Alerts turn both into something a person sees. Most outages are caught by one of the three, and this ships all of them wired.
ALL OPEN SOURCE, ALL PERMISSIVE
MIT and Apache-2.0. Full attribution with pinned commits included.
REQUIREMENTS
Docker Engine 24+ with Compose v2. 4 GB RAM.
Instant delivery. One-time purchase, free updates.