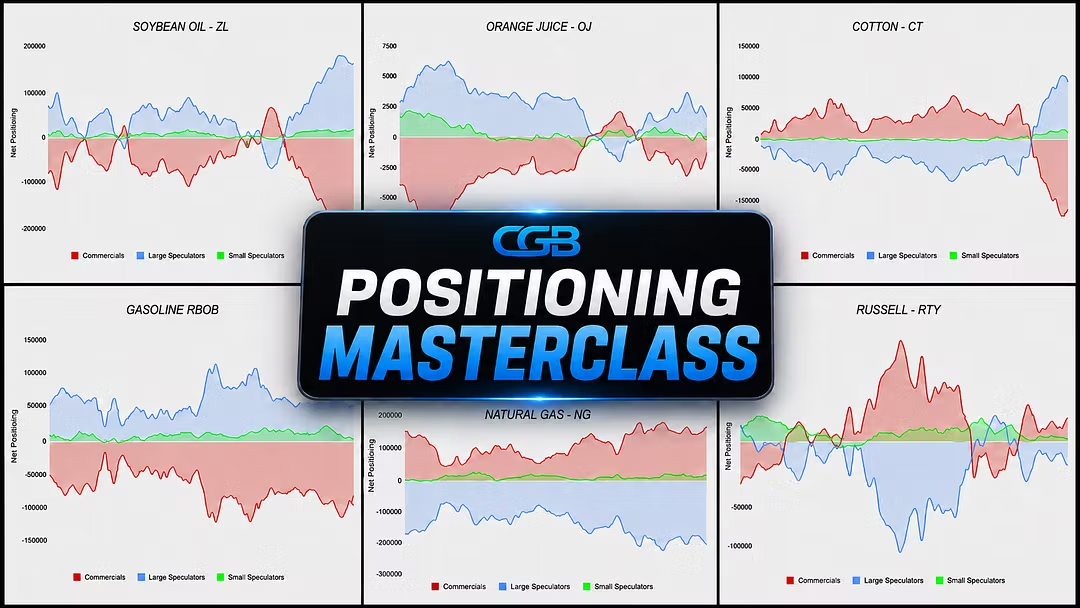
CGB COT CHARTS
A live COT dashboard covering 37+ of the most liquid futures markets
The Commitments of Traders report is one of the best risk management tools a trader can have. It shows you how commercials, large speculators, and small speculators are positioned in every major futures market - so you know when positioning is stretched, when a crowd is leaning too hard one way, and when a market is quietly building toward a move.
Used properly, COT data keeps you out of crowded, low-quality setups and points you toward the markets with genuine risk-to-reward on your side.
What you get:
A fully interactive COT dashboard. Built in Google Sheets, covering 37+ of the most liquid futures assets. Click into any market and explore its full historic positioning - not just a static snapshot.
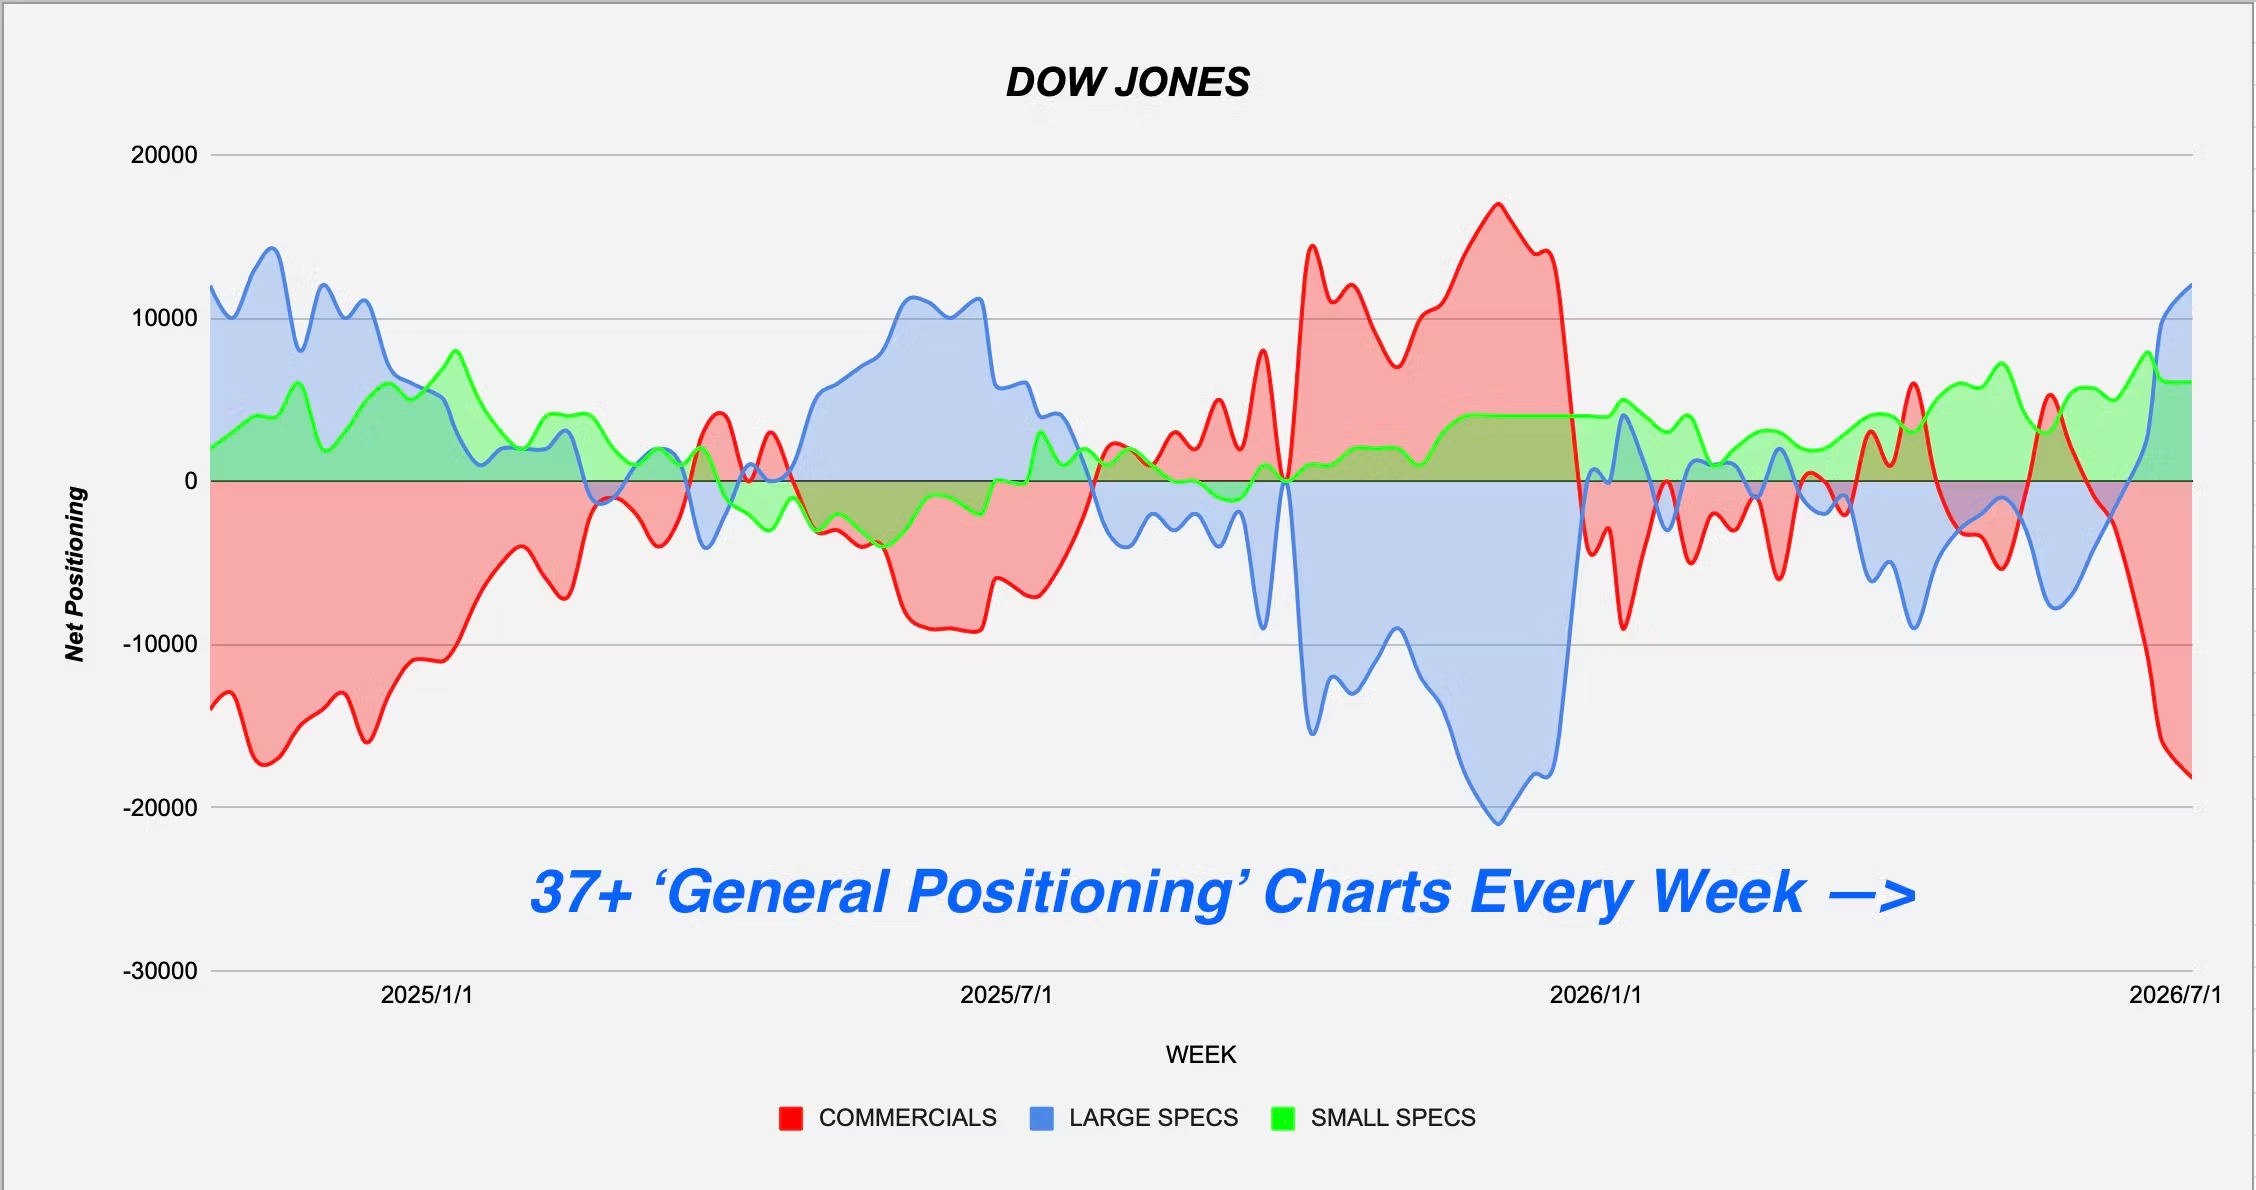
General positioning chart. The big-picture view. See whether current positioning in any asset is normal, stretched, or approaching a historic extreme.
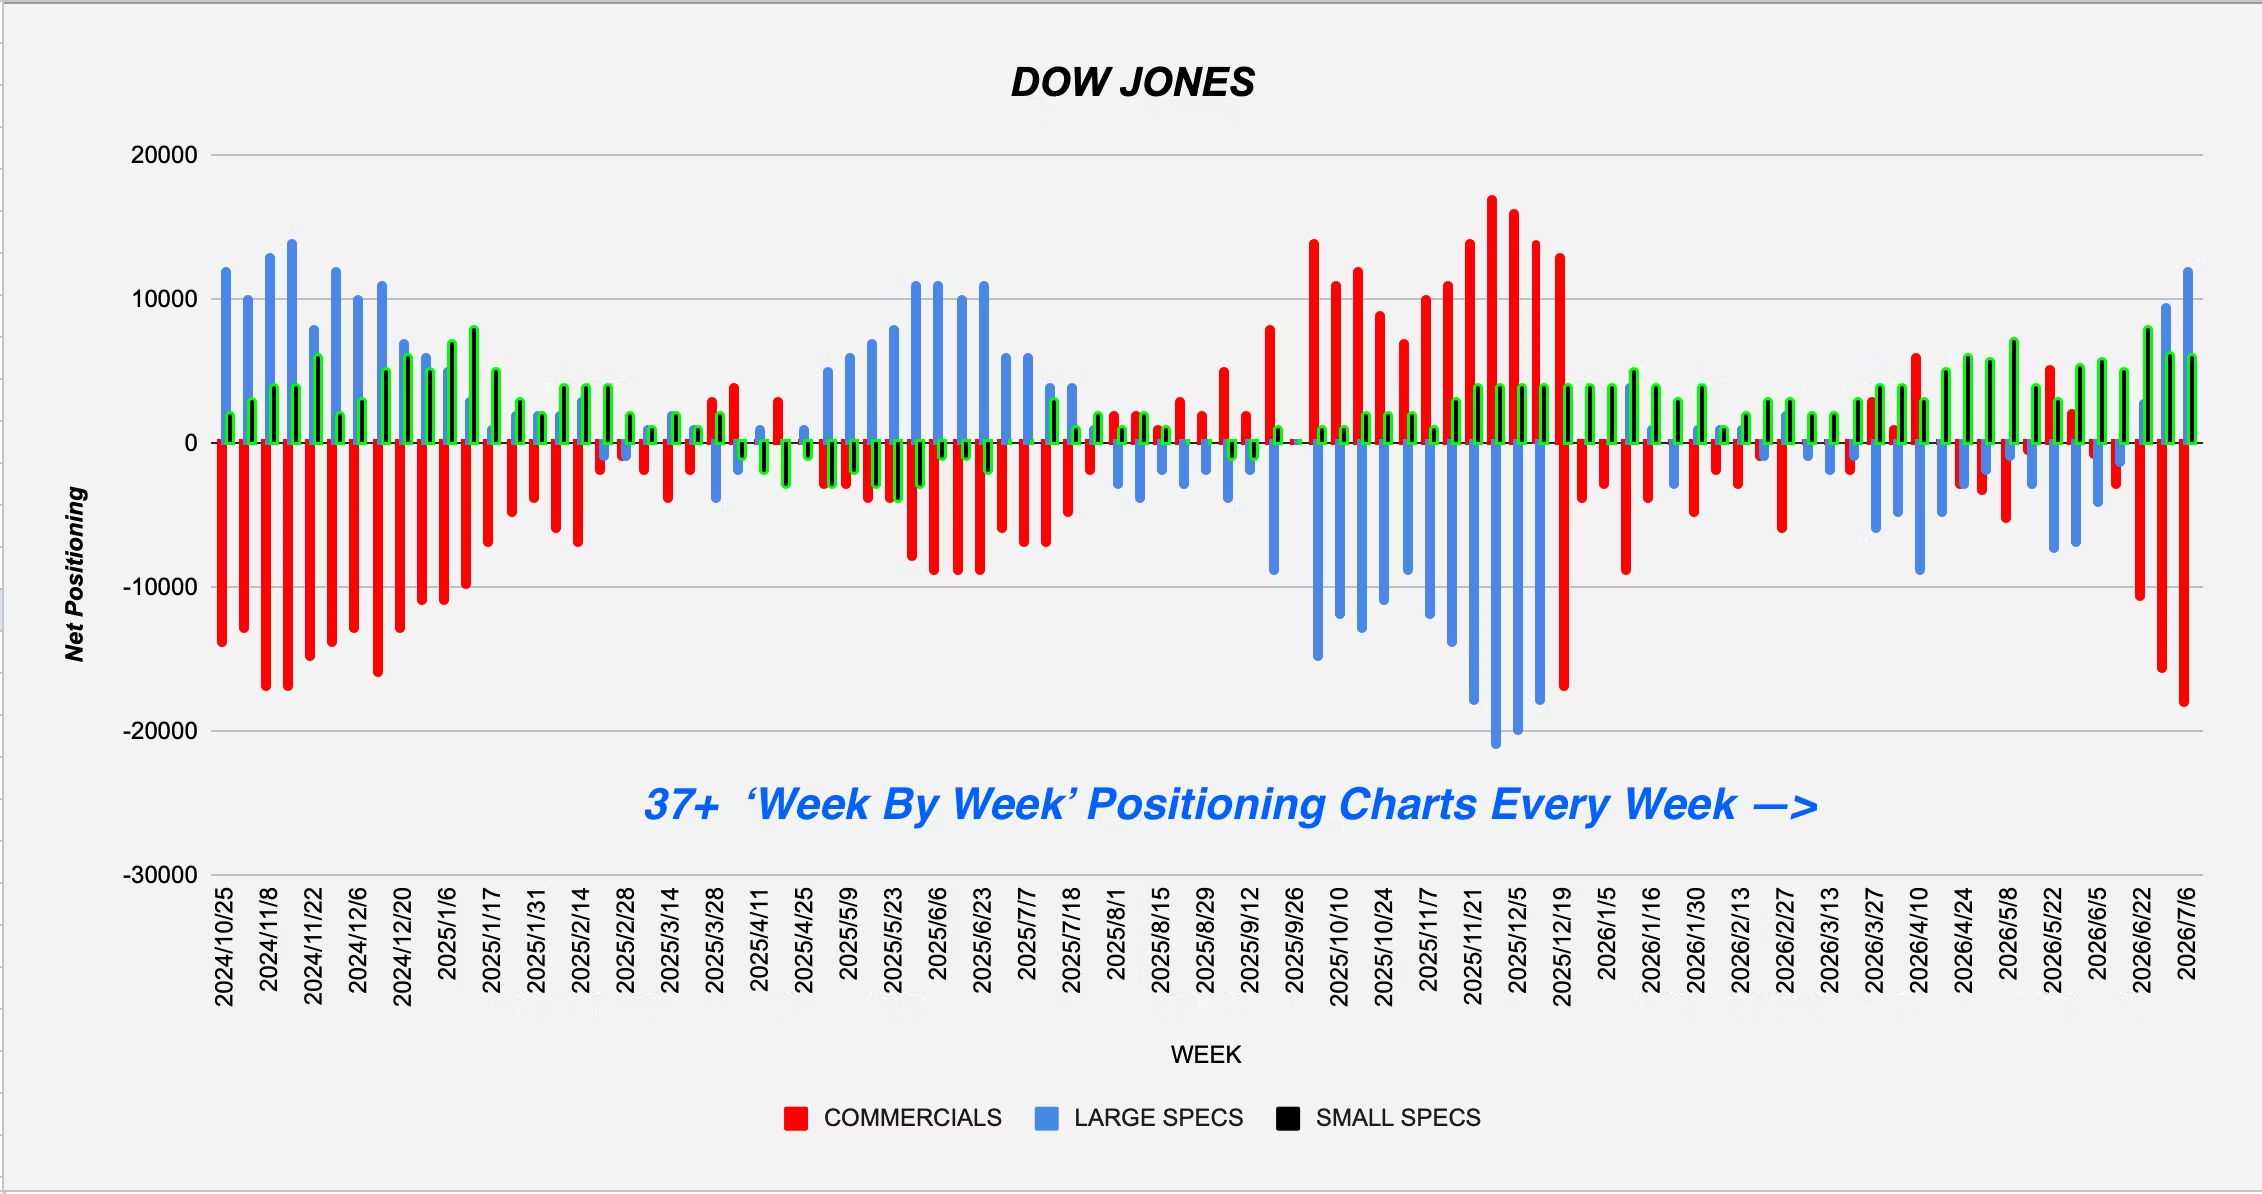
Week-by-week positioning chart. A cleaner read on the latest move. See exactly how aggressive the most recent shift in positioning has been.
A positioning index + weekly thoughts. After every COT release, I update the dashboard and post my own take on what's crowded, what's neutral, and which assets currently have an edge. Updated over the weekend, ready for you on Monday.
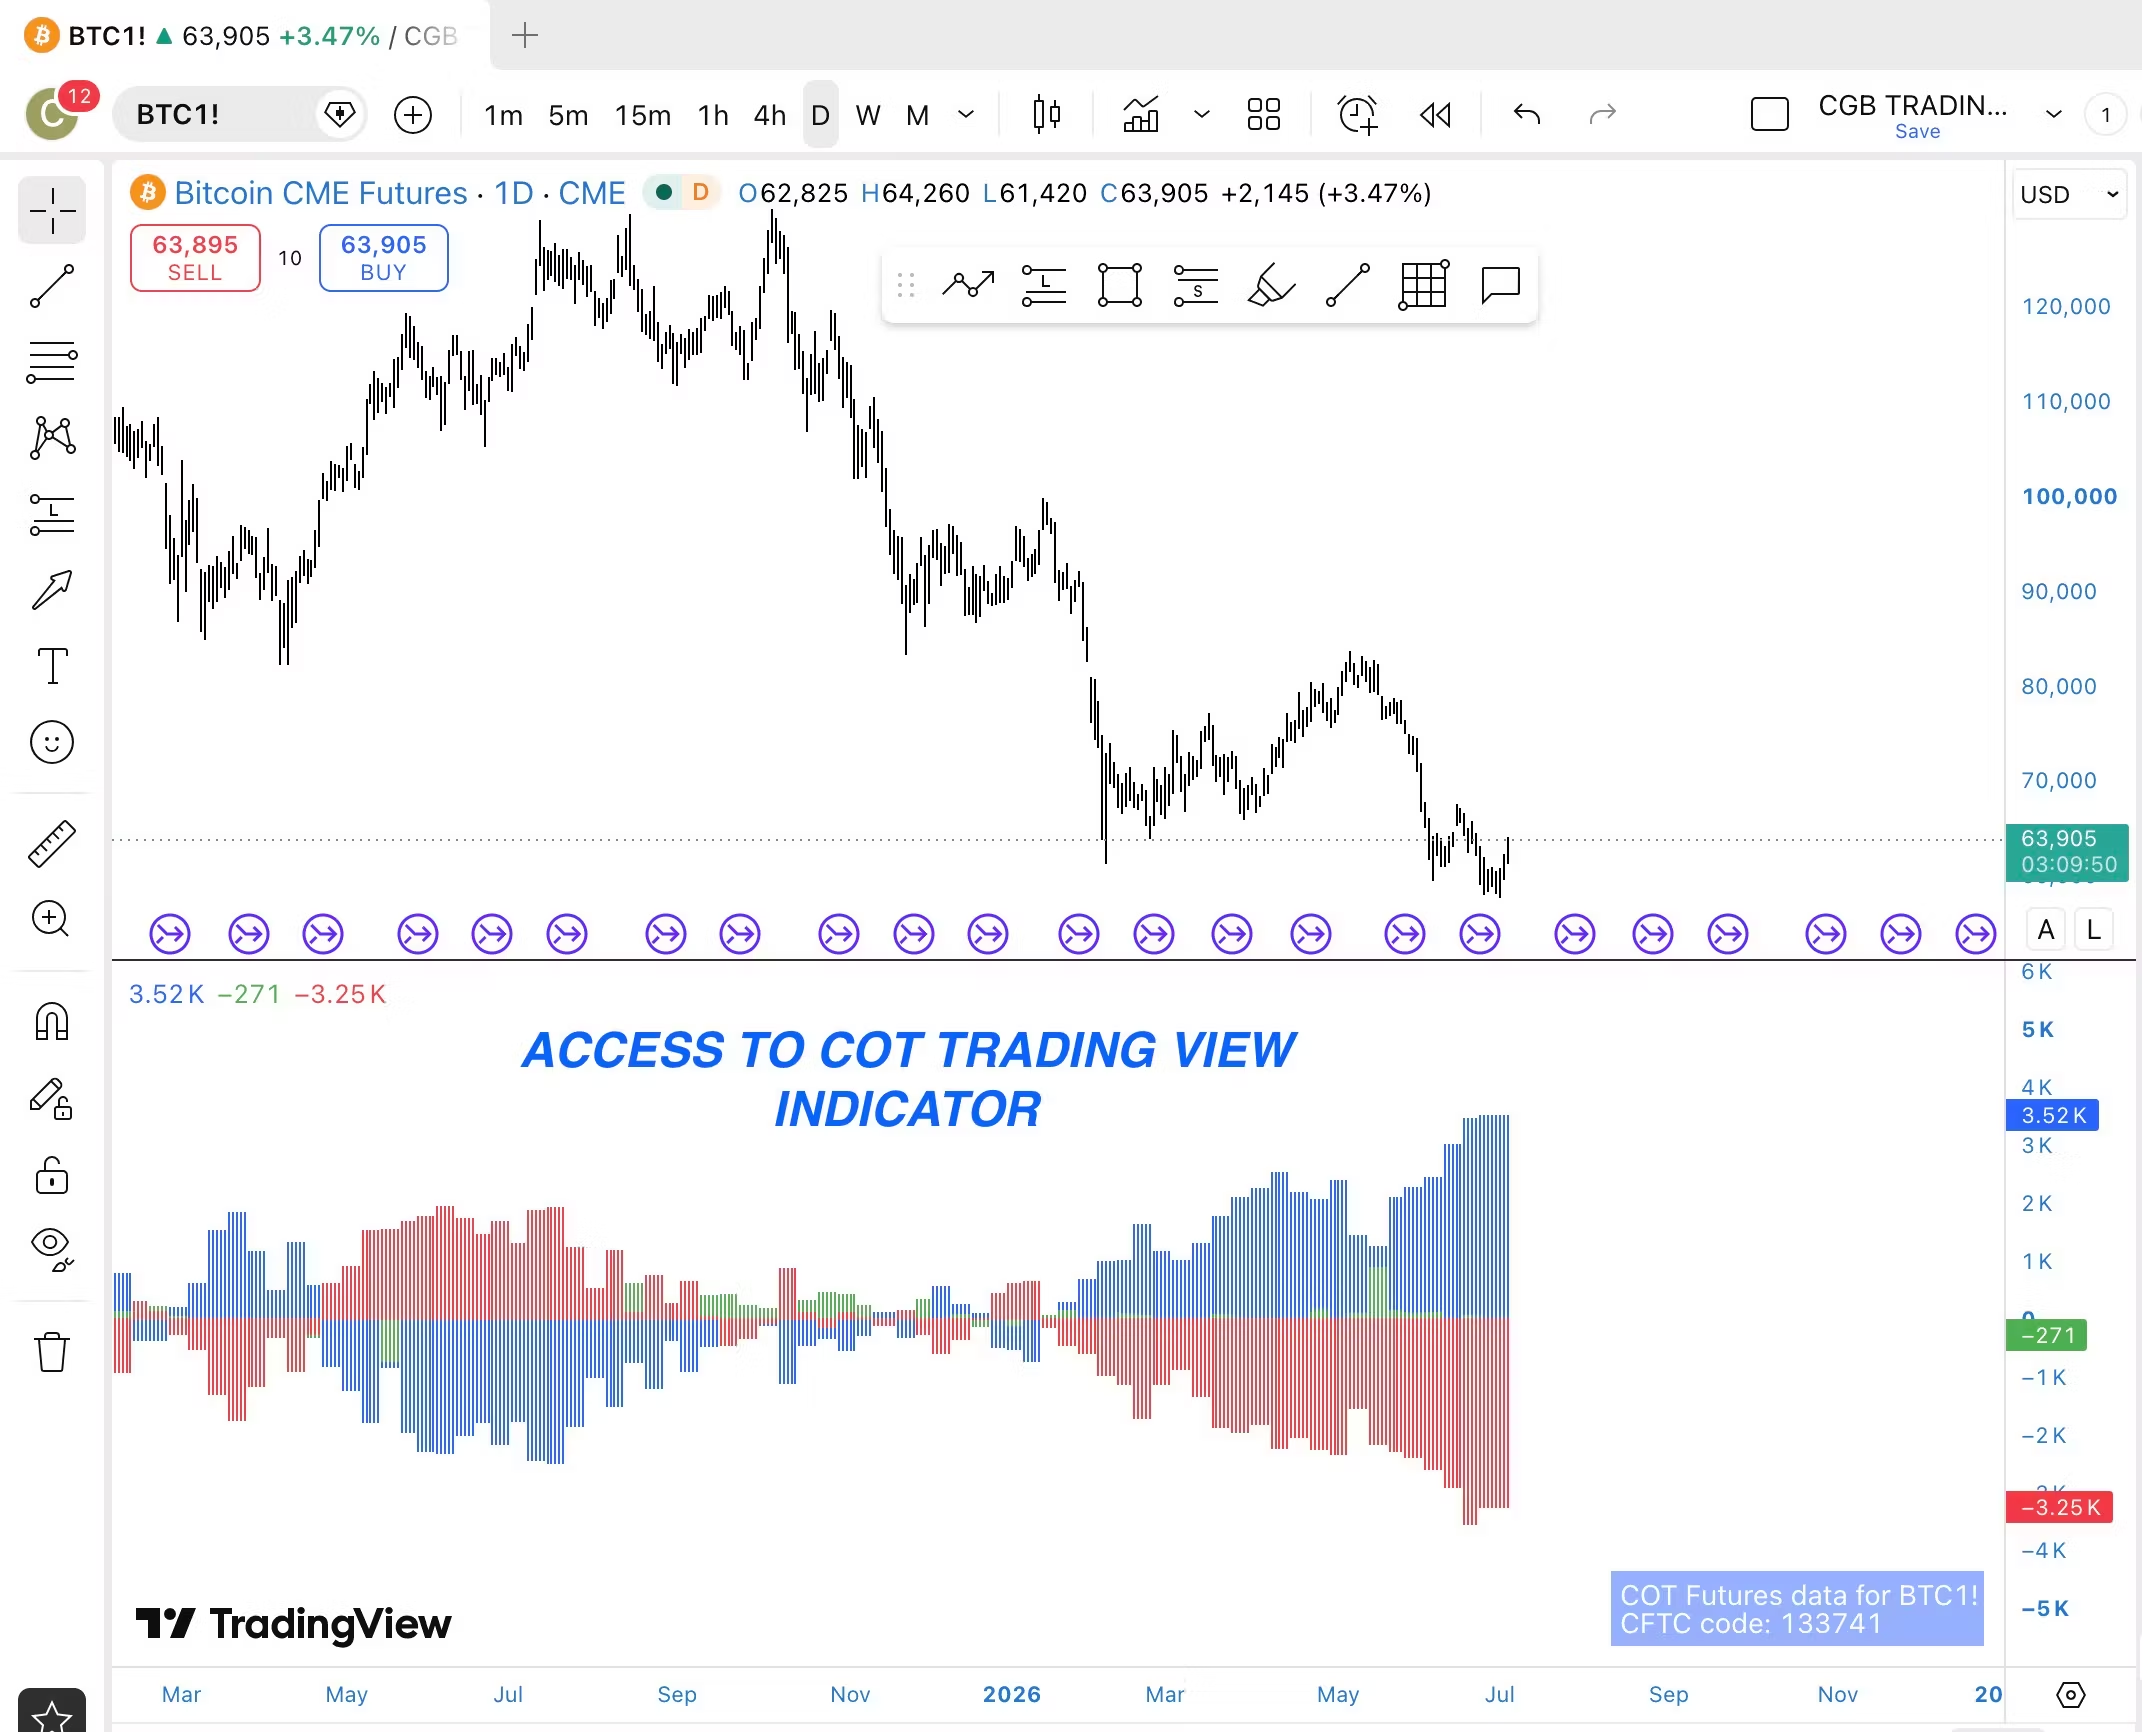
A TradingView COT indicator. Bring positioning data directly onto your TradingView charts. Just open the dashboard and see where the crowd is leaning.