
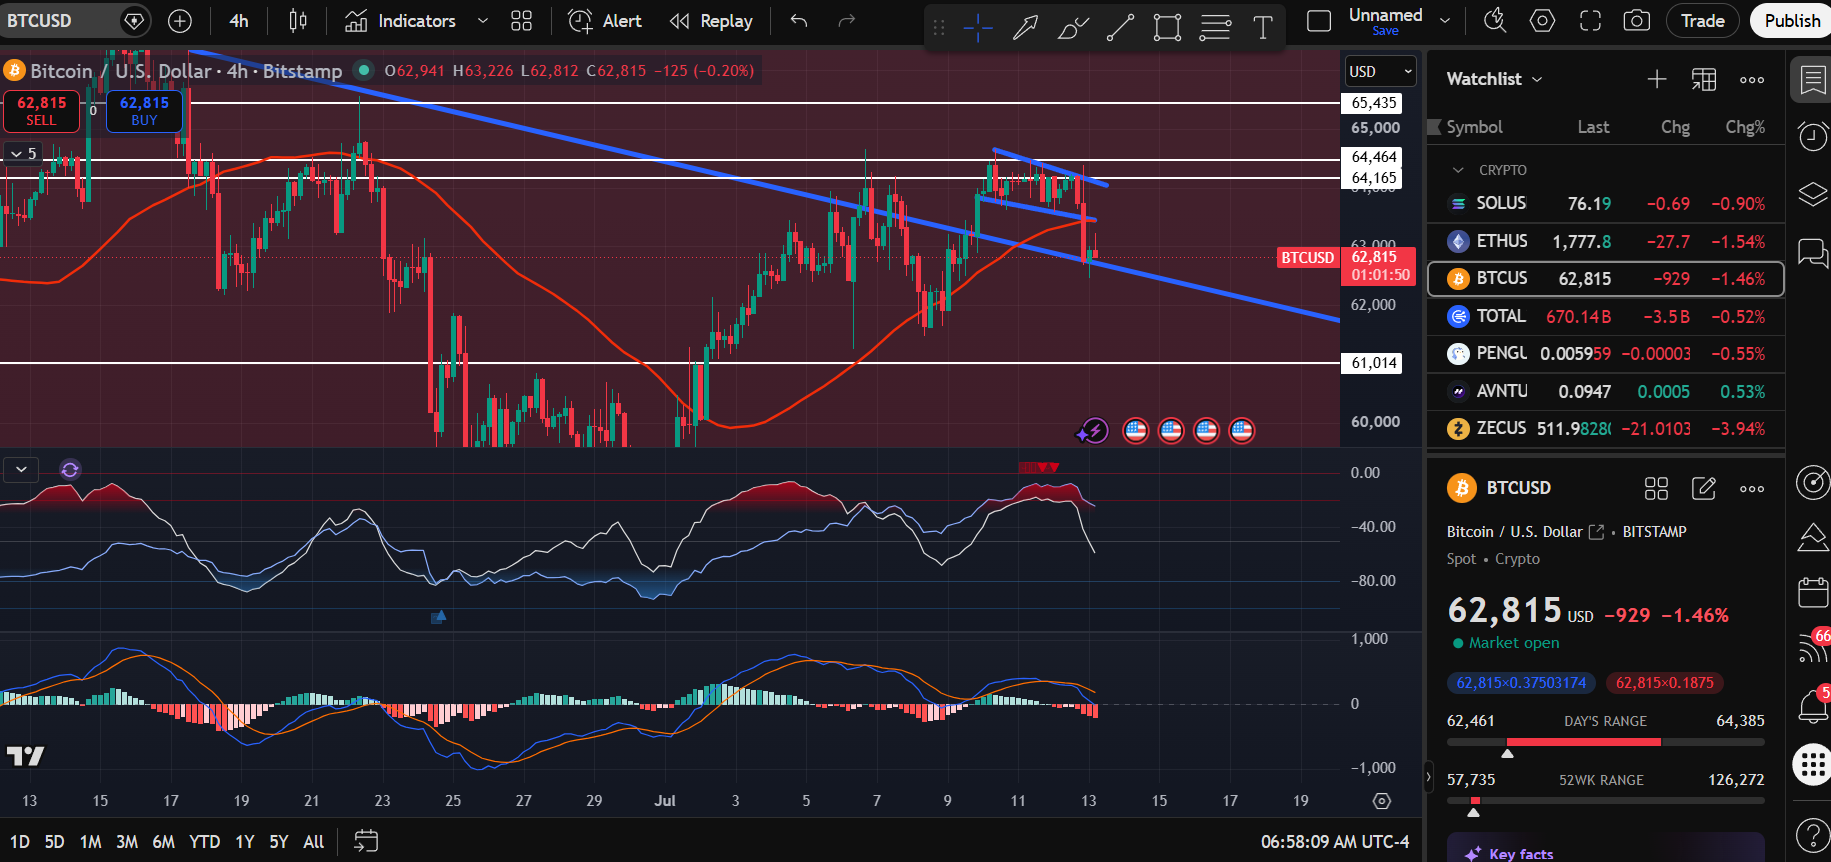
We broke the 50 day ma on the 4h and are now retesting the support at the top of the falling wedge. If we break below there, we could push down to 61k support. We have to get back above the 50day ma on the 4h to recover

 @marsellis·Jul 13
We broke the 50 day ma on the 4h and are now retesting the support at the top of the falling wedge. If we break below there, we could push down to 61k support. We have to get back above the 50day ma on the 4h to recover
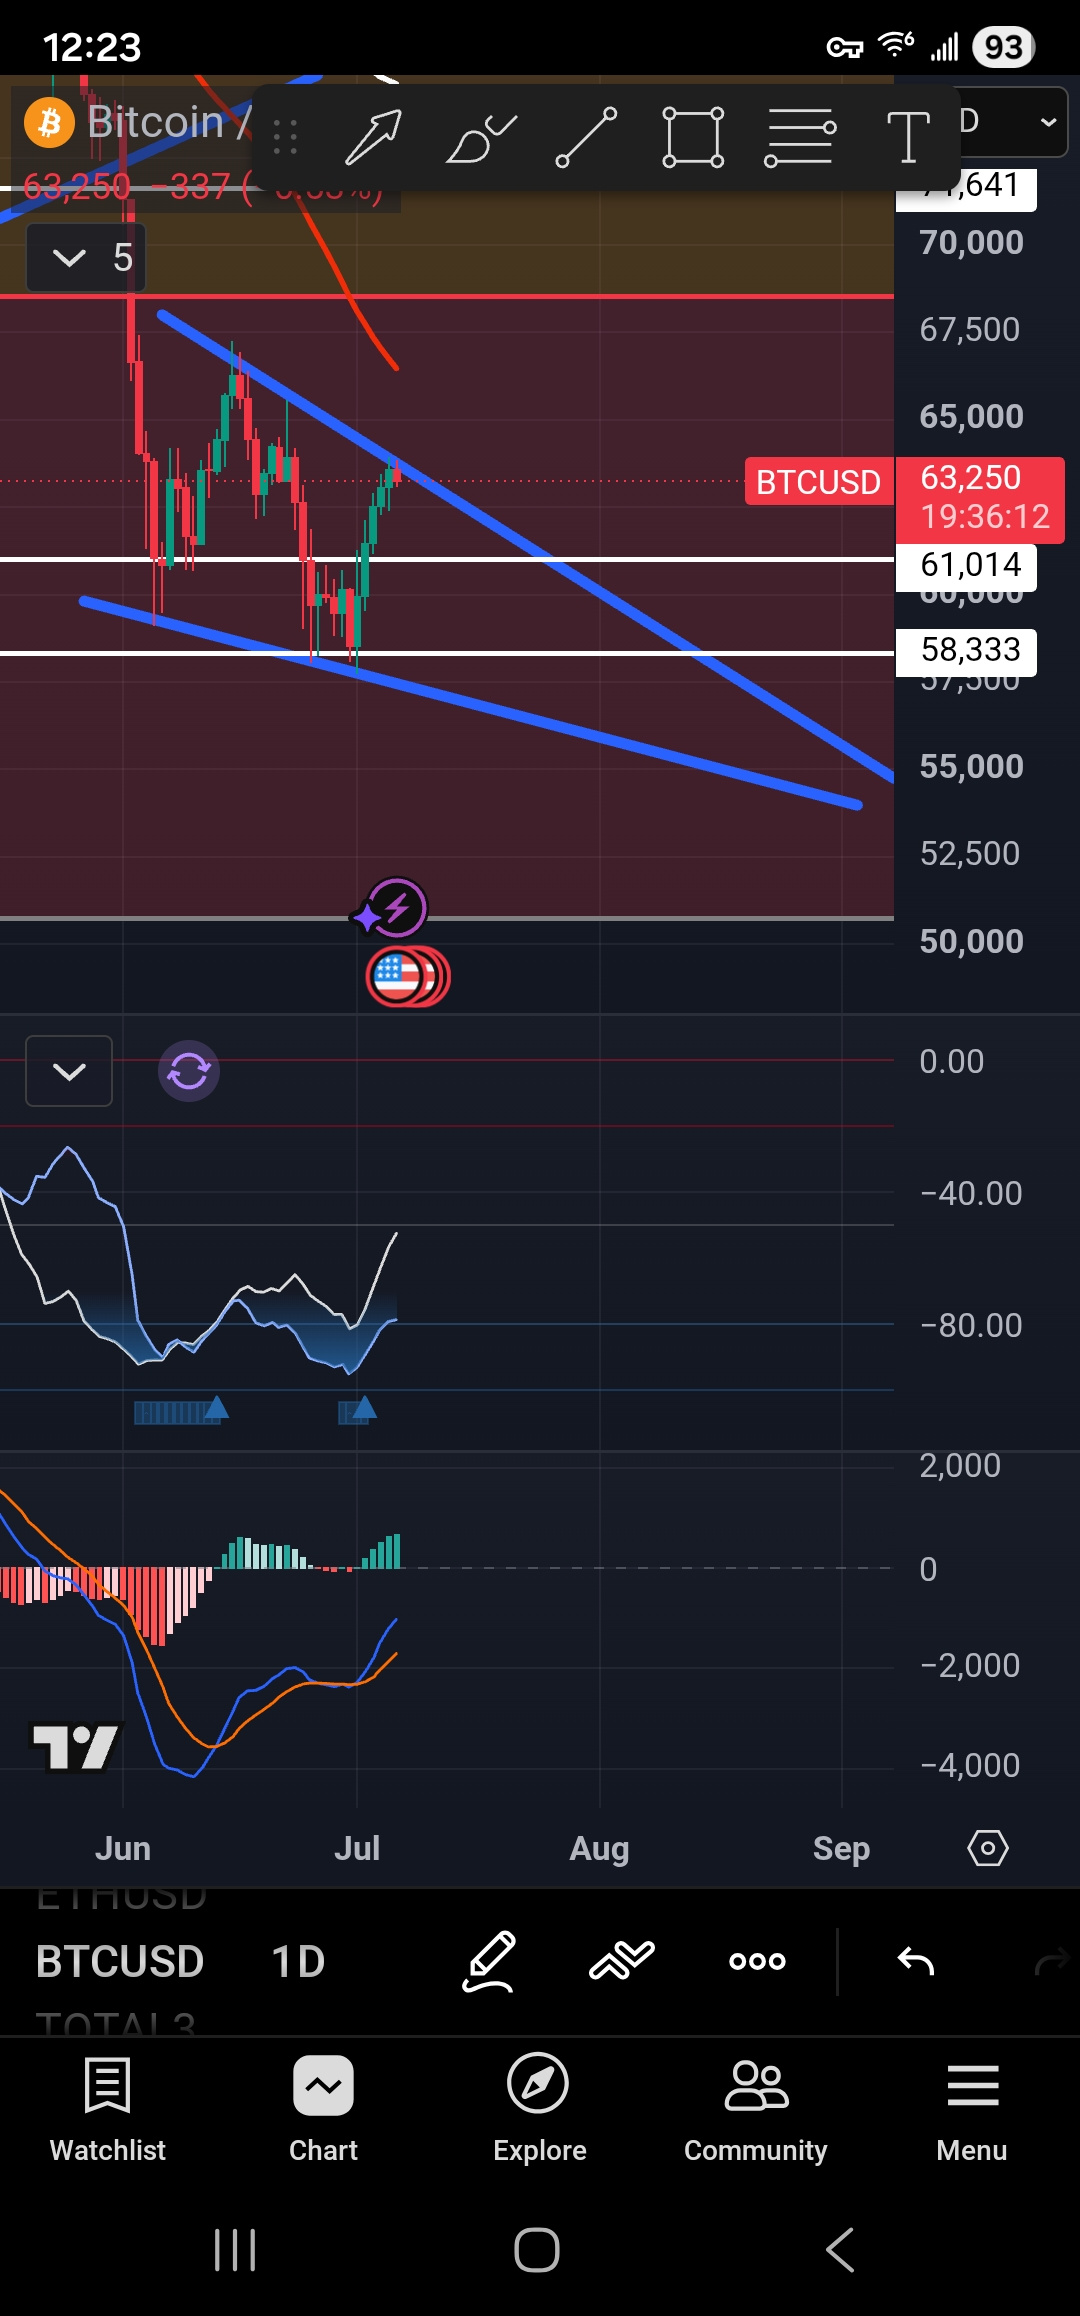
@marsellis·Jul 6There's never a definite in trading, any good trader will tell you that. Your job is to react to the market and make money that way, not predict it. Im merely reacting to the falling wedge, which is a bullish pattern. Since it entered from a down trend, I assume bull trap till im corrected.
 @marsellis·Jul 1
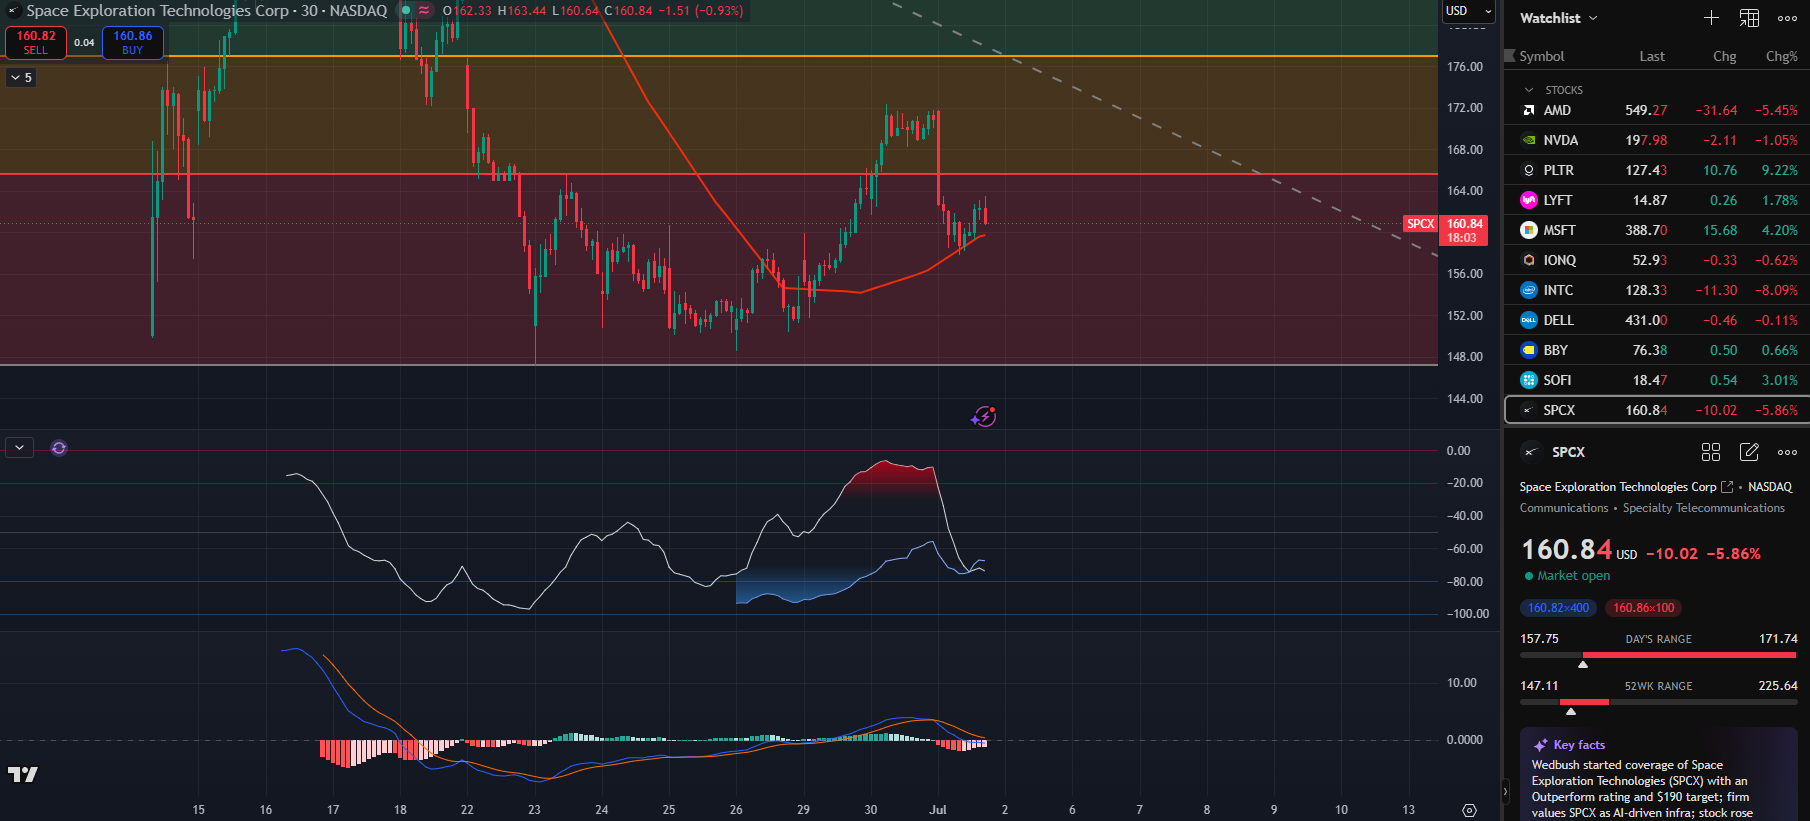
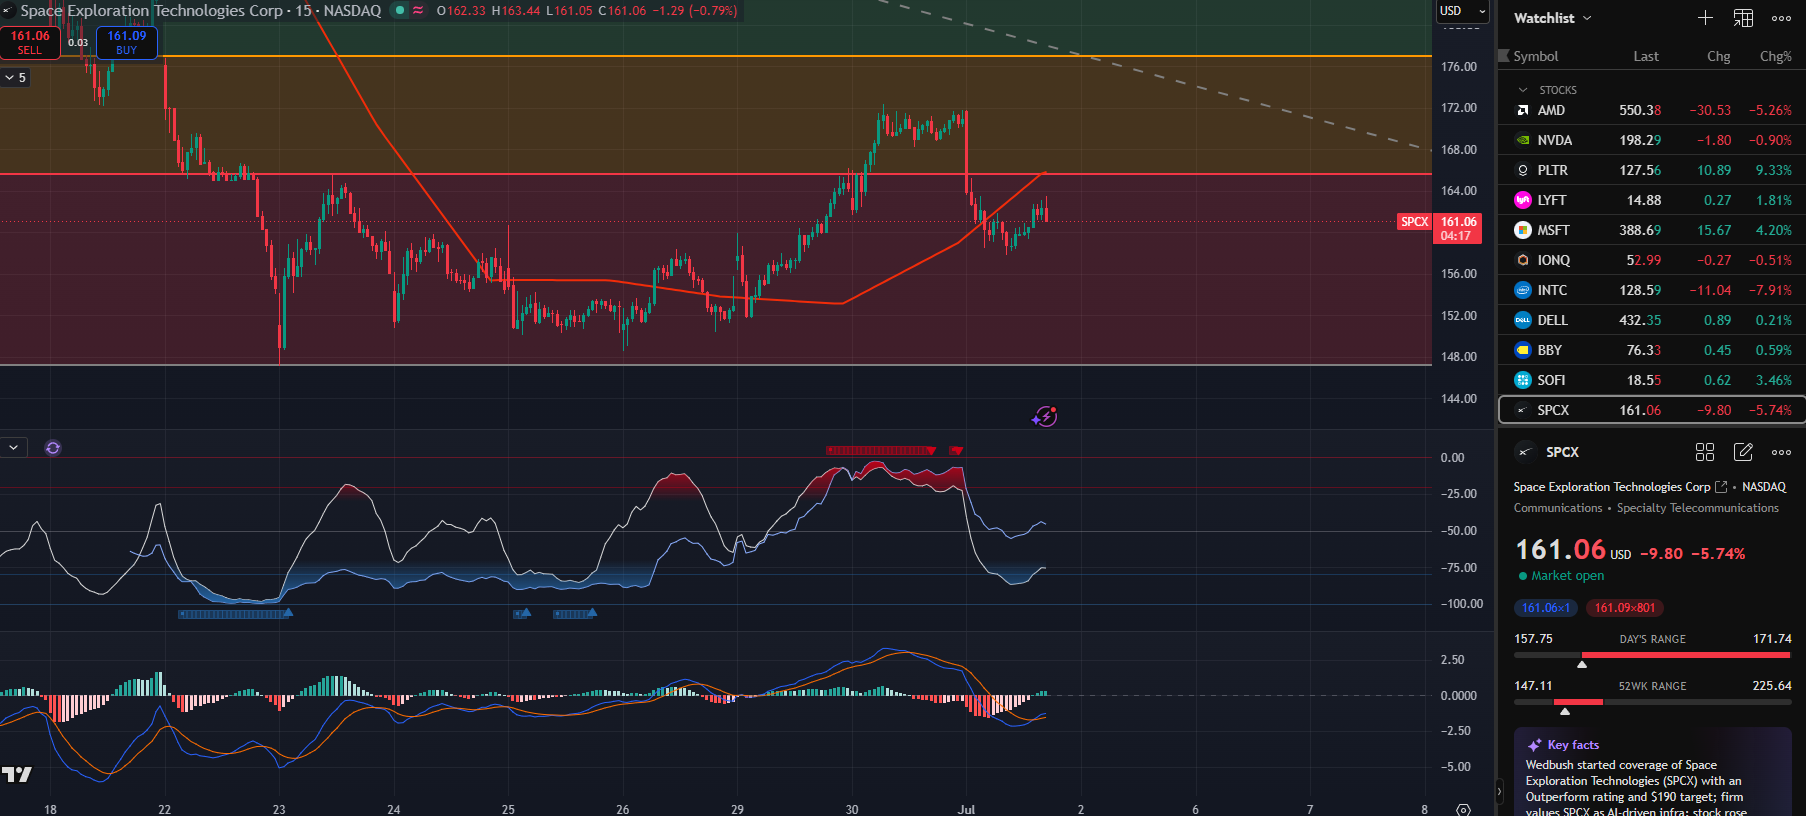
SPCX is creating bullish divergence on the macd on the 15m, it could possibly create a lower low again, but watch out for the 30m chart. On the 30m, it is bouncing off the 50day ma. If it doesn't drop below the 50 day ma on the 30m, then bulls could take it to the $177 fib for the next pump.
 @marsellis·Jun 28
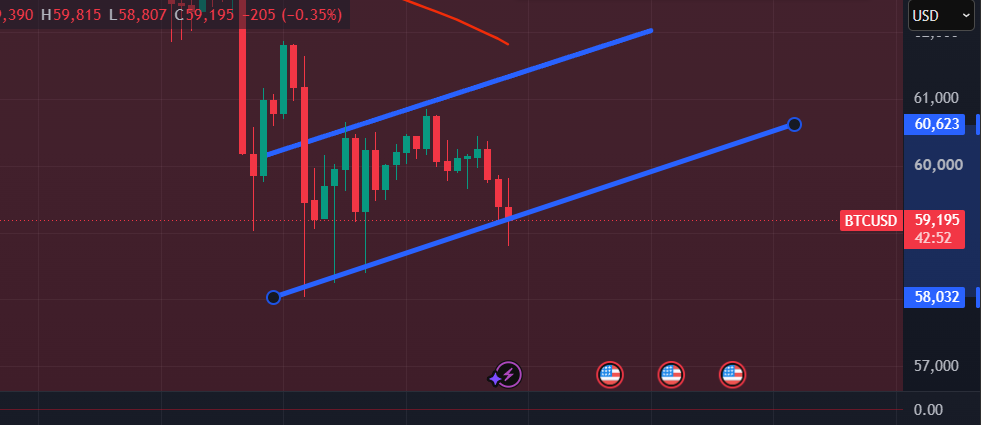
We're forming a new bear flag. On the 2h chart, it looks like bulls are trying to push above to 50 day ma. The %R Trend Exaustion and the macd look like they want to reverse to the upside. Im holding off on shorts until we can close either the 2h or 4h chart below the bear flag
 @marsellis·Jun 28
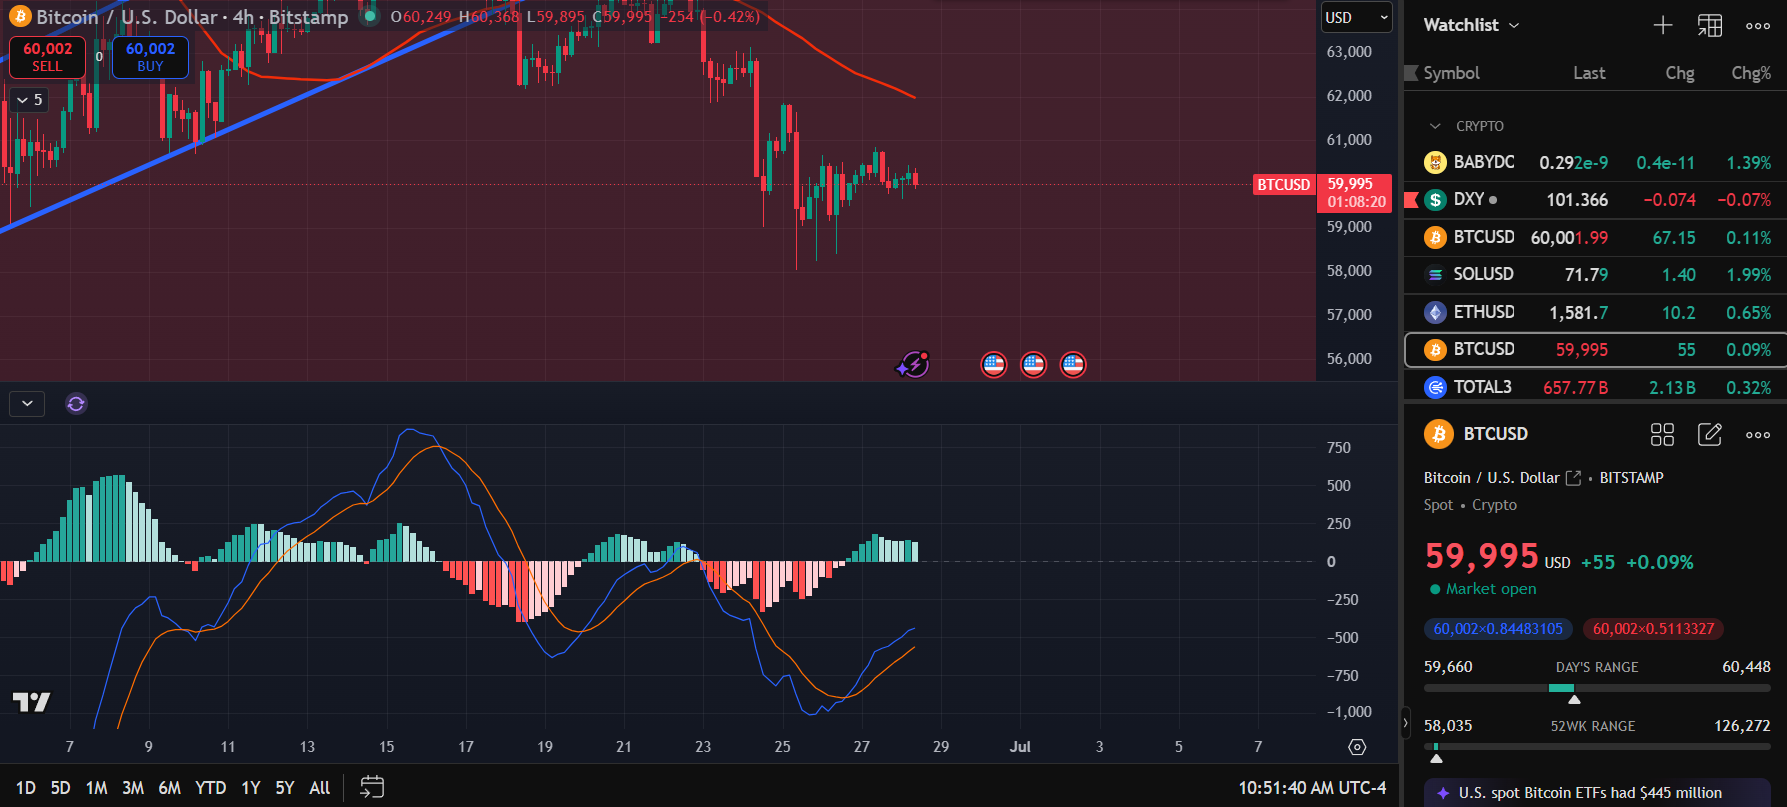
Buying Pressure For Bitcoin is getting alot weaker on the macd on the 4h chart. Shorts are almost in play.
 @marsellis·Jun 27
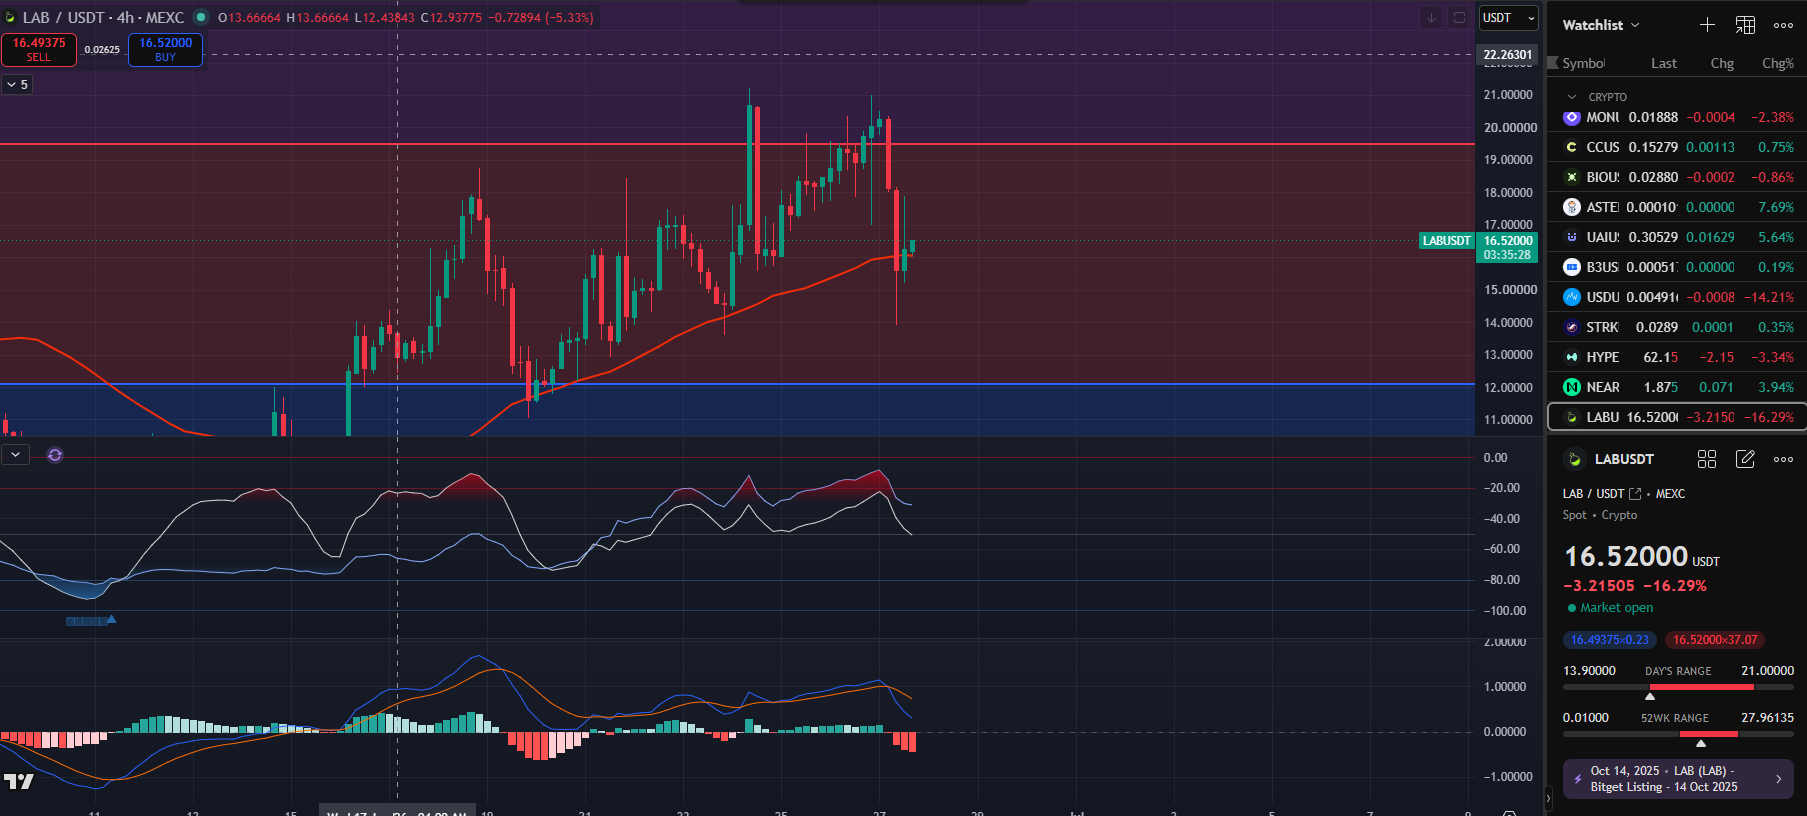
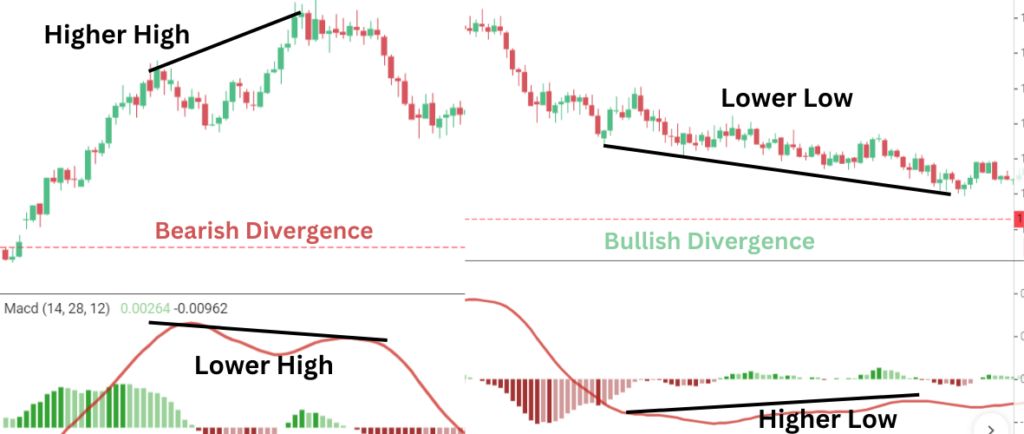
If lab breaks below the 50day MA and closes the 4h below it, then shorts are the way. But be cautious because the %R Trend exhaustion is showing sign that it could reverse back up. We also still have bearish divergence on the macd, the real question is whether or not there is 1 more higher high on the charts and lower high on the macd to be created before the bears take over.