
Gator Deep Vision
Gator Deep Vision
A 300-lot print hits the tape. Is that one institution or thirty retail orders that happened to land in the same second? On an ordinary chart there is no way to tell, because large orders reach the exchange in pieces, and the chart shows you the pieces.
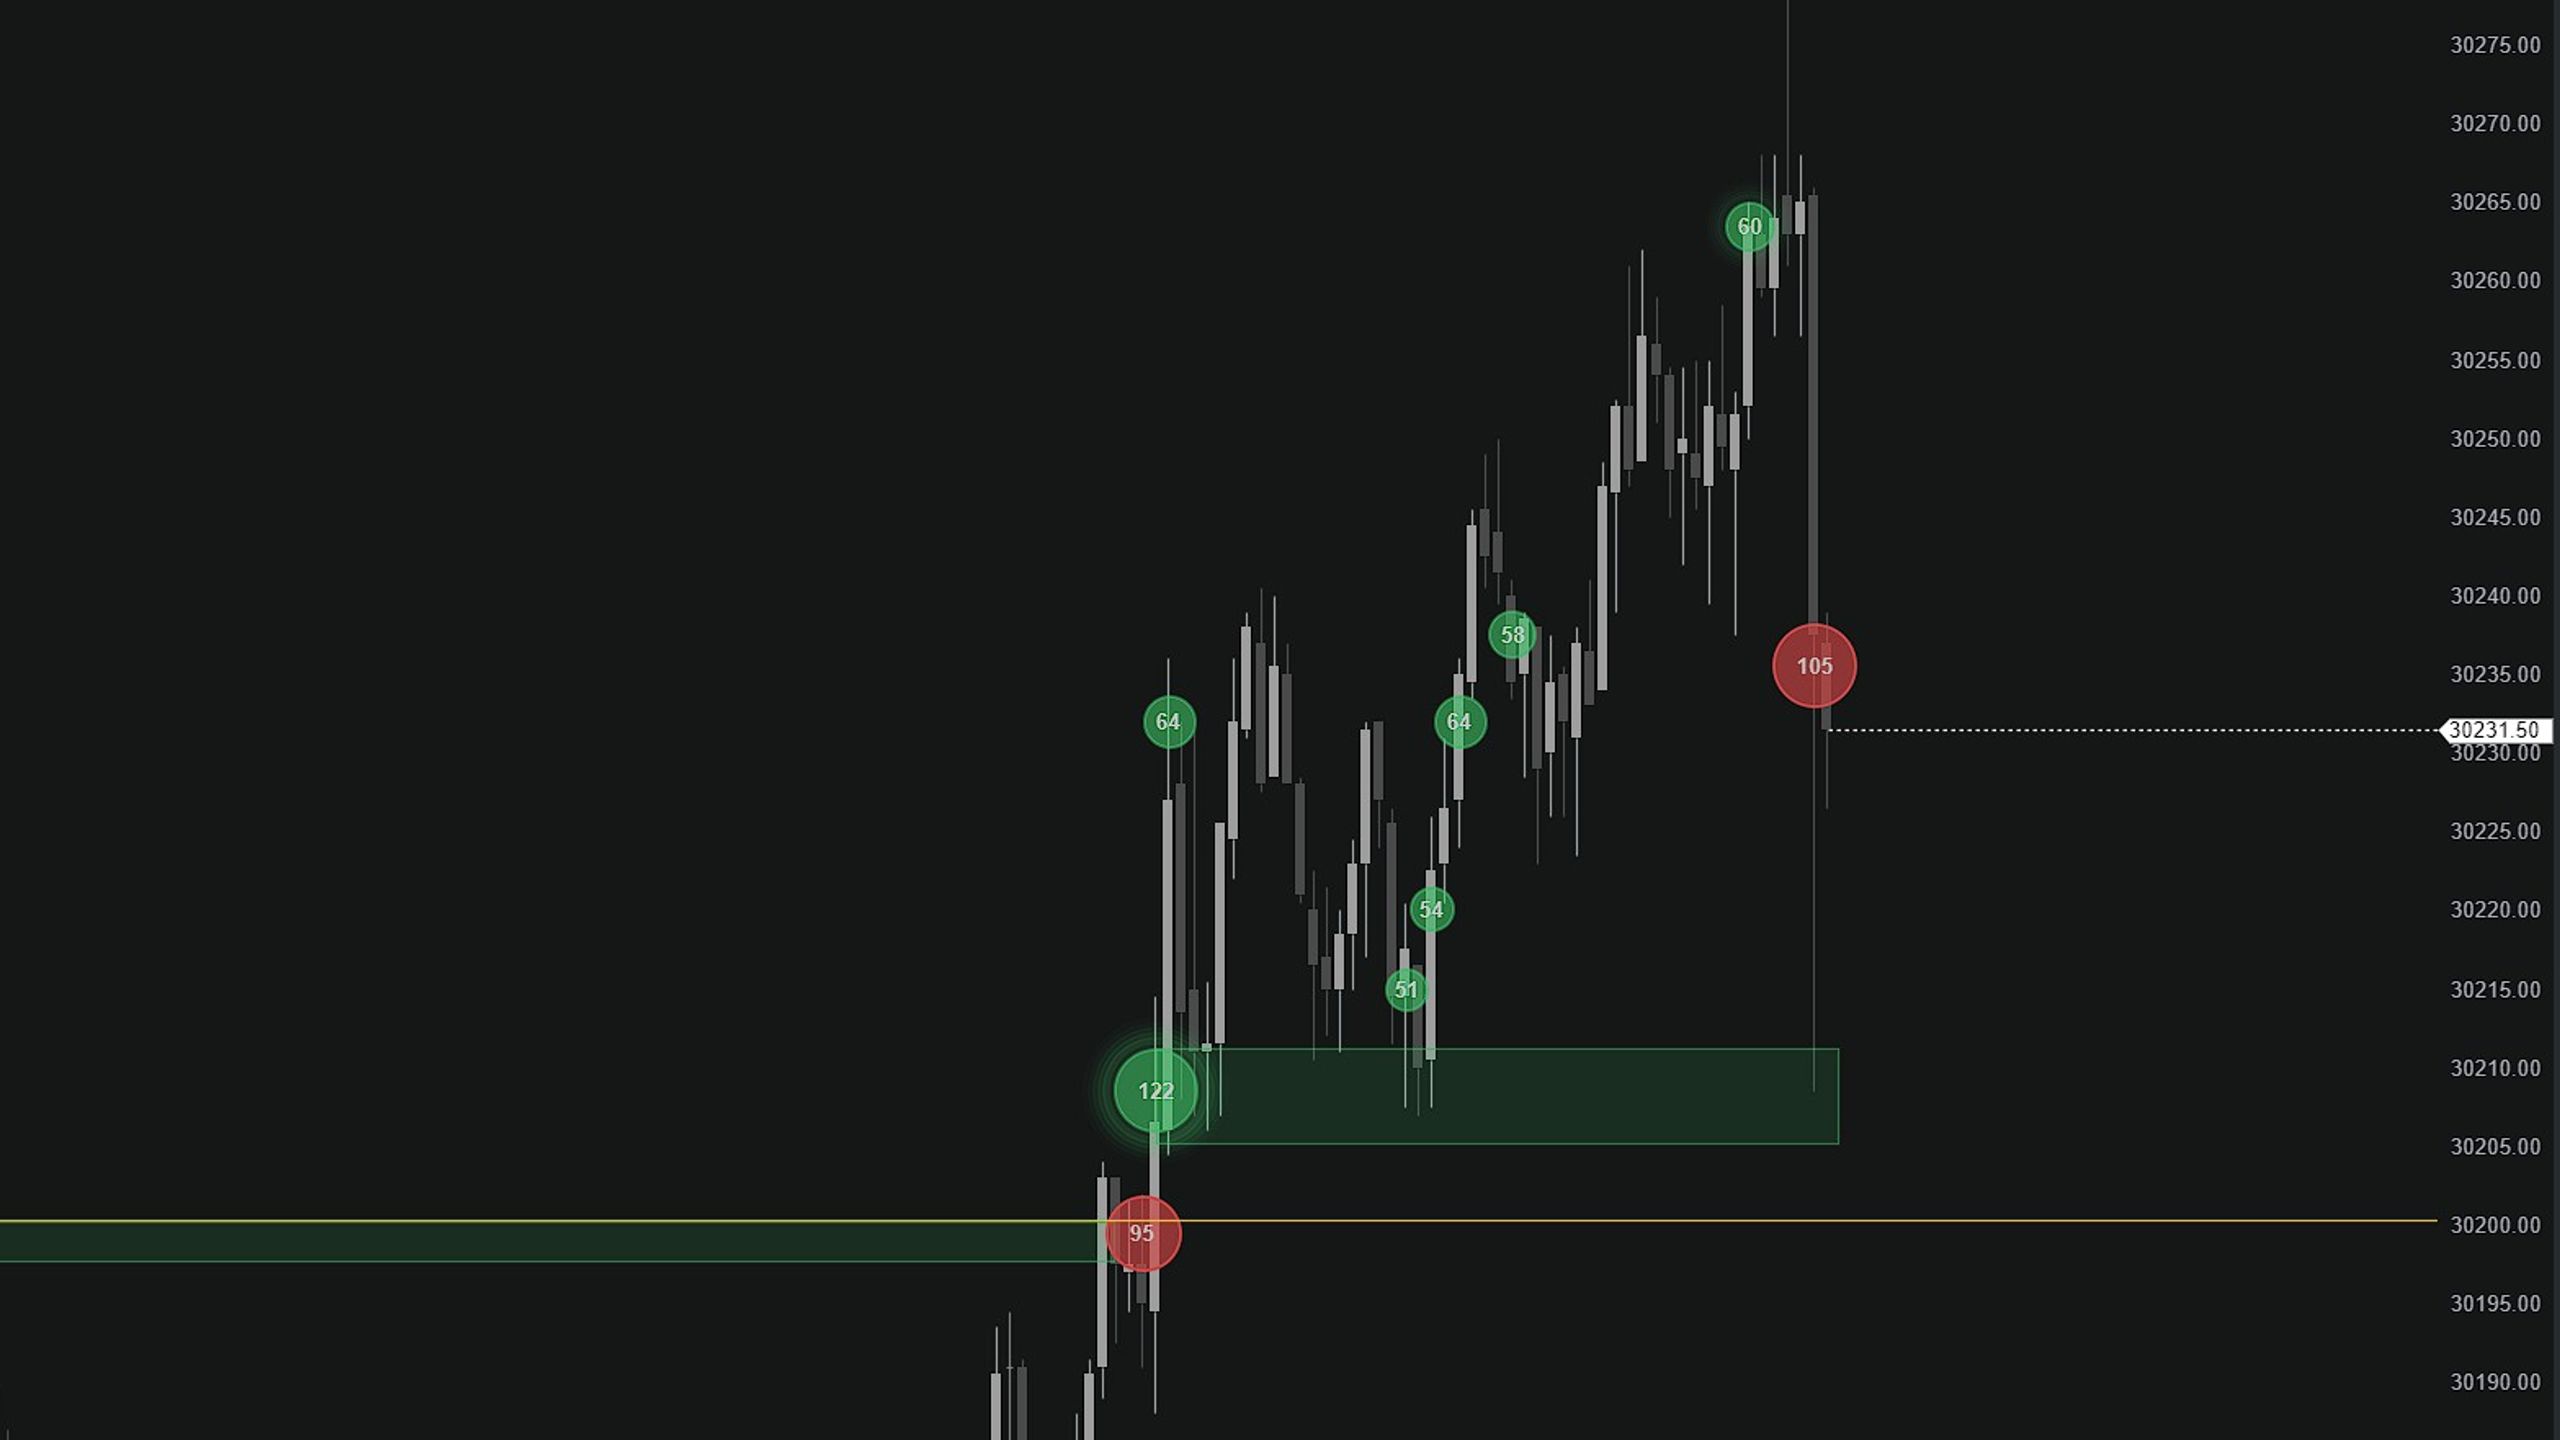
Gator Deep Vision collects those pieces back into the single print that actually hit the market: volume for scale, color for the side of aggression. The size you see is the size that was traded - not a fragment of it.
Just as important is what stays off the chart. What counts as “big” is decided by a filter that adapts to the market in real time, with separate profiles for the Asian, European and US sessions an 80-lot print at 3 AM and at the New York open are judged on their own terms. The chart stays quiet until size that matters actually shows up.
Every print that survives the filter is read in context: size against the session, location relative to VWAP and the value area, how one-sided the aggression was — and the strongest ones stand out at a glance. Click any print to see its anatomy: how fast it traded versus the session, volume on both sides, and what it most likely was — a sweep, absorption, exhaustion or an iceberg. The most significant prints extend into levels that hold through re-tests until a candle finally closes through them. That’s the difference between watching big trades and reading them: you see not only where size entered, but which prints mattered — and what the market did about it.