
DeepEdge Profile
3 members
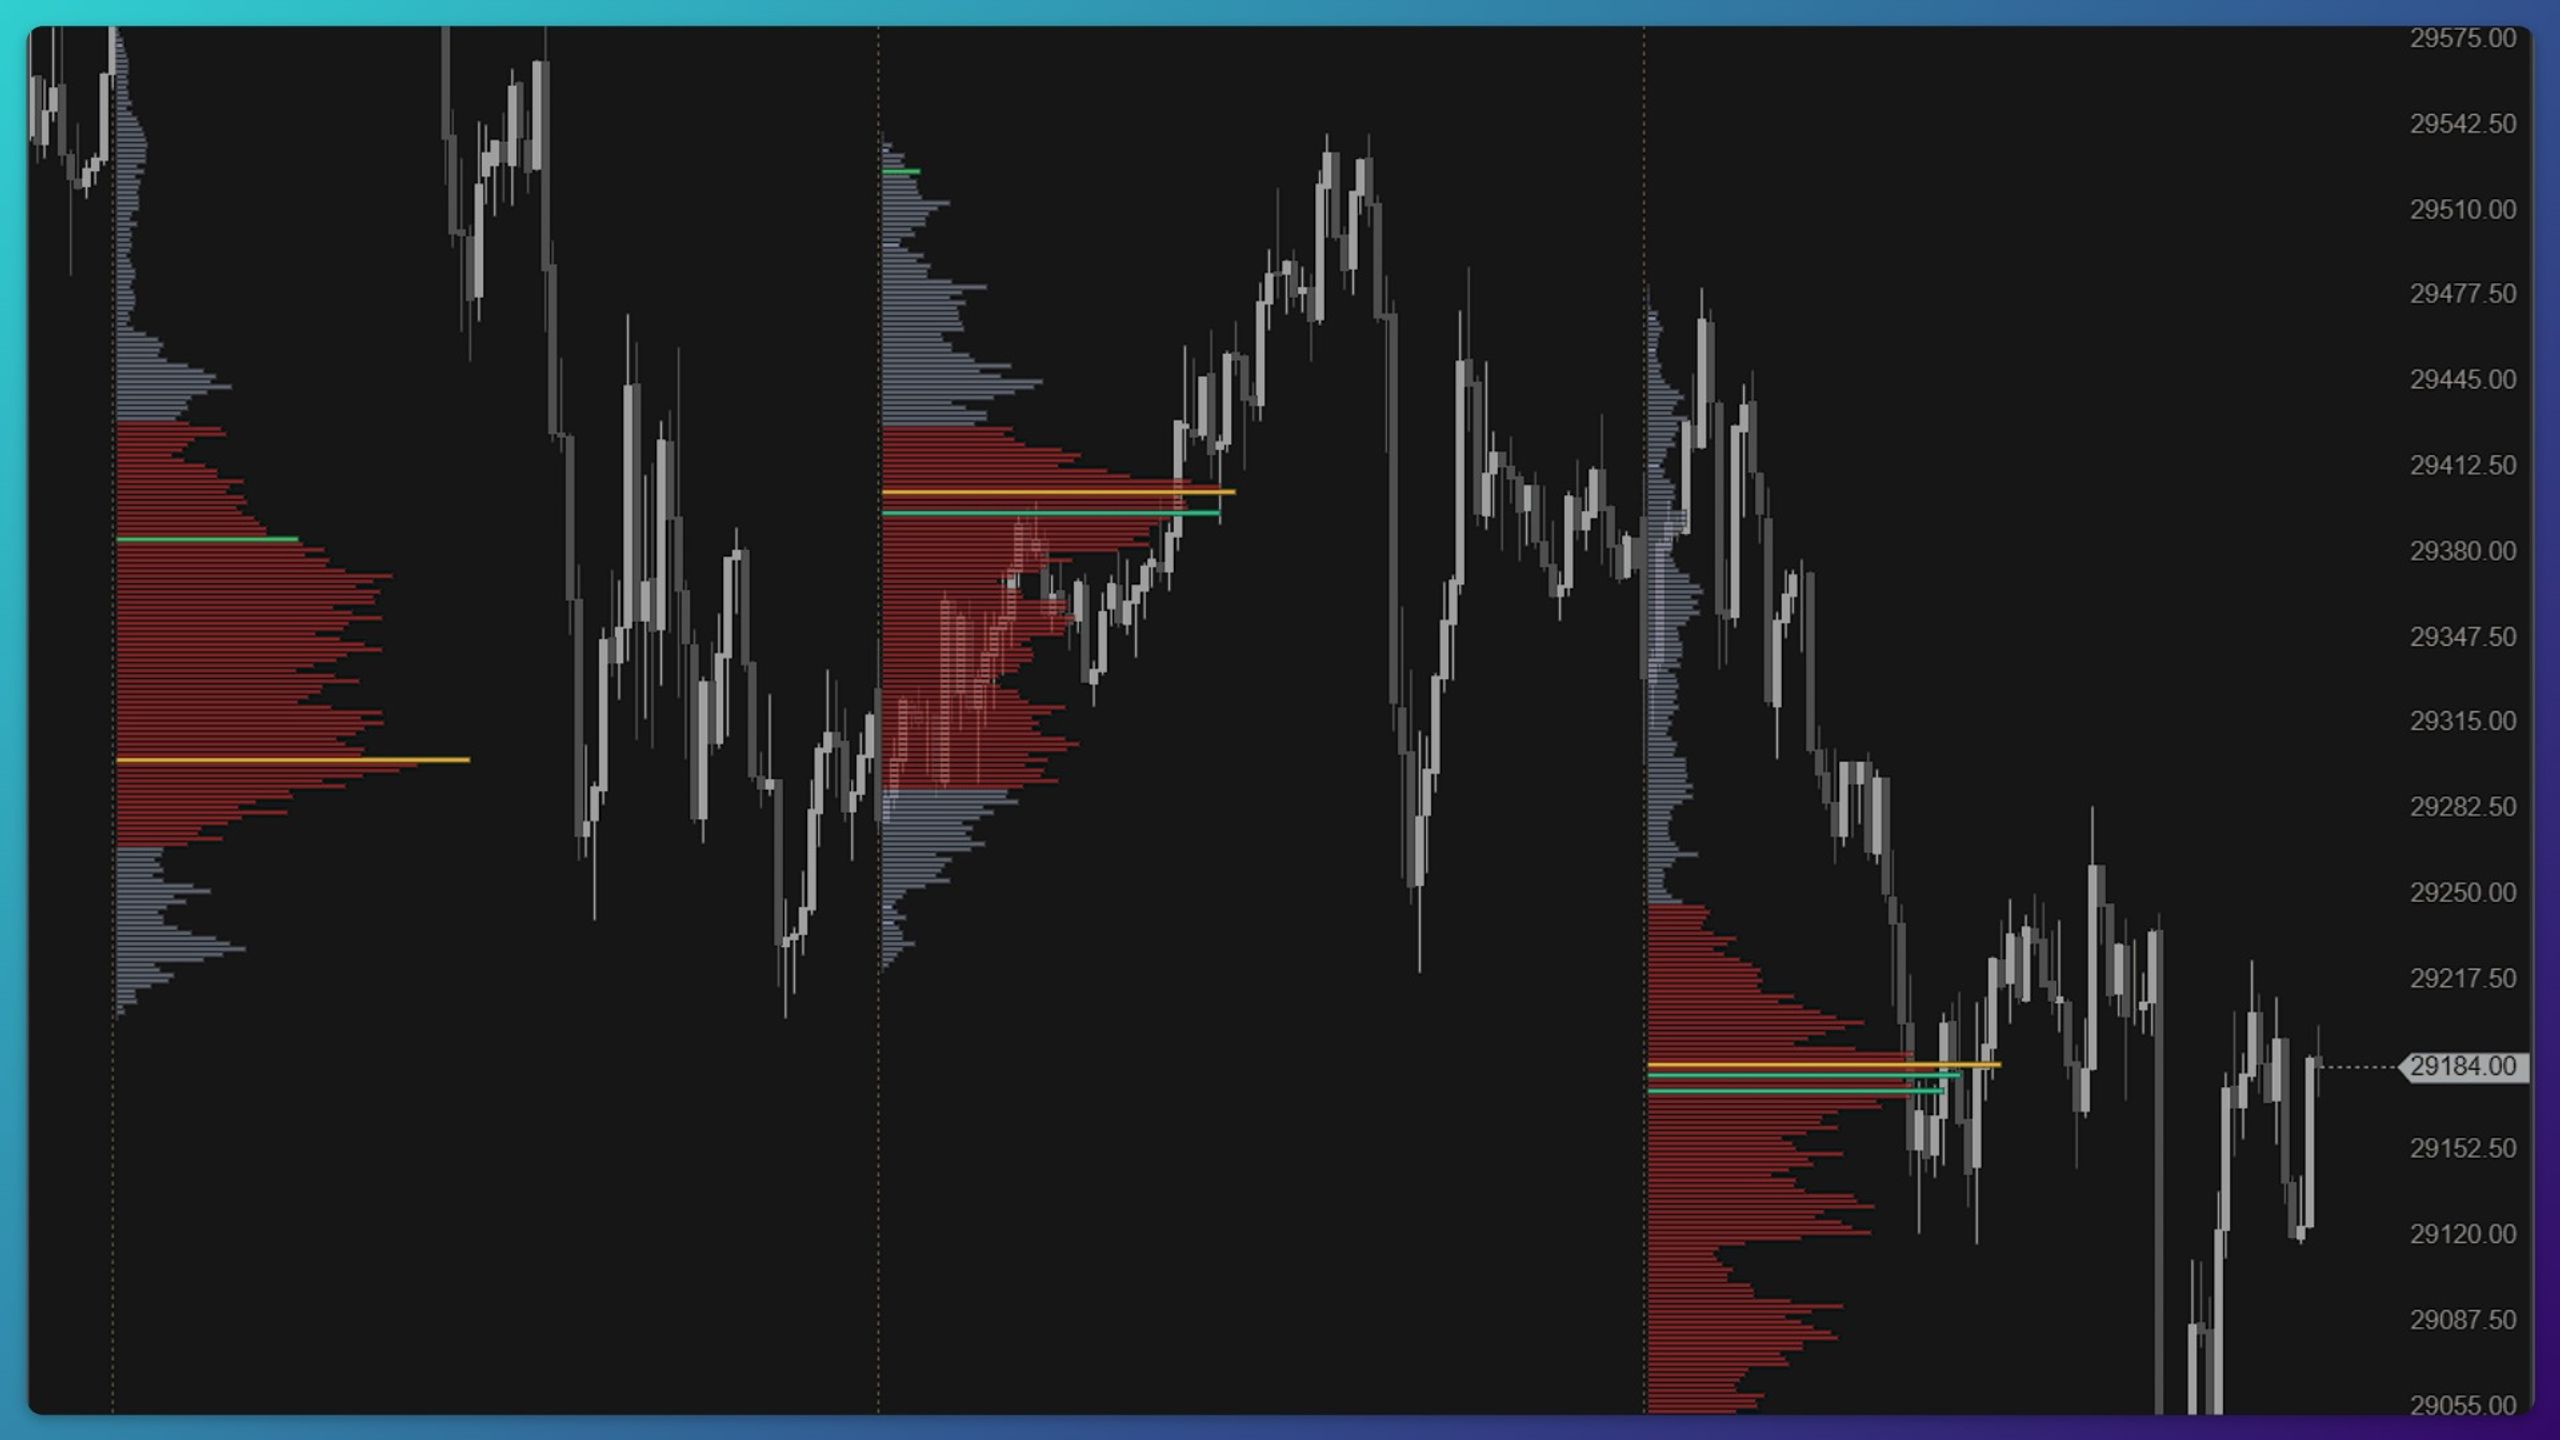
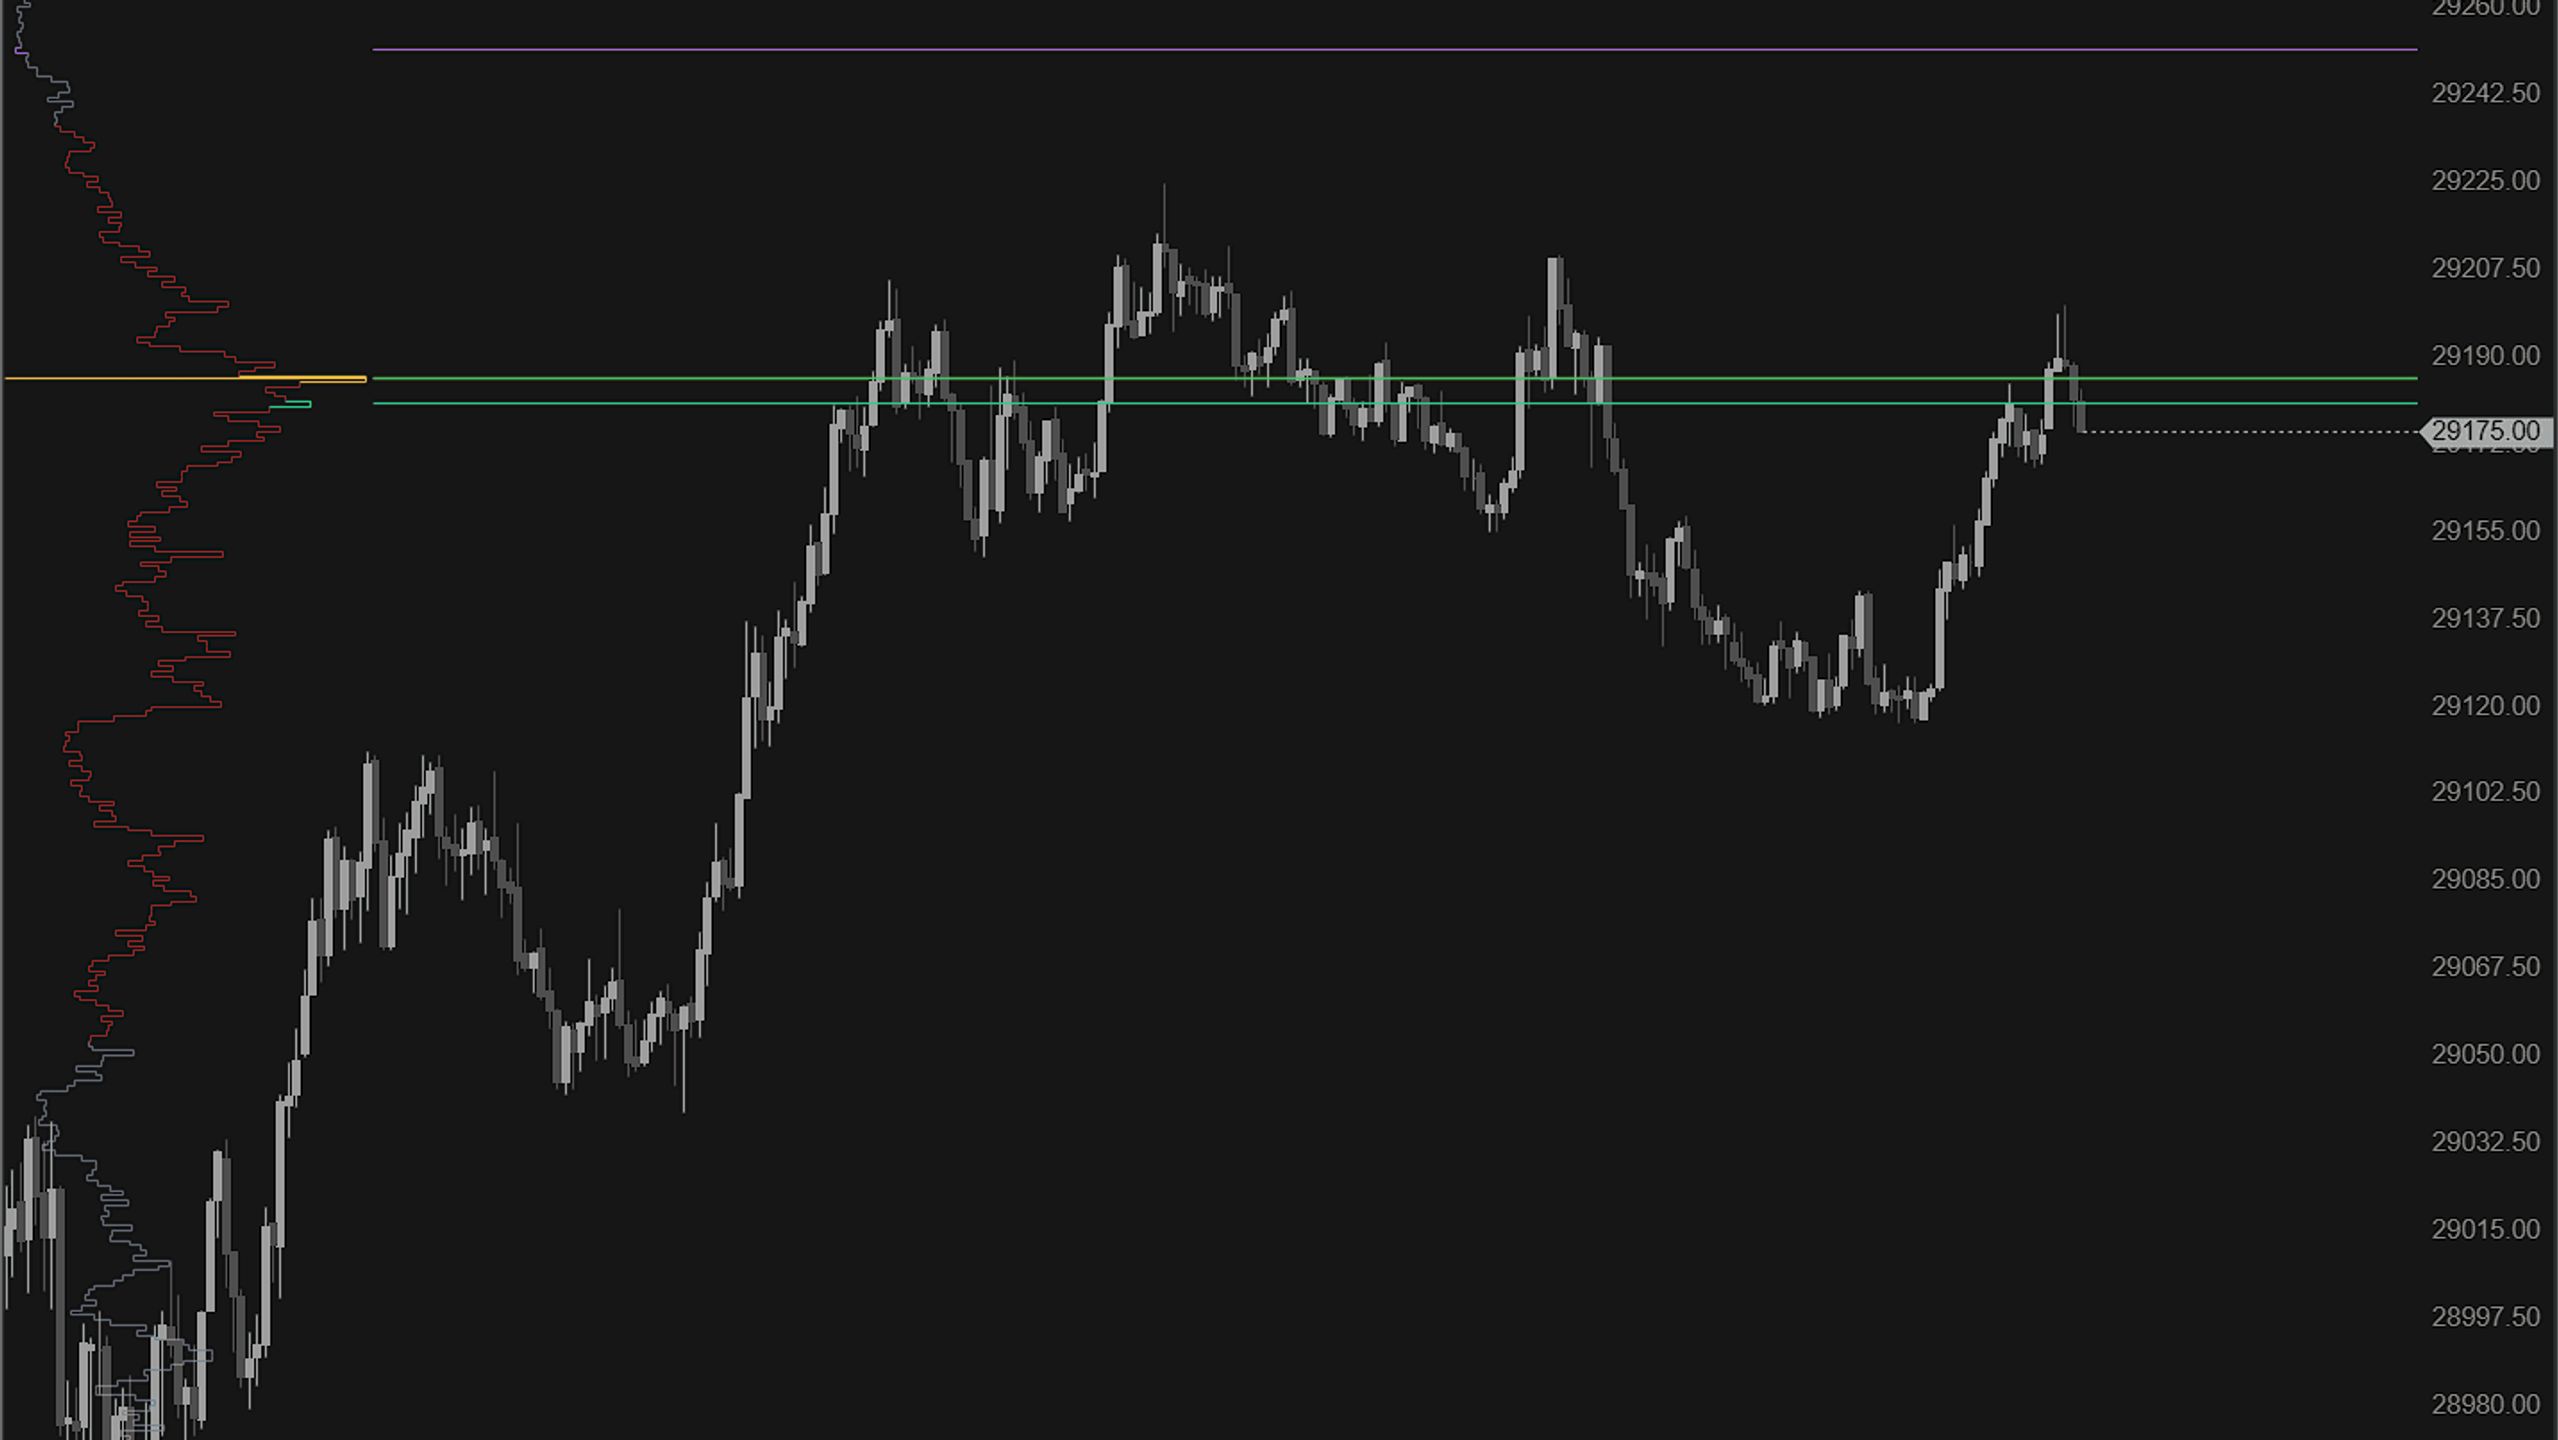
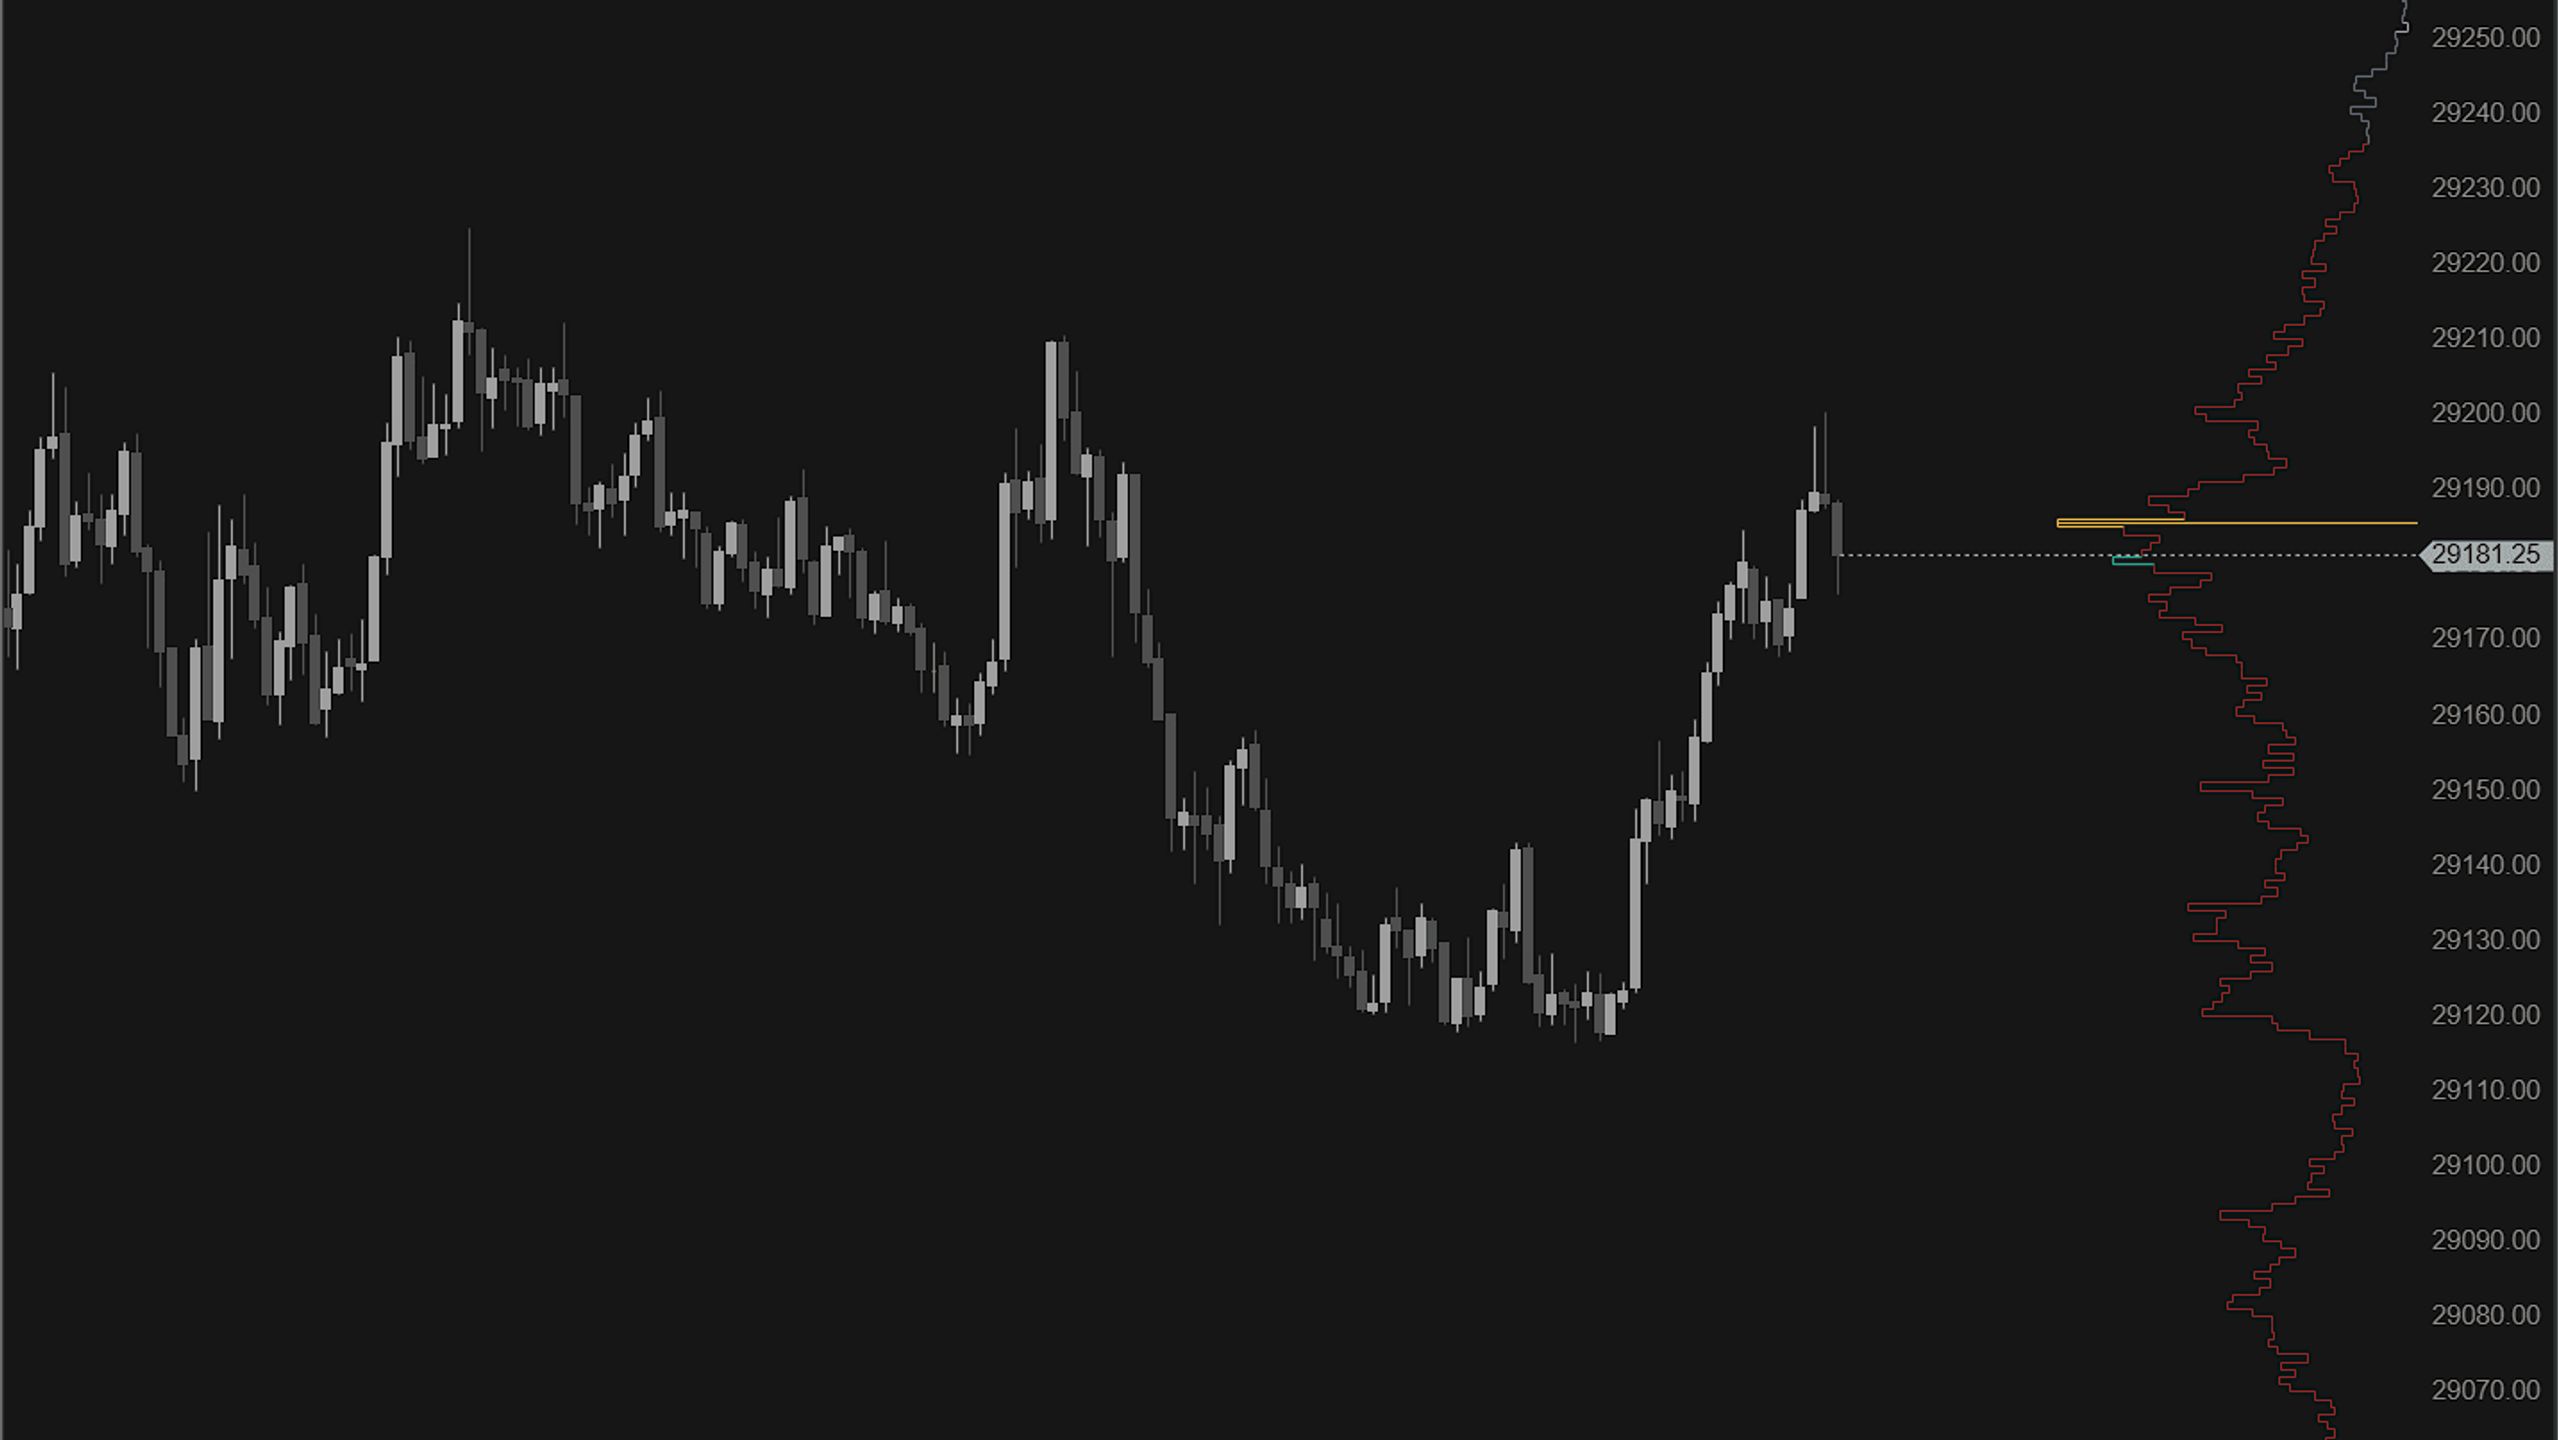
DeepEdge Profile puts a full volume analysis toolkit on your ATAS chart, drawn as outlines so the price action stays readable underneath.
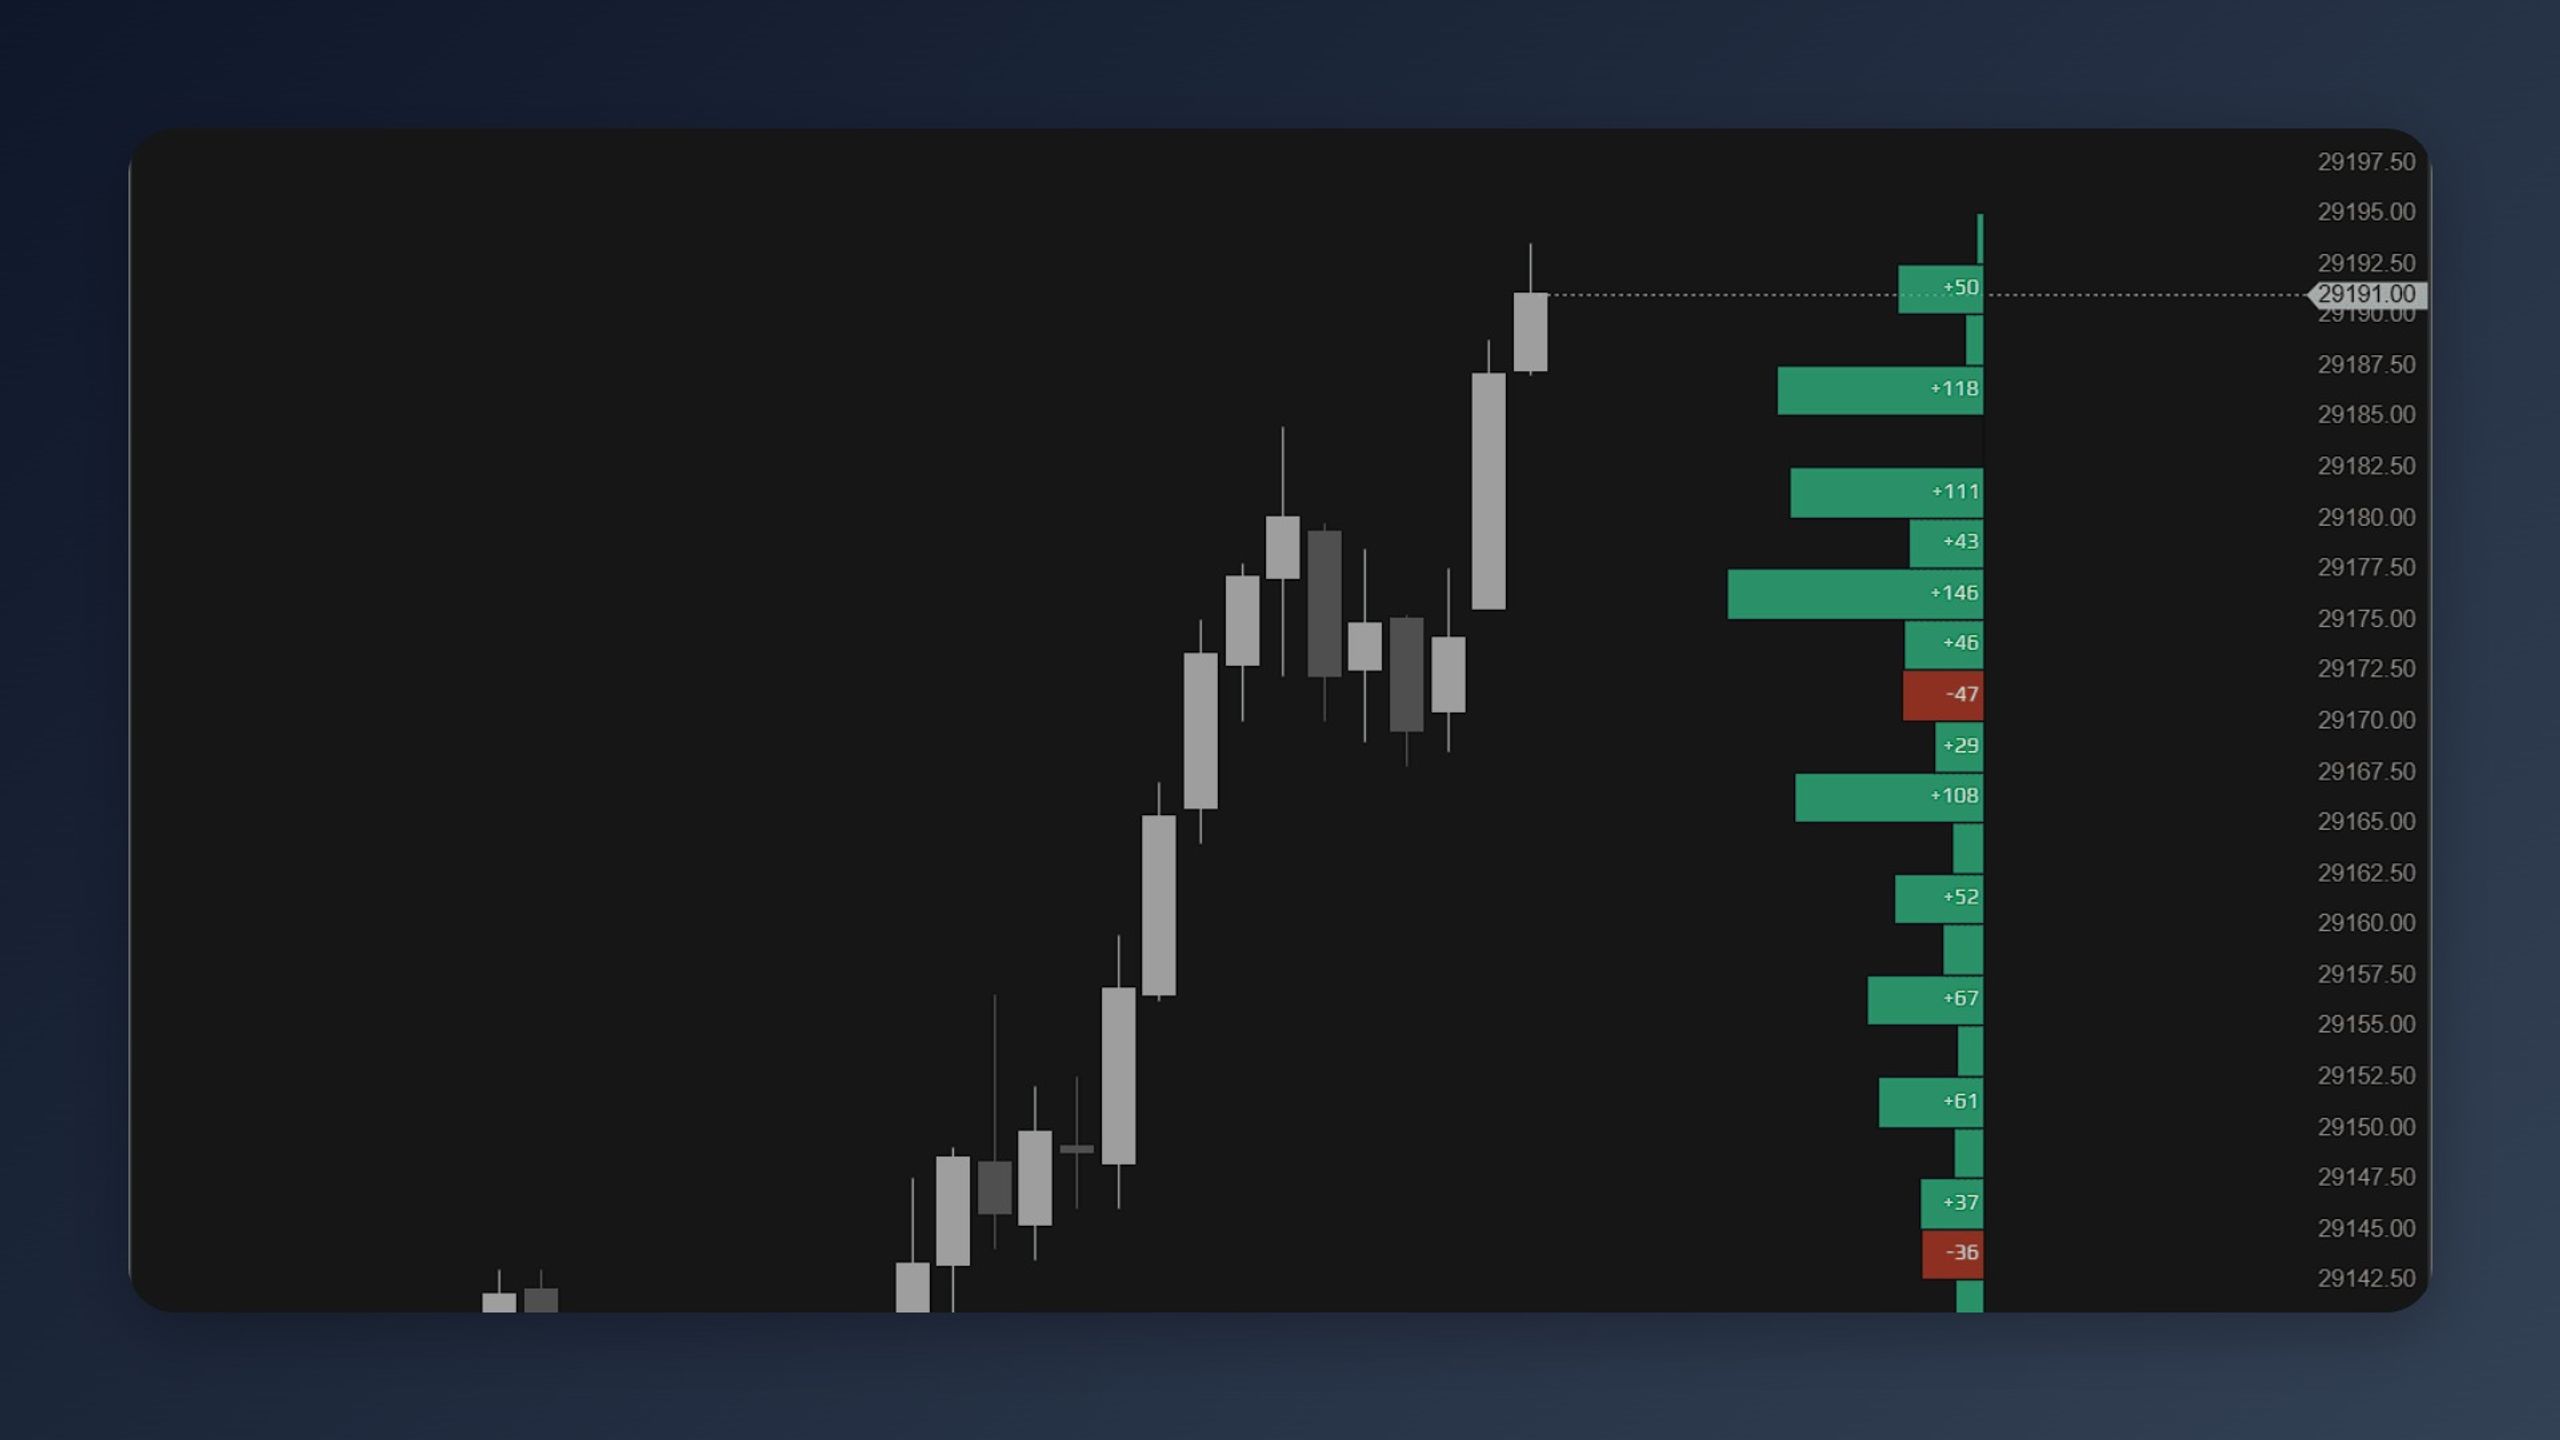
- Three sources: Volume, TPO (time) or Delta — switchable per profile
- Flexible ranges: current session, today, previous day, last 5 days, current week, or the last N bars
- One profile per range, or one per period across the whole chart, with optional merging of N periods into composite profiles
- Three drawing styles: outlined bars, filled bars, or a single-line silhouette that barely touches the chart
- Tick Multiplier compresses price rows (e.g. 4 ticks per row) to keep the profile readable on any instrument
- POC with Off / Row / Row-and-Line modes, standard value area (adjustable 50–95%), high/low volume nodes as local extrema with strength filters, and the Delta POC — the row with the strongest one-sided aggression
- Color rows by delta to see who won each price level, and print values (volume, delta, or both) inside the bars with automatic k/M formatting
- Anchored to the window edge or to its own range’s bars, left or right, with width as a share of the chart window
100% free. No trial limits, no paid tier, no license keys — activate once with your email and use it forever.