DFV Trading Group

5.0 (15 Reviews)
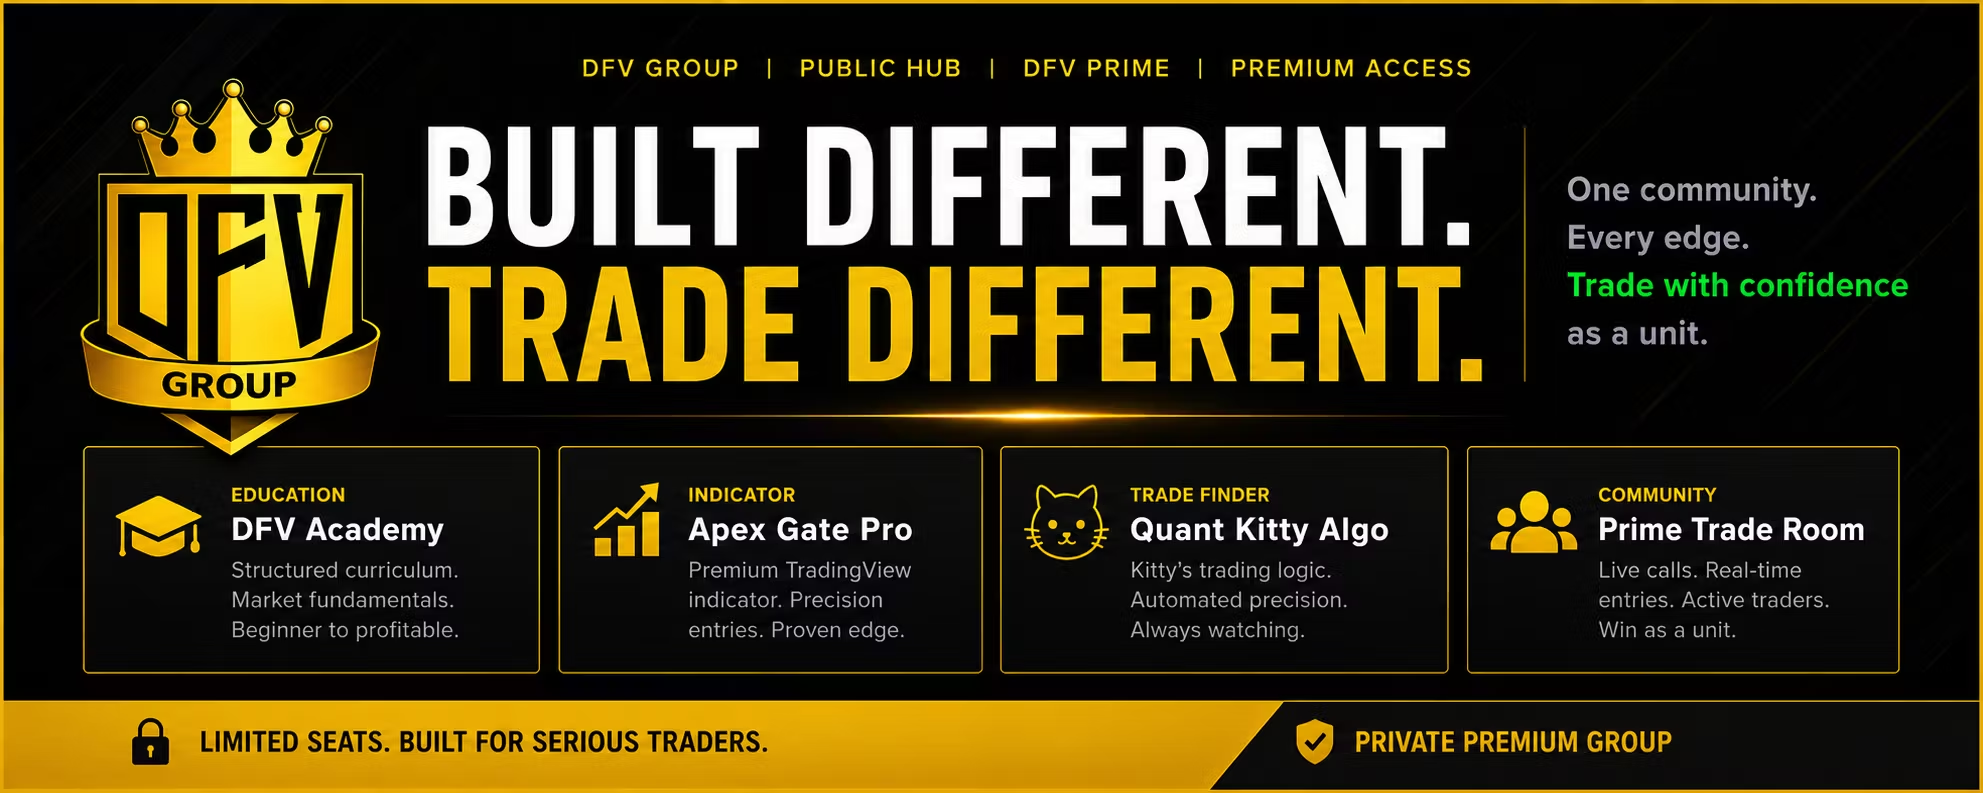
DFV Group is a premium trading community built for serious market participants. Inside you'll find the DFV Academy, our Apex Gate Pro indica...
Location hidden
Created byProfile pictureKitty
Profile picture
KittyProfile picture@quantkitty·Aug 29

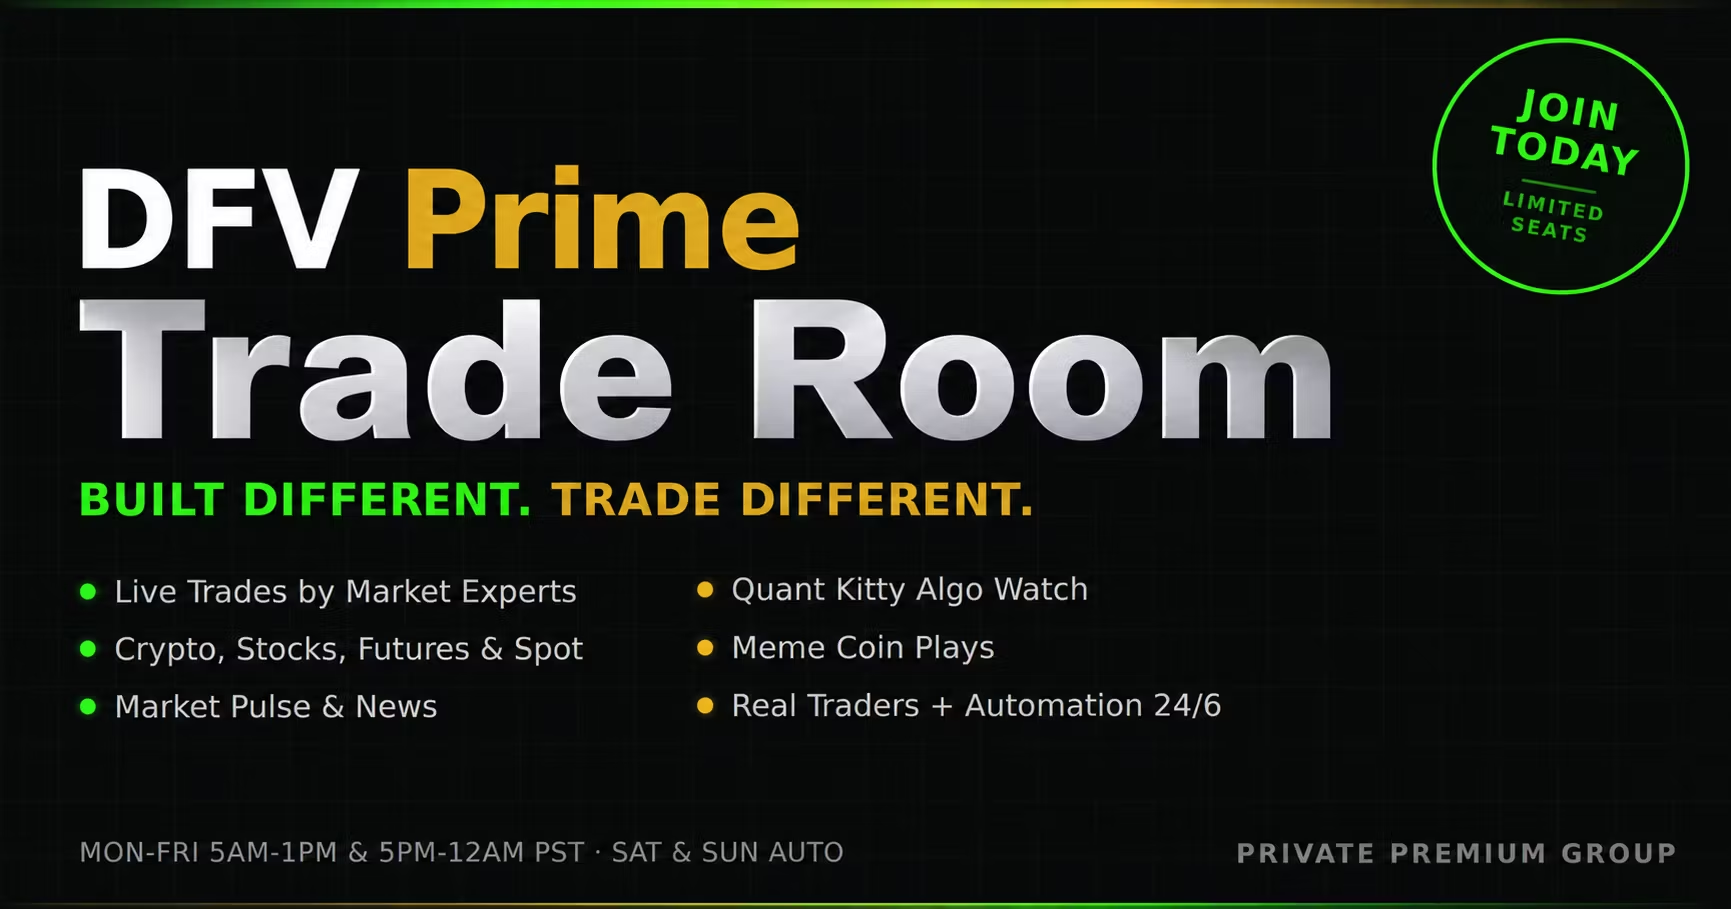
After a long debate with the rest of our team we have decided to cap the access to DFV Prime Trading Room to 150 people max. Once we reach that number DFV Prime will be strictly only accessible via a waitlist when new spots open up.

Profile picture
KittyProfile picture@quantkitty·Jul 8

Why We Built Apex Gate Pro:

Trading Was Never The Problem.

Trusting The Signals Was.

For years, I thought the biggest challenge in trading was finding better strategies.

Like most traders, I spent countless hours testing setups, adding indicators, studying more data, and trying to find that one missing piece that would finally make everything click. Every time something stopped working, the first instinct was to find another tool, another confirmation, another piece of information that could give me an edge.

Looking back, that was actually the problem.

The issue was never that there weren’t enough strategies. The issue was that there was too much noise. Too many signals, too many opinions, and too many reasons to take trades that never should have been taken in the first place.

That realization is what eventually led us to build Apex Gate Pro.

Not because the market needed another indicator. There are thousands of indicators already available. Most traders don’t fail because they don’t have access to enough tools. They fail because they have access to too many tools and no real process for filtering what actually matters.

Apex Gate Pro was built from that exact frustration.

The mistakes that changed how we looked at trading

One of the biggest lessons we learned came from our own mistakes.

The biggest issue wasn’t a lack of knowledge. It was trying to do too much.

We were taking too many trades, focusing on lower-quality setups, forcing opportunities that weren’t there, and constantly adding more data points because we thought more information meant better decisions.

It didn’t.

More information often created more confusion.

A chart can have dozens of indicators, multiple strategies, different signals, and endless confirmation methods, but at the end of the day, price only moves based on a few important factors: direction, momentum, structure, volume, and market conditions.

The goal was never to predict every move.

The goal was to identify the highest-quality opportunities and remove the trades that never had strong enough confirmation to begin with.

That shift completely changed our approach.

Building a system around confluence, not predictions

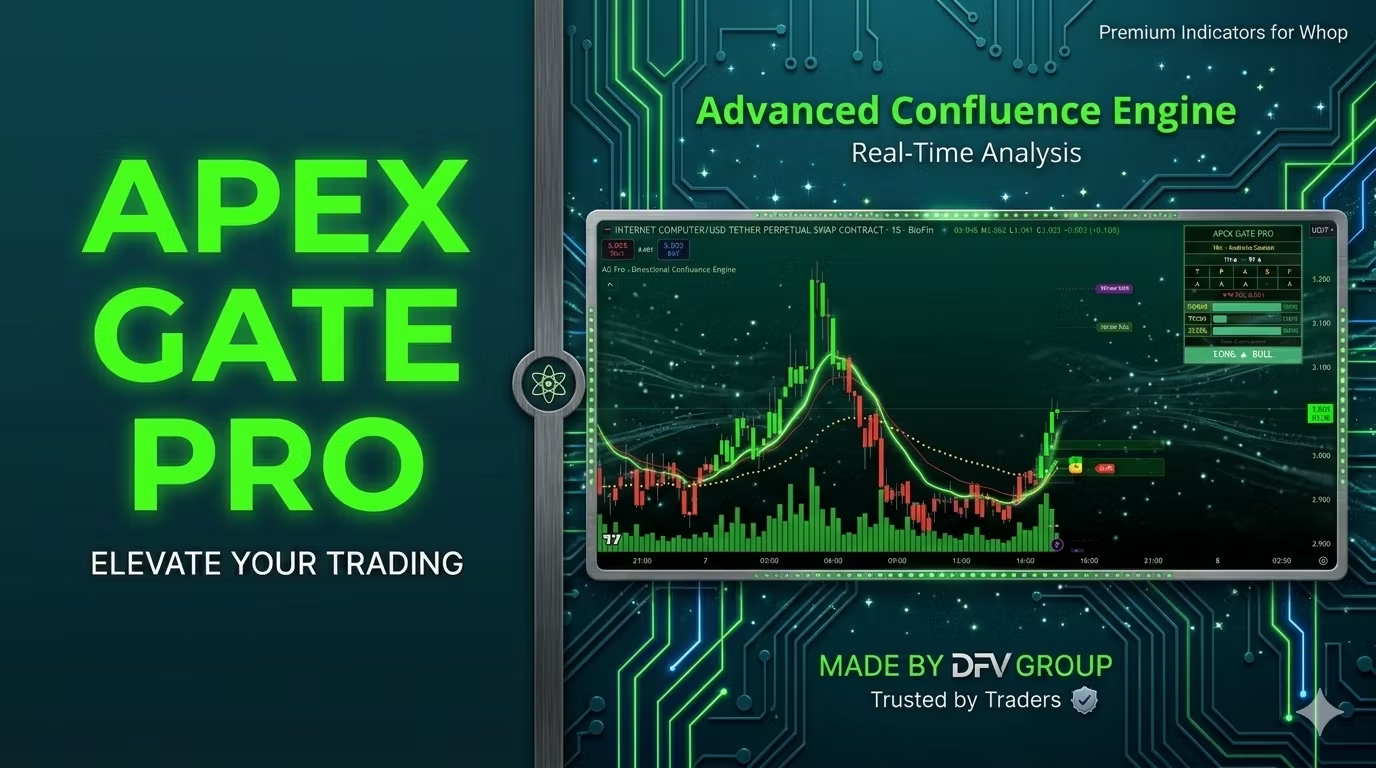
Apex Gate Pro was created as a directional confluence engine.

The purpose is not to tell traders that every signal is guaranteed to win. No indicator can do that, and anyone promising that is selling a dream.

The purpose is to bring multiple important market factors together into one streamlined decision-making process.

Instead of jumping between five different indicators and trying to manually decide which one matters most, Apex Gate Pro combines the information into a cleaner framework.

Trend direction.

Momentum.

Market structure.

Volume confirmation.

Key levels.

Session conditions.

The goal is simple: make the chart easier to read and make better decisions with less noise.

The best traders aren’t successful because they take more trades than everyone else. They are successful because they are selective. They understand that patience is a strategy.

Why simplicity became the biggest edge

One of the biggest changes we made internally was removing unnecessary complexity.

For a long time, we believed having more information gave us an advantage. In reality, it often created hesitation and over-analysis.

A trader can have ten confirmations and still lose if they are entering the wrong market environment.

A trader can have one clean setup with proper direction and risk management and outperform someone using a dozen different tools.

The edge isn’t having more.

The edge is knowing what actually matters.

That became the foundation behind Apex Gate Pro.

We wanted something that helped traders focus on the bigger picture instead of getting lost in every small movement on the chart.

How Apex Gate Pro fits into the DFV ecosystem

Apex Gate Pro was never designed to be a standalone magic button.

Trading success comes from having a process.

That is why it pairs directly with the DFV Prime Trading Room as a verification tool. The goal is to provide traders with another layer of confirmation before entering trades, helping them stay disciplined and avoid forcing setups that don’t meet their criteria.

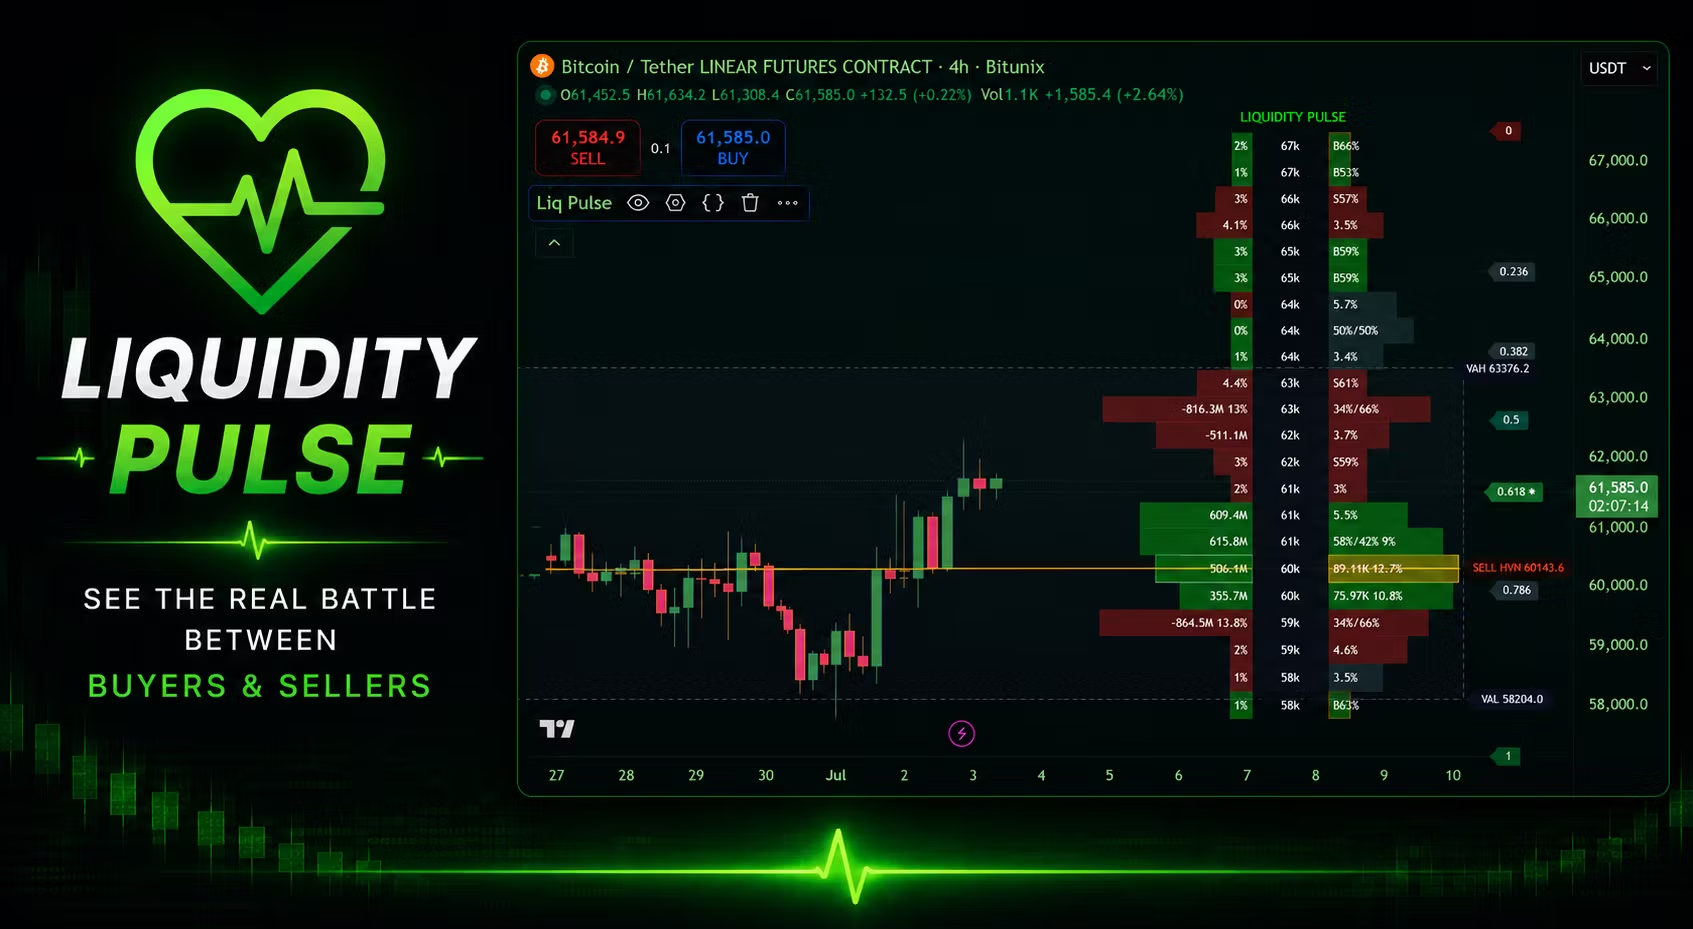
It also includes Liquidity Pulse at no additional cost, giving traders another tool to understand liquidity behavior and market movement alongside the directional confirmation from Apex Gate Pro.

Each piece has a purpose.

The goal is not to overwhelm traders with more information.

The goal is to create a cleaner workflow.

The biggest upgrade wasn't a new indicator. It was a new mindset.

The biggest lesson from building Apex Gate Pro wasn’t about coding. It wasn’t about adding more features. It wasn’t about finding a perfect signal.

It was understanding that trading becomes easier when you stop trying to predict everything.

The market will always create opportunities. The challenge is having the discipline to wait for the right ones.

After years of testing strategies, analyzing data, and making mistakes, the conclusion became clear:

The best system isn’t the one with the most moving parts.

It’s the one that helps you make better decisions consistently.

That is why Apex Gate Pro exists.

Not to replace skill.

Not to replace experience.

But to help traders remove the noise, focus on quality setups, and approach the market with a more structured process.

Sometimes the biggest improvement in trading doesn’t come from adding something new.

Sometimes it comes from removing everything that was holding you back.

Learn more about Apex Gate Pro, DFV Prime Trading Room, and the DFV ecosystem:

https://dfvgroup.co

file_NQNTM8lZfmWBv
Profile picture
Orisha B @mareeshahh·Jul 10

It took some time to get use to. But the upgrades with the scanner had helped a lot. I can see where price action is headed on a higher timeframe and plan highs and lows on the lower timeframes until it reaches goal. The market is terrible at this moment. But certain coins and stocks that are moving like the good ole days makes this direction indicator a gem.

Profile picture
KittyProfile picture@quantkitty·Jul 6

Majority of Traders enter too early-Learning to wait changes Everything


One of the hardest lessons I had to learn as a trader had nothing to do with reading charts or understanding indicators. It had everything to do with patience. Looking back now, I can honestly say that some of my biggest losses didn't come from bad strategies. They came from good ideas that I simply traded too early.

When you're new to trading, it feels like you always have to be doing something. You see price starting to move, and your brain immediately starts convincing you that this is the move you've been waiting for. You don't want to miss it. You tell yourself you'll never get another entry if you wait another minute. Before you know it, you've clicked the buy or sell button before the market has actually confirmed anything.

I can't even count how many times I watched price move toward an area I wanted to trade, convinced myself I knew what was going to happen next, entered early, got stopped out, and then watched the market do exactly what I originally expected. The direction wasn't wrong. The timing was.

That distinction changed the way I look at trading.

For a long time, I believed finding the right strategy was the answer. Every new indicator, every new setup, every new trading video promised better entries and better accuracy. I kept thinking the next strategy would solve the problem, but eventually I realized the strategy wasn't the issue. Most of the time, I wasn't giving the market enough time to prove my idea was actually correct.

The market doesn't owe us confirmation just because we think we see something developing. Price can sit around a level much longer than most traders expect. It can fake a breakout before reversing. It can sweep liquidity, retrace, and only then begin the move everyone was anticipating. Markets spend a lot of time testing patience because impatience is one of the easiest emotions to exploit.

That was one of the biggest reasons we eventually moved away from taking every setup that looked interesting. We became much more focused on waiting for confirmation instead of trying to predict what would happen next. It meant taking fewer trades, but the quality of those trades improved dramatically.

One thing I started noticing after reviewing thousands of trades was that the trades I regretted the most weren't the ones I missed. They were the ones I forced. Missing a winning trade is frustrating, but forcing a trade that never met your own rules is far worse because you know exactly where the mistake happened.

There is a strange mindset that develops when people first start trading. They believe more trades equal more opportunities to make money. In reality, the opposite is often true. Every unnecessary trade increases exposure to risk. Every impulsive entry chips away at discipline. Some of the best trading days I've had involved taking one or two trades and then doing absolutely nothing for the rest of the session.

That is much harder than it sounds.

Sitting on your hands while the market moves is uncomfortable. Watching candles develop without jumping into every move feels like you're missing opportunities. Social media makes it even worse because there is always someone posting another winning trade, another perfect chart, or another claim that they caught the exact top or bottom. It creates the illusion that everyone else is constantly making money while you're sitting there waiting.

The reality is very different.

Professional traders spend far more time waiting than they do trading. They have rules. They have conditions that need to be met before they put capital at risk. If those conditions aren't there, they simply don't trade. That sounds simple, but it took me years to fully appreciate how important that mindset really is.

This same philosophy influenced how we built our own tools. Whether it's Quant Kitty scanning markets or Apex Gate Pro helping identify stronger conditions, the goal has never been to encourage more trades. The goal has always been to help identify when patience has finally paid off and the market is providing a better-quality opportunity.

I think patience gets confused with being passive. They're not the same thing. Waiting is still an active decision. You're watching, evaluating, and preparing. You're simply refusing to commit until the evidence supports the trade. That small shift in thinking completely changed my results because it forced me to stop predicting and start reacting.

If I could give one piece of advice to the version of myself that first opened a trading chart, it wouldn't be to learn another indicator or find another strategy. It would be to slow down. Let the market show its hand first. There will always be another trade tomorrow, but there isn't always another chance to protect your capital after forcing a bad decision.

The longer I've traded, the more I've realized that consistency usually comes from the trades you don't take just as much as the ones you do. The market rewards discipline far more often than it rewards excitement, and learning to wait has probably been one of the most profitable skills I've ever developed.

file_Cdb5LZiAwDL4l
Profile picture
KittyProfile picture@quantkitty·Jun 18

How We Built the DFV Group & Quant Kitty Algo: From Simple Alerts To Algorithmic Market Analysis


What started as a simple idea to find better trading opportunities eventually turned into a much bigger mission: building a system designed to help traders make better decisions in an increasingly complex market.

When we first started trading crypto, the biggest challenge was never finding information. If anything, there was too much information. Every day there are thousands of opinions, indicators, predictions, charts, and signals competing for attention. Everyone has a different strategy, everyone has a different explanation for why the market is moving, and everyone seems to have the next big indicator or system that is supposed to change everything. The problem was not access to information. The problem was knowing what information actually mattered.

Like most traders, we started by learning the basics. We tested indicators, studied charts, experimented with different strategies, and spent countless hours trying to understand what separates a good setup from a bad one. Some strategies worked extremely well in certain market conditions. Others looked promising at first but eventually failed when the environment changed. That was one of the biggest lessons we learned early on. The market is not static.

A strategy that works perfectly during a strong trending market can completely fall apart when volatility decreases. A setup that performs well during a bull market may struggle during a prolonged correction. The market is constantly changing, and the biggest challenge is not finding a strategy that works once. The challenge is building a process that can adapt.


Over time, we realized that successful trading was not about finding the perfect indicator or some secret strategy that nobody else knew about. Those things do not exist. The real advantage comes from having a structured process for analyzing information and making better decisions consistently. That realization is what eventually led to the creation of Quant Kitty.

The original idea was simple. We wanted a system that could help monitor the market, identify potential opportunities, and remove some of the emotional decision-making that affects almost every trader at some point.

Because the reality is that trading is not difficult because people do not know what to do. Most traders understand the basics. They understand risk management. They understand support and resistance. They understand trends and momentum. The difficult part is making the right decision when real money is involved.

A losing trade creates emotion. A missed opportunity creates frustration. A winning streak creates overconfidence. Even experienced traders deal with these challenges because the market constantly tests discipline.

The goal behind Quant Kitty was never to create a magic system that predicts every move. That is impossible.

The goal was to build something that could help traders process information more effectively and focus on higher-quality opportunities.


As development continued, we quickly realized that finding potential trades was only one part of the problem. The bigger challenge was filtering.

A market can produce hundreds of possible setups every single day. The question is not whether opportunities exist. The question is whether those opportunities actually deserve attention. This completely changed the way we approached building the system. Instead of asking, “How do we find more trades?” We started asking, “How do we remove the trades that should never happen?” That shift changed everything.

Many trading systems today are built around simple triggers. An indicator reaches a certain level, a crossover happens, or a pattern forms, and the system reacts. But markets do not move because an indicator says they should.

Context matters. A breakout with strong volume and market participation is completely different from a breakout happening in low liquidity. A reversal setup during a strong trend is different from a reversal setup inside random market noise. A momentum signal means something different depending on where price is located and what the broader market is doing.


This is why we started focusing more on market context rather than individual signals.

Trend matters, Momentum matters, Volume matters, Structure matters, Timing matters, Risk matters!

The strongest opportunities usually happen when multiple factors align together, not when one single indicator flashes a signal. This same philosophy is what continues to guide everything we build at DFV Group today.

Whether it is Quant Kitty analyzing markets or Apex Gate Pro helping traders identify stronger conditions, the goal is the same: reduce noise, improve decision-making, and give traders better tools to navigate the market.

One thing we have learned throughout this process is that automation itself is not the advantage. Everyone will eventually have access to automation. The advantage comes from the logic behind the system.

A bad strategy running automatically is still a bad strategy. A system that produces hundreds of low-quality signals does not help traders. In many cases, it creates more confusion and encourages more overtrading. The future of trading is not about replacing humans with machines. It is about using technology to enhance human decision-making.


Professional traders have always used tools. They use data, scanners, analytics, and systems to improve their process. Technology gives traders the ability to analyze more information, but the quality of the decisions still comes down to the quality of the system behind it.

That is what we are focused on building. Not another flashy signal service. Not another unrealistic trading bot promising overnight success. Tools built from years of testing, mistakes, adjustments, and real market experience. Quant Kitty started with a simple question: How can we help traders make better decisions?

That question continues to drive everything we do. Markets will always change. Strategies will always evolve. There will always be new challenges for traders to solve.

But one thing will never change. The traders who consistently improve are the ones who focus on better information, better processes, and better decision-making. That is what we are building toward at DFV Group.

file_tcVLz4fnhCUZL
Profile picture
KittyProfile picture@quantkitty·Jun 8

One thing I’ve learned after being around trading long enough is that some of the most expensive lessons don’t come from bad trades. They come from bad ideas. Not even obviously bad ideas either. The ones that cost me the most were usually the ones that sounded smart at the time because everyone around me was repeating them. When enough traders say the same thing, you stop questioning it and just assume it must be true.


A good example is the classic advice to “wait for confirmation.” If you’ve spent any time in trading communities, you’ve probably heard that phrase thousands of times. It’s everywhere. You hear it on YouTube, on Twitter, in Discords, from traders who are supposedly doing extremely well. The strange part is that nobody really defines what confirmation actually is. Ask ten traders and you’ll get ten different answers. One needs a candle close, another wants a break of structure, someone else wants volume, someone else wants an indicator cross. Same phrase, completely different meanings.


For a long time I genuinely thought I was being disciplined by waiting for confirmation. Looking back, I think I was mostly avoiding responsibility. Instead of making a decision, I was always looking for one more piece of information. Then another. Then another. I told myself I was being patient, but in reality I was just uncomfortable executing. By the time everything “lined up,” half the move was usually gone and the trade was nowhere near as good as it looked at the start.


The more time I’ve spent in the markets, the more I’ve realized trading isn’t about certainty. The market doesn’t give you certainty. There isn’t a candle that appears to tell you risk is gone. Every trade is taken with incomplete information. Everything is probabilistic. The difference between experienced and newer traders isn’t that experienced traders know what’s going to happen. It’s that they’re comfortable making decisions without needing every possible condition to line up first.


Another piece of advice that used to annoy me was “just trade less.” It sounds intelligent until you actually think about it. If someone is taking bad trades, taking fewer bad trades doesn’t solve the core issue. The problem isn’t necessarily frequency, it’s quality and process. I’ve seen traders take one trade a week and still lose consistently. I’ve also seen traders take multiple trades a day and do very well because they actually had structure and knew exactly what they were looking for.


That’s something I’ve noticed more over time. A lot of trading advice gets compressed into one-line slogans because they’re easy to repeat. The issue is that real trading doesn’t fit into slogans. Context matters. Market conditions matter. Personality matters. What works for one trader can be completely wrong for another.


It’s actually part of the reason I’ve been simplifying my own process lately. Not because certain ideas never worked, but because when I stepped back and looked at results objectively, some things just weren’t adding enough edge to justify the attention they required. That’s a very different question than “does this work sometimes?”


These days I’m a lot more skeptical when I hear popular trading advice repeated everywhere. Not because it’s automatically wrong, but because popularity and usefulness aren’t the same thing. Some of the biggest improvements in my trading came from questioning things I had accepted for years without really testing them.


Looking back, that’s probably the biggest shift. I used to think improvement meant adding more-more indicators, more setups, more information. Most of the real progress actually came from the opposite. Cutting things out. Simplifying. Removing ideas that sounded good but weren’t producing consistent results.

The market is already complicated enough. The last thing you want is carrying beliefs you never actually challenged.

file_NBZD6tvXsNCYW
Profile picture
Marubrozu@marubrozu·Jun 8

🔥

Profile picture
KittyProfile picture@quantkitty·Jun 8

Why We Removed Liquidity Sweeps & FVGs From Our Trading System


A few months ago I made a decision that would’ve sounded completely backwards to me a couple years earlier. I removed two of our most popular setups from our playbook: liquidity sweeps and fair value gaps.

Not because they never worked, and not because people weren’t able to catch wins with them. But after watching them play out across enough market conditions, I realized something I couldn’t ignore anymore - they were creating far more noise than actual edge.

And that’s not an easy conclusion to come to when something is widely accepted.

If you spend even a little time on TradingView or social media, you’ll see these setups everywhere. Sweeps on every high, gaps on every move, and every chart starting to look like it’s packed with “high probability” opportunities. That’s exactly what started to bother me. If there are that many setups showing up every single day across every timeframe, why don’t the results reflect that same consistency?

The more I studied real execution in live conditions, the more it became clear that both of these setups are extremely prone to fakeouts. Price sweeps a level and traders immediately jump in expecting a reversal, only for price to continue running. An FVG forms, expectations build, and then nothing materializes. And when it doesn’t work, the explanations always follow - wrong timeframe, missing confirmation, bad context, early entry. At some point, if a setup needs that many layers of justification for why it failed, it’s fair to question the strength of the setup itself.

To be clear, both concepts can work. We’ve taken trades from them and made money using them before. And honestly, that’s part of the problem. They work just often enough to keep you interested. You get a few clean wins, and suddenly every chart starts to look tradable.

But when I stepped back and looked at actual performance - not screenshots, not isolated examples, but real data and real execution - the consistency wasn’t coming from sweeps or FVGs. It was coming from trend continuation. Markets already moving. Structure already established. Momentum already in play. Trades where we were aligning with what the market was doing, not trying to predict every reversal.

The other issue was risk. Most sweep and FVG-based trades naturally sit in lower timeframes with tighter invalidation and smaller effective moves. To make them worth taking, traders often end up increasing leverage to compensate, which adds even more risk to setups that are already inconsistent in nature.

At that point, it stopped making sense.

Why take lower-probability setups, apply higher leverage, and deal with more noise when cleaner continuation opportunities are already available in the same market environment?

So we simplified. Instead of adding more, we started removing anything that didn’t consistently contribute to performance. Most traders go the other direction - more indicators, more setups, more complexity. We did the opposite.

And the result was immediate. Fewer alerts, fewer trades, less hesitation, and far more clarity in execution.

Today, the focus is simple: structure, momentum, and continuation. Not predicting every sweep or reacting to every gap, but aligning with what the market is already showing us.

Could sweeps and FVGs still work in certain contexts? Absolutely. But we’re not in the business of collecting setups. We’re in the business of consistency.

And when we looked at the data honestly, those two just weren’t pulling their weight anymore.

Sometimes the biggest improvement in trading isn’t adding something new. It’s having the discipline to remove what no longer belongs.

file_WRBhPumLaUVtB
Profile picture
saheed@abdulwasiusaheed·Jun 8

‎From earning $200/month as a dry cleaner to generating $21,000 this month in my dropshipping store what a difference a year makes.

‎When I started, I had zero experience. I just committed to the process, stayed consistent, and kept my faith. Now that I’ve found a path to financial independence, I want to honor a promise I made to myself: to help others do the same. I’ve noticed a "pay it forward" effect my business grows even more when I help others get their start.

‎Want to see the blueprint? Reach out if you’re looking for advice on how to scale or get started.

Profile picture
KittyProfile picture@quantkitty·Jun 2

Trading Sessions That Actually Deliver


People love talking about the Asia session, London session, New York session, and all the textbook market session theory.

And while that stuff matters, I've found something much more important after spending thousands of hours in front of the charts:

Know when YOUR market actually moves.


For me, there are three windows that consistently produce the highest-quality opportunities.


5AM - 9AM: The Money Window

If I could only trade one session a day, this would be it.

This is where I see the cleanest breakouts, strongest momentum, and highest volume. The market tends to make its intentions clear and when a move starts, it often moves fast.


Most of my best trades come from this window.


9AM - 1PM: Continuation Time

By this point, the initial volatility has already hit.

But that doesn't mean the opportunities are gone.

This is where I look for continuation setups, pullback entries, retests, and second-leg moves. Strong coins tend to keep moving while weaker names start showing their hand.


Less chaos. More structure.


5PM: Daily Candle Reset

This one gets overlooked.

The new daily candle opens and you'll often see a quick burst of activity as traders reposition.

Volume isn't as high as the morning session, but it can be a great time to find a scalp or identify levels for the next day.


Sessions I Personally Avoid

For me, late-night trading usually creates more problems than profits.

The Asian open and overnight sessions can work, but I often find the price action choppy and inconsistent compared to my core windows.

More importantly, trading outside my best hours usually leads to overtrading.


The Takeaway

Stop focusing on when the market is supposed to move and start tracking when it actually moves for you.

My highest-performing windows are:

• 5AM - 9AM
• 9AM - 1PM
• 5PM PST


If you're struggling with consistency, start logging the time of day for every trade you take.

You may find that a huge percentage of your profits come from a very small number of trading hours.

Once you know where your edge lives, you can stop forcing trades and focus your energy where the market pays the most.

file_LTkNxcWvTcC4B
Profile picture
Marubrozu@marubrozu·Jun 3

Nice!

Profile picture
KittyProfile picture@quantkitty·May 22

🗺️ Using Bitcoin Liquidation Heatmaps to Anticipate Market Direction


In crypto futures, price doesn't move because of random retail sentiment; it moves to hunt liquidity. One of the most powerful, data-driven tools for tracking these institutional targets is the Bitcoin Liquidation Heatmap.

Instead of guessing where a trend might reverse or expand, liquidation heatmaps visualize exactly where clusters of highly leveraged positions are trapped, giving systematic traders a clear map of the market's path of least resistance.


🧠 The Mechanics: Why This Data Matters


The market is fundamentally an efficiency engine designed to clear out over-leveraged market participants. When retail traders crowd into heavily leveraged long or short positions, they leave behind massive pools of resting liquidity (their liquidation prices).

When the price moves toward a dense cluster of these orders, it acts like a financial magnet. Institutional algorithms, market makers, and large whales will aggressively push the price directly into those zones to trigger a cascade of forced liquidations. By triggering these stops, large players capture the massive counter-party liquidity they need to fill their own deep-pocket orders. Recognizing these zones gives you a definitive directional edge before the expansion happens.


⚡️ Structural Execution: How to Read the Map


To successfully integrate heatmaps into your daily trading matrix, you must apply a strict rules-based framework:

1. Map High-Density Liquidity Clusters

Look at the heatmap for bright, high-contrast horizontal bands (often colored neon cyan, yellow, or bright green depending on intensity). These indicate severe concentrations of trapped capital. The brighter the band, the higher the "pain point" and the stronger the magnetic pull.

2. Gauge Velocity & Momentum Continuation

If price breaks out of a local consolidation range and begins trading toward a massive liquidation cluster, the probability of continuation spikes. Expect the move to accelerate violently until those targeted liquidation levels are completely swept and cleared.

3. Enforce Multi-Signal Confluence

Never trade a heatmap in a vacuum. A liquidation cluster is just an area of high interest. You must validate the zone by overlaying it with your core toolset:

  • Clear horizontal Support/Resistance levels or order blocks.

  • High-Timeframe Fibonacci extension targets.

  • Real-time order flow signatures (gRPC optimized delta shifts or volume imbalances) to confirm absorption.

4. Dynamic Risk Mitigation

Liquidation levels are not static. As the market prints new candles, retail traders move their stops, add margin, or get closed out, meaning the heatmap morphs in real-time. Protect your capital by trailing stops behind structural market flips, keeping leverage conservative, and never marrying a bias if the liquidity maps shift.

🛠️ Premium Technical Resources

To actively monitor these metrics and apply this framework in real-time, utilize the institutional-grade data engines below:

📈 Final Thoughts


Liquidation heatmaps are not magic crystal balls that predict exact price to the dollar, but they do expose the exact coordinate maps where systemic risk and forced liquidations live. By marrying this mapping data with strict technical analysis and an ironclad risk management model, you stop trading blindly and start riding the waves created by smart money.

Stop chasing the noise. Follow the liquidity.


> DFV GROUP

file_AyWjloHczOJHV
Profile picture
Marubrozu@marubrozu·Jun 3

🔥

Profile picture
KittyProfile picture@quantkitty·May 20

🚀 How to Spot the Bottom Before the Big Pump (Long Setups)


When the market is bleeding out, retail traders freeze. Fear dominates the charts, social media timelines scream “more downside,” and the crowd panics. But for systematic traders, maximum fear is where elite opportunities hide.

Long entries don’t come from blindly catching a falling knife-they come from stacking mechanical confluences until the risk-to-reward ratio is too asymmetric to ignore. Here is the institutional blueprint for identifying structural macro bottoms and execution triggers:


1. Volume Exhaustion & Climax Selling

During a heavy capitulation wave, watch for a final, parabolic surge of red volume that dwarfs all previous candles. This represents cascading forced liquidations and panic sellers puking their positions.

The Signal: If the price subsequently prints a minor lower low but the volume drastically fades, sellers are out of ammunition. Smart money is utilizing that massive retail sell liquidity to scale into long positions.


2. Order Book Accumulation Behavior

Early in a market dump, bid walls disappear completely while aggressive ask walls dominate.

The Bottoming Shift: Near structural exhaustion, massive hidden liquidity (iceberg bids) begins loading up on the order book. If aggressive market shorts continue to execute into those passive bids but the price refuses to drop lower, it is a definitive signature of institutional absorption, not weakness.


3. Multi-Timeframe Momentum Alignment

When the RSI drops sub-20 and the Stochastic RSI flatlines near zero across multiple consecutive higher-timeframe (HTF) candles, the market is severely overextended.

The Key Filter: Being oversold is not enough. You must wait for a failure to break lower while indicators are flatlined. This divergence proves that sellers are pressing the short button heavily, yet failing to create price expansion.


4. Bullish Reversal Candlestick Matrix

Look strictly at the 15m and 1h charts for local structural shifts, and the 4h for macro validation. You are searching for three specific formations:

  • The Long-Wick Hammer: A deep red candle that gets aggressively absorbed, leaving a massive lower wick (liquidity rejection).

  • The Bullish Engulfing: A strong green body that completely swallows the body of the preceding red candle, forcing an immediate momentum flip.

  • The 3-Step Rollover: Large expansionary - Indecision Doji/Hammer - Heavy expansionary green.


5. High-Timeframe Key Support Pools

Markets never bottom in random territory; they bottom where massive pools of resting liquidity sit.

The Target Zones: Map out major historical horizontal demand bases, key Fibonacci retracements ($0.618$ / $0.786$), or daily/weekly exponential moving averages (like the 200 EMA. If a dump continuously tests a specific level but repeatedly fails to close below it on a higher-timeframe candle body, it is an active accumulation zone.


6. Funding Rate & Open Interest Reset

At market peaks, over-leveraged longs crowd the trade, sending funding rates skyrocketing positive. At market bottoms, the exact inverse occurs.

The Short Squeeze Fuel: When the funding rate goes deeply negative and Open Interest (OI) stretches to extremes, it indicates retail traders are aggressively chasing shorts at the absolute lows. Once price stabilization occurs despite this immense short pressure, market makers push price up, cascading those over-leveraged shorts into forced liquidations to fuel your rally.


⚡️ The Long Setup Formula

Do not execute until the mechanical filters line up sequentially:

Capitulation Climax - Absorption Bids - Oversold Alignment - Support Pool Validation

Once these criteria are met, look for a low-timeframe Market Structure Shift (MSS). When market structure flips bullish and structural resistance is broken and retested as support, your entry trigger is active.


⚠️ Risk Management Parameters: Always scale into your long position smoothly and place your invalidation stop-loss strictly below the freshly formed swing low structure. Catching the exact bottom wick is a gambler's game. Capturing 80% of the confirmed reversal move with an airtight risk model is how professional portfolios are built.

Bottom Line: The most profitable long positions are taken in moments of max fear, not comfort. When retail panics and screams "new lows," smart money accumulates. Wait for systemic exhaustion, read the order flow, and ride the reversal while the herd gets squeezed.

> DFV GROUP


#crypto #stocks #trading

file_4PkI2ouulRPRj
Profile picture
KittyProfile picture@quantkitty·May 19

🚨 How to Spot the Reversal Before the Big Dump


When an asset is ripping vertically, retail traders fall victim to FOMO and think it’ll never stop. But every parabolic expansion phase has an exhaustion point—and that is exactly where high-probability short entries are hidden.

As systematic traders, we don't guess the top. We read the data. Here is the strict structural confluence to look for before a pump rolls over:


1. Volume Exhaustion (Divergence)


Price keeps printing higher highs, but the volume bars are printing lower lows. This tells you the buying velocity is drying up while institutional smart money is quietly distributing their supply into the retail breakout orders.


2. Order Book & Delta Shifts


Massive, passive sell walls begin loading up on the depth chart while the buy walls thin out. If you track raw order flow and see aggressive long liquidations starting to print while the price stalls, the bullish momentum is completely tapped.


3. Structural Overbought Signatures


When momentum oscillators (like the RSI or Stochastic RSI) are heavily stretched above the $80$ line across multiple higher-timeframe candles, the upside runway is limited. If price action stalls at a key level while these indicators are maxed out, a reversal is imminent.


4. Bearish Reversal Candlesticks


Look strictly at the 15m and 1h charts for structural clues. You are waiting to see long topping wicks (indicative of heavy sell liquidity being hit), bearish engulfing candles, or a clean three-candle rollover matrix.


5. High-Timeframe Key Level Rejections


A vertical pump runs directly into a major historical resistance level, a key Fibonacci extension, or a daily EMA anchor. Price taps it repeatedly but fails to secure a structural body close above it. Once the minor trendline or local support beneath that consolidation cracks, the dump accelerates.


6. Funding Rate Exploitation


When open interest spikes and the funding rate goes heavily positive while price stops climbing, it means late-stage longs are aggressively leveraged and highly trapped. Market makers and algorithmic desks love to drive price downward to cascade these over-leveraged positions into forced liquidations.


⚡️ The Execution Setup


Do not step in front of a moving freight train. Wait for the confluences to stack:

Fading Volume + Overbought Momentum + Funding Flip + Key Level Rejection

Once those filters are checked, wait for a clean Market Structure Shift (MSS) or local support break on the lower timeframes. That break is your trigger to execute the short position.


⚠️ Risk Parameter: Always place your invalidation stop-loss strictly above the recent swing high. Catching reversals yields massive Risk-to-Reward ratios, but running a loose risk model will get you run over.

Bottom Line: Let retail chase the FOMO pump. Wait for systemic exhaustion, read the on-chain data, and nail the short entry right where the crowd thinks it’s breaking out to the moon.

> DFV GROUP

file_l1MXz3ZrflASb
Profile picture
Marubrozu@marubrozu·May 21

🔥 education guys!