DVT Trading Suite

5.0 (2 Reviews)
A seasoned trader with over a 15 years of experience in the financial markets, specializing in both technical and fundamental analysis; now...
49 joined
Profile picture
DVTrendz 4.5 Trading SuiteProfile picture@doomtardetrades·2d

DVT 4.8 LVL — The Complete Guide

One overlay. Every level that matters. Nothing that doesn't.


DVT 4.8 LVL is a full levels-and-signals suite for TradingView: multi-timeframe momentum triggers, institutional price-action levels, opening range, higher-timeframe pivots, anchored VWAP, real order-flow delta, an automated support/resistance engine, confluence detection, and two independent reversal-signal engines — classic candlestick patterns and The STRAT — all in a single indicator built for traders who trade levels, location, and confluence instead of chasing noise.

This guide covers every module, every setting, and how they work together — plus ready-to-use trade idea templates at the end.


1. Chart Timeframe Templates — One-Click Setup

At the very top of the settings sits the Chart Timeframe Template dropdown. Pick the timeframe you trade and the indicator configures itself with the most actionable set for that chart.

Choices: Custom (default) · 1Min · 5MIN · 15MIN · 30MIN · 60MIN · 240MIN · DAY · Week · Month

How templates work

  • Custom = every checkbox and setting below applies exactly as you configured it. Full manual control.

  • Any timeframe template = the indicator overrides the toggles with a curated set. The checkboxes on screen don't move — behavior does. Switch back to Custom and your manual setup returns instantly.

  • Colors, line styles, label sizes, and cosmetics are never overridden. Your look stays yours.

The template base — always on

Every template starts with a clean, levels-first chart:

  • Price Action levels (scaled to your timeframe — see below)

  • Cumulative Delta heatmap

  • Support/Resistance ranking (S1–S3 / R1–R3)

  • Unified Confluence levels

  • Trend-colored candles

The Add toggles — opt-in power

Below the dropdown are six Add switches (all off by default). Each one layers a module into the template with that timeframe's correct parameters:

  • Add MTF Triggers — the trigger ladder for your timeframe

  • Add HTF Pivots — both pivot sets, always at timeframes above your chart

  • Add Opening Range — sized to your chart (intraday templates only)

  • Add Candle Reversals — pattern engine with the validated filter stack pre-enforced

  • Add The STRAT — STRAT engine with HTF Alignment pre-configured

  • Add AVWAP — anchored VWAP with the right anchor for your timeframe

What each template loads

  • 1Min — Trigger Ladder: 1, 5, 30M  —  HTF-1 / HTF-2 Pivots: 15M / 30M  —  AVWAP Anchor: Day  —  Opening Range: 5 min

  • 5MIN — Trigger Ladder: 5, 15, 30M  —  HTF-1 / HTF-2 Pivots: 30M / 60M  —  AVWAP Anchor: Day  —  Opening Range: 5 min

  • 15MIN — Trigger Ladder: 15, 30, 60M  —  HTF-1 / HTF-2 Pivots: 60M / 120M  —  AVWAP Anchor: Day  —  Opening Range: 15 min

  • 30MIN — Trigger Ladder: 30, 60, 120M  —  HTF-1 / HTF-2 Pivots: 120M / 240M  —  AVWAP Anchor: Day  —  Opening Range: 30 min

  • 60MIN — Trigger Ladder: 60, 120, 240M  —  HTF-1 / HTF-2 Pivots: 240M / Day  —  AVWAP Anchor: Weekly  —  Opening Range: —

  • 240MIN — Trigger Ladder: 240M, D, 3D  —  HTF-1 / HTF-2 Pivots: Day / 3D  —  AVWAP Anchor: Weekly  —  Opening Range: —

  • DAY — Trigger Ladder: D, 3D, W  —  HTF-1 / HTF-2 Pivots: 3D / Week  —  AVWAP Anchor: Monthly  —  Opening Range: —

  • Week — Trigger Ladder: W, 2W, M  —  HTF-1 / HTF-2 Pivots: 2W / Month  —  AVWAP Anchor: Quarterly  —  Opening Range: —

  • Month — Trigger Ladder: 2W, M  —  HTF-1 / HTF-2 Pivots: Month / 3M  —  AVWAP Anchor: —  —  Opening Range: —

Price Action levels slide with the timeframe too: day levels on intraday charts, week levels from 5MIN up, month levels from 30MIN up, quarterly from 240MIN up. Nothing below your trading horizon, nothing absurdly above it.


2. MTF Momentum Triggers

Thirteen multi-timeframe EMA baselines — 1-minute through Monthly — that price historically respects. Each trigger:

  • Plots as a thin line, colored solid when price is above it and dimmed when below

  • Carries a compact chip label showing its timeframe, with the exact price on hover

  • Feeds the S/R engine — an active trigger competes to be your S1/R1

Custom-mode default: 60MIN and Daily — the two workhorse baselines. Enable any others per your style.

Behavior note: trigger requests only run while their toggle is on — disabled triggers cost zero resources. And triggers below your chart timeframe rely on TradingView's limited lower-TF data; prefer triggers at or above your chart.


3. Cumulative Delta — Real Order Flow

The delta engine reads actual buy/sell volume from TradingView's volume footprint on supported symbols (futures, stocks, ETFs), with an automatic lightweight fallback (close position within the bar's range) where footprint data doesn't exist.

Settings

  • Delta Source: Footprint (default) or Range Proxy.

Important: select Range Proxy for Bar Replay — TradingView does not provide footprint data in Replay mode.

  • Reset Period: Rolling (default) · 15MIN · 30MIN · 1/2/4 Hour · Daily · 3Day · Weekly · Monthly

  • Rolling Bar Period: 2–30 bars (default 3)

  • Heatmap: bottom-of-chart strip (position/size configurable) that glows the Bull color when rolling delta is positive, Bear when negative, intensity scaled by delta percentage

  • A 2-bar minimum signal hold prevents single-bar color flicker

Rolling delta also powers the optional order-flow filters inside both reversal engines (below).


4. Price Action Levels

The structural backbone. Organized by period, each with independent line/label styling:

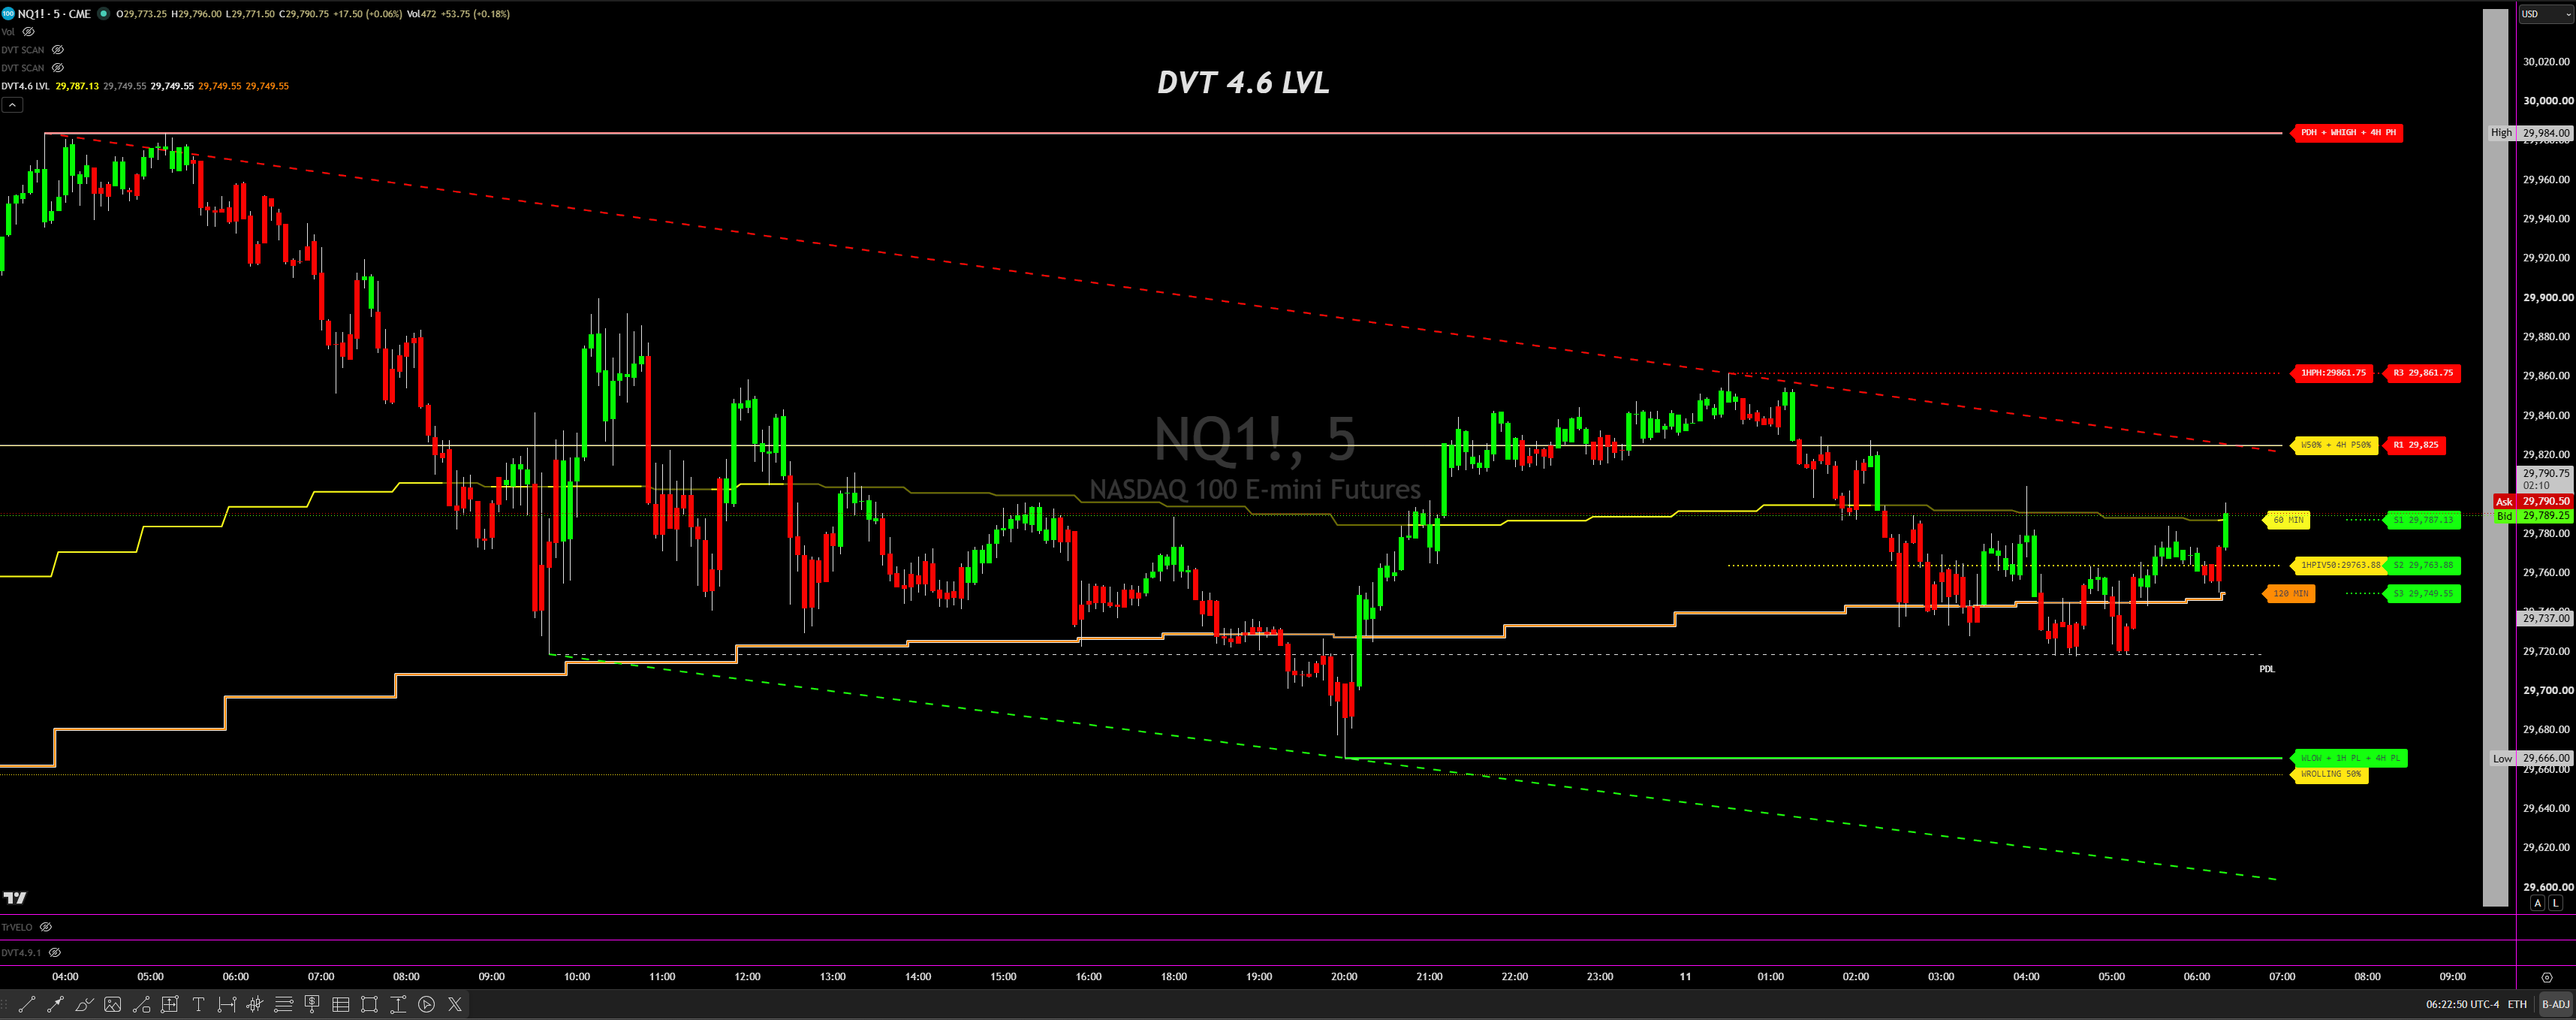
  • Current Day — High, Low, 50% retrace

  • Previous Day — High, Low

  • Current Week — High, Low, 50%, Rolling 50% (5-day midpoint)

  • Previous Week — High, Low

  • Current Month — High, Low, 50%, Rolling 50% (20-day midpoint)

  • Previous Month — High, Low

  • Quarterly — Rolling 50% (60-day midpoint)

Conventions across the set: highs red, lows white, all 50% retracements amber. Lines dotted, extending right. Current-period labels sit at the line's origin; every 50% level renders as a solid chip with auto-contrast text. Every enabled level feeds the S/R engine.

Custom-mode default: current week structure + current month structure — the swing trader's map.


5. Opening Range

Define your session's opening range from 1–61 minutes. The engine locks the high, low, and 50% midpoint of exactly that window — to the candle (a 5-minute OR on a 5-minute chart is precisely the first candle).

  • OR High (red), OR Low (green), OR 50% (amber), dashed, extending right

  • Labels at the range origin

  • All three levels feed the S/R engine

  • Intraday charts only


6. Higher-Timeframe Pivots

Two independent pivot sets (HTF-1, HTF-2), each with its own timeframe, strength (left/right bars), colors, and count.

  • Pivot Highs, Pivot Lows, and the Pivot 50% midpoint between the current PH/PL

  • Trendlines automatically connect consecutive pivot highs and consecutive pivot lows — structure at a glance

  • Chip labels show the timeframe in plain language ("1H PH", "4H PIV50") with price on hover

  • Current pivots feed the S/R engine and the Unified Confluence engine

Stability guarantee: pivot requests are automatically clamped to never run below your chart timeframe — pivots can't shift because you toggled an unrelated feature. Honesty note: a pivot confirms only after its right-side bars complete. That's inherent to pivot logic — the trade-off for structural significance.


7. The Support/Resistance Engine

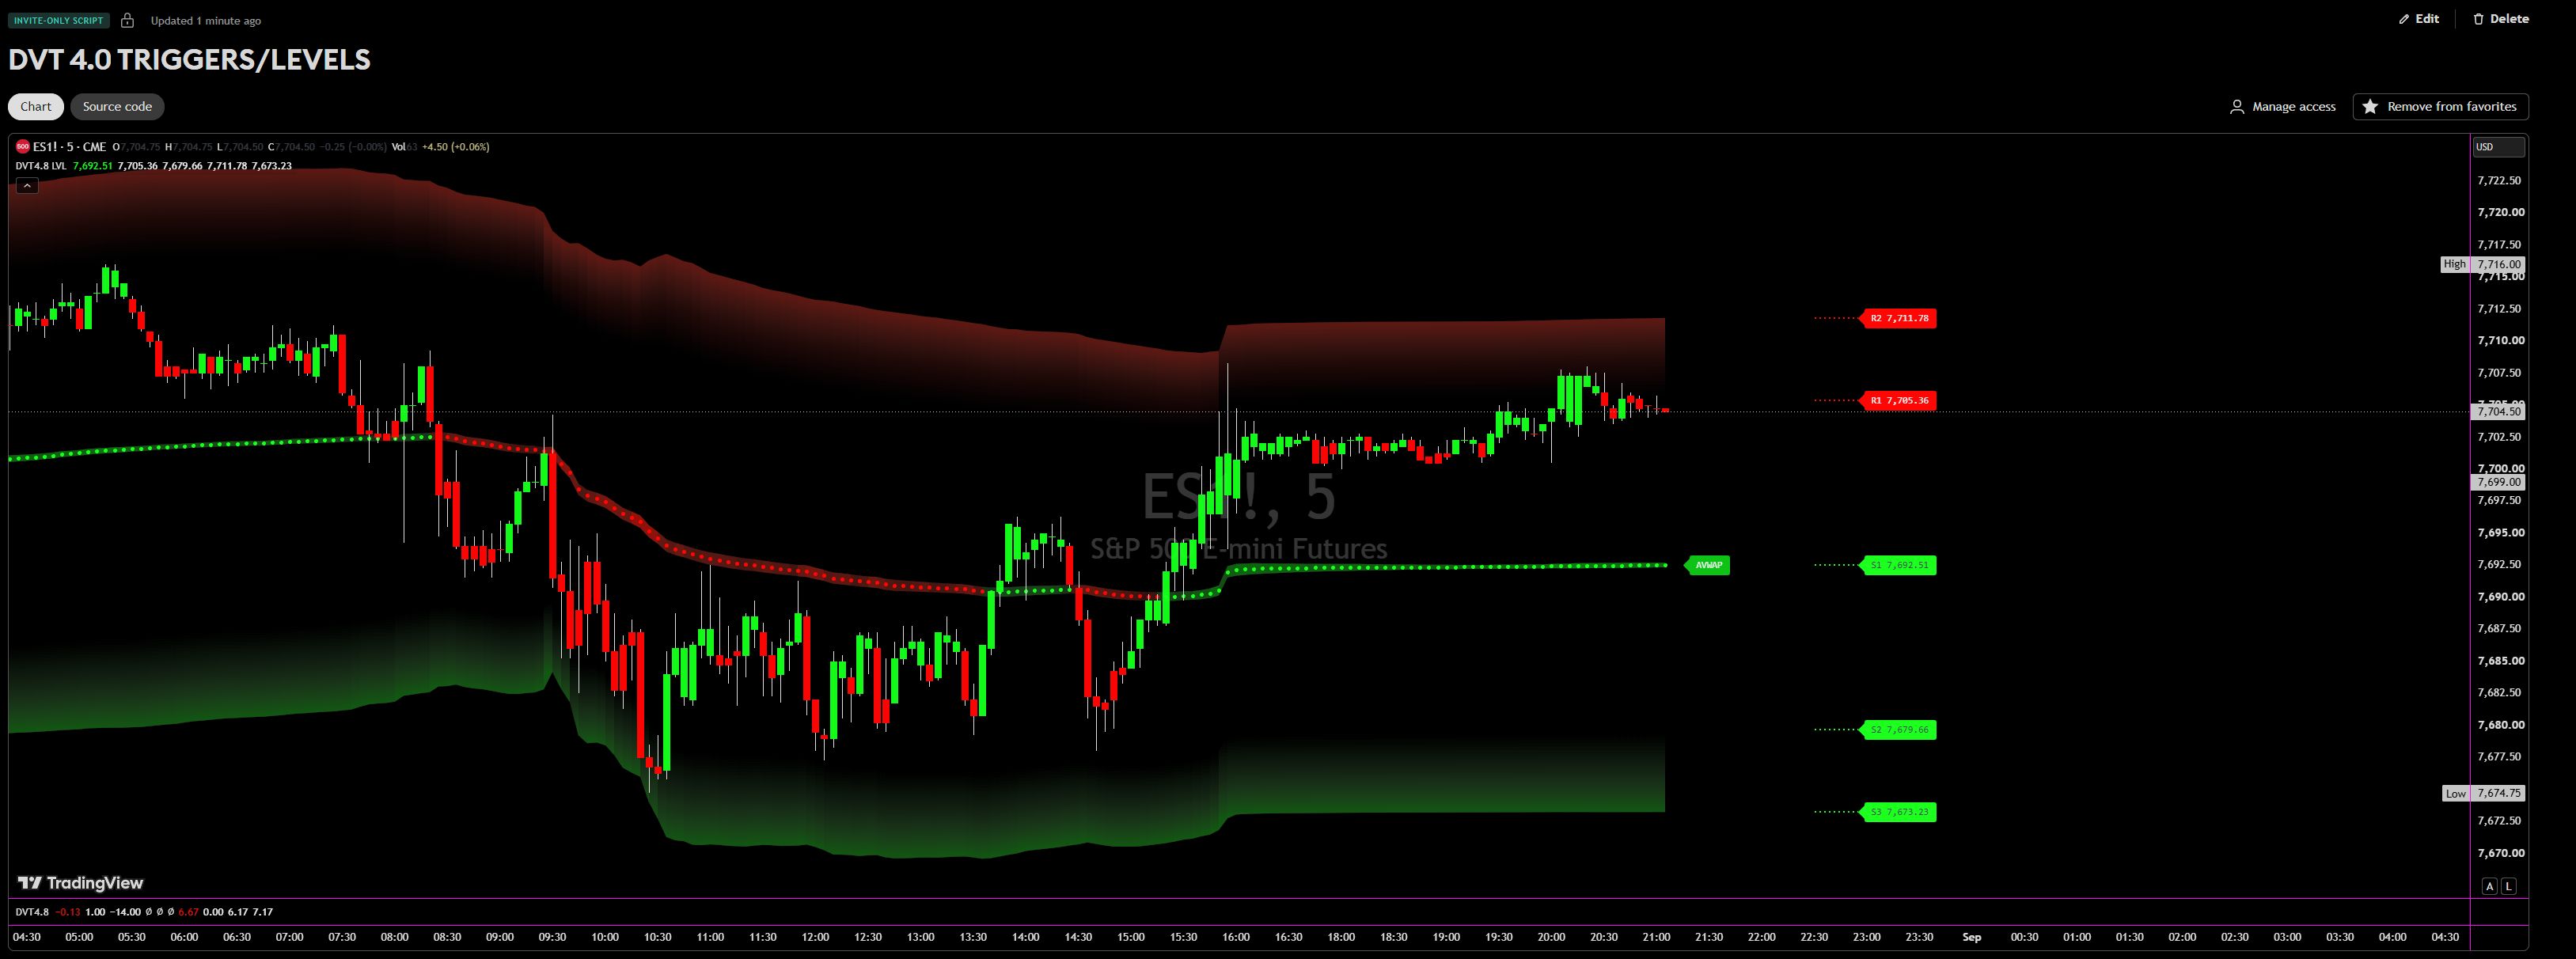
Every enabled level — price action, triggers, OR, pivots, AVWAP bands — enters one ranking engine on every bar:

  • Levels above price are sorted into R1, R2, R3 (nearest first)

  • Levels below price into S1, S2, S3

  • Chips at the right edge show each rank and price; hover reveals which level it actually is (PDH? Weekly 50%? 4H pivot?)

The master rule: a module's levels only rank while its master toggle is on. Turn off HTF pivots and they leave the ranking instantly. What you see is what's ranked.


8. Unified Confluence Levels

When two or more levels land on the same price, that's not clutter — that's confluence. The engine detects any levels sharing a value (to the cent/tick) and merges them:

  • background line (white, 50% transparency) whose thickness equals the number of stacked levels (2–4)

  • front line one step thinner: red above price, green below, amber if the stack contains any 50% retracement

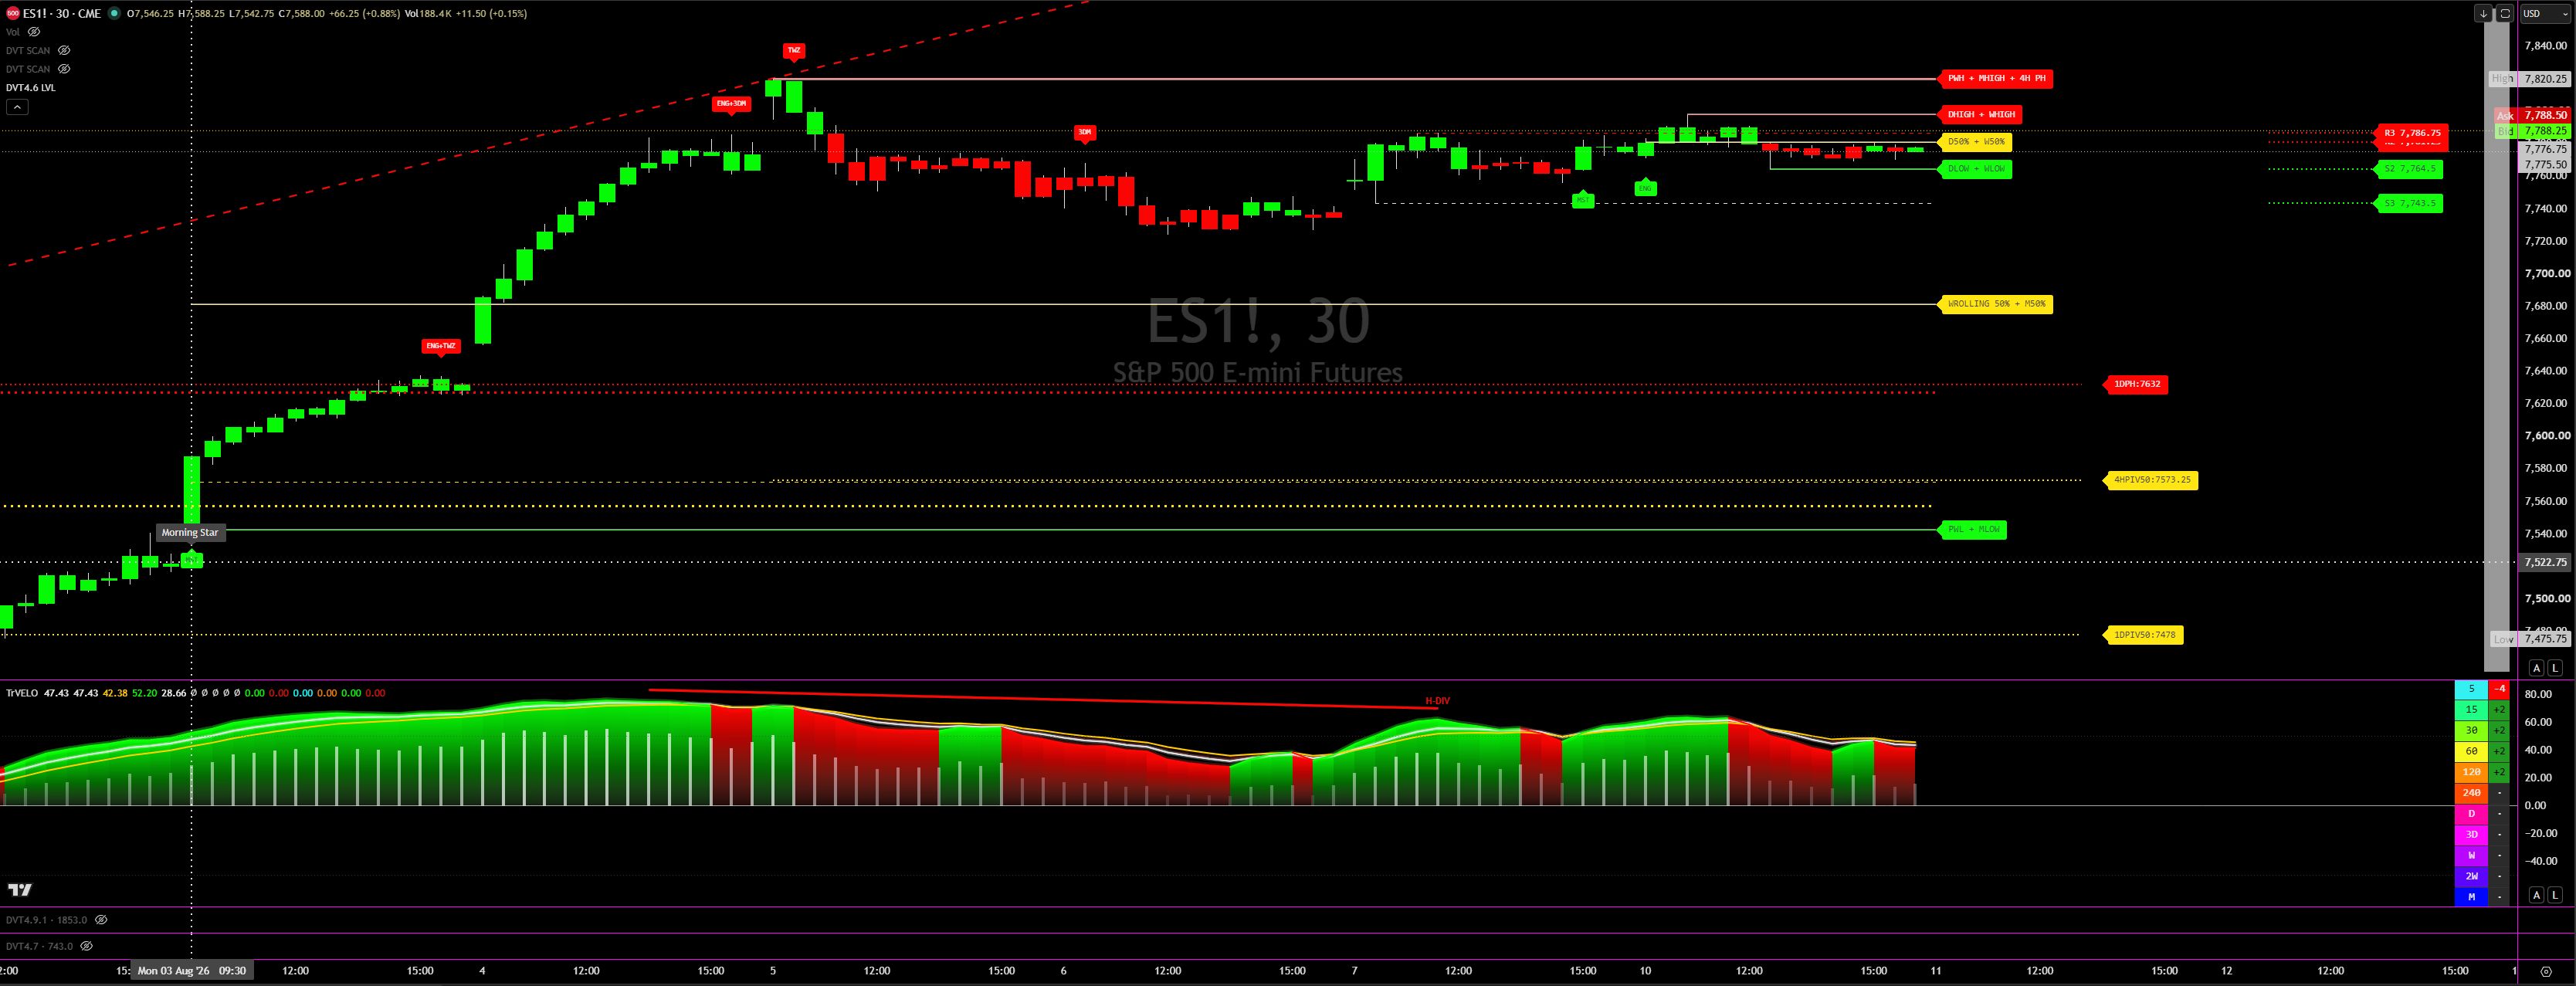
  • One combined chip naming every participant: "DHIGH + PDH + 1H PH"

The thicker the line, the more timeframes agree. Those are the levels that matter.


9. Fast/Slow Trigger Engine + Trend Candles

A configurable two-line momentum engine drives candle coloring:

  • Fast Trigger: MA type (EMA/DEMA/TEMA/HMA/RMA/SMA), source (Close / Heikin-Ashi Close / HA HL2), length. Default: DEMA(1) on HA HL2 — essentially the smoothed price itself.

  • Slow Trigger: same options with a fixed SWMA pre-smooth. Default: RMA(3).

  • Color Bars: candles tint Bullish while Fast > Slow, Bearish while Fast < Slow.

One glance tells you which side of momentum you're on.


10. Candle Pattern Reversal Engine

Classic reversal patterns, detected strictly and filtered hard — because a pattern in the middle of nowhere is noise.

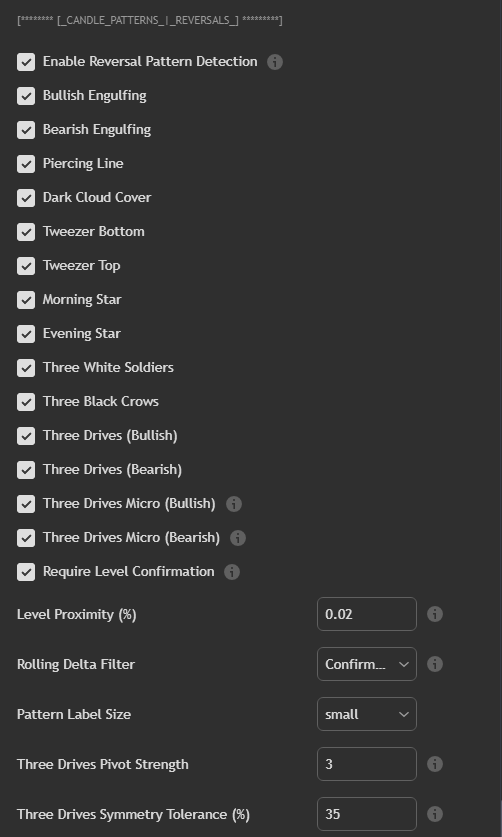
The patterns (each individually toggled)

  • Engulfing (bull/bear) — strict body engulf with a minimum-body significance filter

  • Piercing Line / Dark Cloud Cover — midpoint reclaims of a significant candle

  • Tweezer Bottom / Top — matched extremes within a tenth of an ATR

  • Morning Star / Evening Star — requires a genuinely long first candle

  • Three White Soldiers / Three Black Crows

  • Three Drives — strict harmonic version: three pivot thrusts with configurable price symmetry tolerance

  • Three Drives Micro — the compressed 3-push read: three consecutive higher-highs/lower-lows where the third candle reverses through the prior body midpoint, with a minimum drive span filter

The filter stack (this is where the edge lives)

  • Level Confirmation — pattern must print within your proximity % of a currently-enabled level

  • Pattern Extent option — measure proximity from the pattern's full 3-bar extent, catching strong reversals whose level-touch happened before the final bar

  • Rolling Delta Filter — Off / Confirmation (flow agrees with the reversal) / Divergence (price extreme against opposing flow)

  • Stacked-Only — require 2+ patterns on the same candle

  • Min Signal Body — ATR-scaled significance floor; no doji-on-doji signals

  • Trend Context — a reversal must have a move to reverse; blocks bearish signals mid-downtrend

  • STRAT Confirmation — require a same-direction STRAT combo on the same candle (works even with the STRAT engine's own display off; the chip then names the confirming combo)

Signals

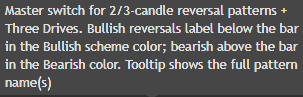
Bullish chips print below the bar in your Bullish color; bearish above in Bearish red. Auto-contrast text, compact codes ("ENG+3DM"), full pattern names on hover. Confirmed-close only — no intrabar repainting. Label count capped with oldest-first cleanup.

Default-enabled patterns reflect the signals that survived our multi-window, multi-symbol validation process; the rest are one click away.


11. The STRAT Engine

Rob Smith's scenario framework, implemented faithfully and independently from the pattern engine.

Candle typing

Every bar is typed by pure price action against the prior bar:

  • 1 — Inside: range held. Consolidation. Energy loading.

  • 2 — Directional: one side broken (2-up / 2-down). The market chose.

  • 3 — Outside: both sides taken. Expansion.

Reversal combos

Chart signals use full 3-bar sequences only: 2-1-2, 1-2-2, 3-2-2, 3-1-2, 1-2-1, 3-2-1, 2-1-1, 3-1-1 — each individually toggled, each detected in both directions. The 2-bar combos (1-2, 2-2, 1-3) serve the HTF alignment scan only.

Timeframe Continuity — built in

The HTF Alignment scan checks 15MIN / 60MIN / 4HR / DAY / WEEKLY for same-direction combos on the current or last bar of each timeframe:

  • Aligned signals gain a +HTF tag; hover shows exactly which timeframes agree ("60m + 4H")

  • Require HTF Alignment lets you gate signals to a minimum number of agreeing timeframes — turn continuity from information into a filter

Independent filters

The STRAT engine carries its own Level Confirmation (with the combo-extent option — a 1-2-2's true low is usually its middle bar) and its own Rolling Delta filter, fully independent of the pattern engine's settings.

Signals mirror the pattern chips: combo name + direction ("1-2-2 Bull +HTF"), full detail on hover, confirmed-close only.


12. Anchored VWAP

  • Anchors: Day, Previous Day, Weekly, Previous Week, Monthly, Previous Month, Quarterly, Previous Quarter — plus Highest/Lowest swing anchors over a configurable lookback

  • Source: Open / High / Low / Close / HL2

  • Trend-Colored Line — Bullish above, Bearish below, drawn as a clean circle-dot line

  • Consensus Glow — a soft halo whose brightness scales with how far price has stretched from VWAP (in σ)

  • Dynamic chip label — trend-colored, deepening in intensity as price extends; anchor, source, and price on hover

  • Three σ-bands with independent multipliers, ranked by effective deviation

  • Band Fills — a gradient ribbon between your two outermost enabled bands (with one band, from the line itself): transparent at the inner edge, solid Bearish above / Bullish below at the outer edge. The reversion zone, painted.

Custom default: Weekly anchor, bands 2+3 as a 1.5σ→2.25σ ribbon with near-invisible band lines — the fill does the talking.


13. Alerts

Eight alert conditions, ready for TradingView's alert engine:

  • Crossed Above Resistance 1 / Crossed Below Support 1

  • AVWAP Cross Up / Down

  • Bullish / Bearish Reversal Pattern (respects every filter you've enabled)

  • STRAT Bullish / Bearish Reversal (respects HTF gate and filters)


14. Trade Idea Templates

Frameworks, not signals. Size and manage per your own plan.

A. The Confluence Fade

Setup: 15MIN or 30MIN template + Add Candle Reversals.

Wait for: a thick Unified Confluence line (3+ stacked levels) above or below price → a reversal chip prints at that line with Level Confirmation on.

Read: multiple timeframes drew the same line; the pattern is your trigger, the confluence is your reason.

Invalidation: a close through the far side of the unified level.

B. Opening Range Reclaim

Setup: 5MIN template + Add Opening Range + Add MTF Triggers.

Wait for: price to break the OR Low, then reclaim OR 50% with rolling delta flipping positive on the heatmap.

Read: the failed breakdown trapped sellers; the OR midpoint is your line in the sand.

Target idea: OR High, then the nearest R-level above it.

C. STRAT Continuity Reversal

Setup: 60MIN template + Add The STRAT (alignment min = 1 or 2).

Wait for: a 1-2-2 or 3-1-2 chip carrying the +HTF tag at a weekly or monthly level.

Read: the chart-timeframe reversal agrees with the higher timeframes — the STRAT's core thesis, automated.

D. AVWAP Ribbon Reversion

Setup: 60MIN template + Add AVWAP (Weekly anchor).

Wait for: price to push into the band fill ribbon while the glow brightens (stretch extreme), then print a reversal chip with Delta Divergence on.

Read: extension from the volume-weighted mean + exhausting flow = reversion candidates back toward the line.

E. Trigger Ladder Trend Day

Setup: any intraday template + Add MTF Triggers.

Read: all ladder triggers stacked below price and candles solid Bullish = trend regime — skip fades, buy pullbacks to the fastest trigger that's been holding, with S-levels as your risk map.


15. Design Principles & Honest Behavior Notes

  • Confirmed-close signals. Both reversal engines evaluate completed candles only.

  • Pivot lag is real. A pivot needs its right-side bars to confirm. The STRAT's HTF alignment reads the developing higher-timeframe bar by design — responsive, but a forming bar can change type before it closes.

  • Independence. Every module has its own master switch; toggling one never alters another's calculations. Levels only rank in S/R while their master is on.

  • Resource-safe. Label counts are capped with oldest-first cleanup; heavy data requests only run while their features are enabled; Bar Replay users should switch Delta Source to Range Proxy.

  • Defaults are researched. The enabled-by-default signals and filter stacks reflect an extensive internal evaluation process across multiple symbols, timeframes, and market regimes — and everything remains fully configurable.


Nothing here is financial advice. Markets carry risk; past behavior of any signal does not guarantee future results. Trade your own plan.
file_9yfwucHem9GXa
Profile picture
DVTrendz 4.5 Trading SuiteProfile picture@doomtardetrades·Aug 12

🕯️ CANDLE PATTERN REVERSAL ENGINE

Now inside DVT 4.6 — Triggers & Levels

11 classic reversal patterns + Three Drives — but here's the difference:

Patterns only fire AT YOUR LEVELS, confirmed by ORDER FLOW.

Pattern + Location + Delta = signal.

Everything else = noise. 🎯

Profile picture
DVTrendz 4.5 Trading SuiteProfile picture@doomtardetrades·Aug 11

CANDLE PATTERN REVERSAL ENGINE
Now inside DVT 4.6 — Triggers & Levels

THE PATTERNS
• Engulfing — bullish & bearish
• Piercing Line / Dark Cloud Cover
• Tweezer Tops & Bottoms
• Morning Star / Evening Star
• Three White Soldiers / Three Black Crows
• Three Drives — strict harmonic (swing symmetry) AND micro (3-push wick probes)
• Every pattern individually toggled on/off

CONFLUENCE FILTERS
Patterns alone are noise. Location is edge.
Level Confirmation — only signal at or near your active levels: day/week/month highs & lows, 50% retracements, Opening Range, HTF pivots, AVWAP bands
Order Flow Filter — require Cumulative Delta agreement (buyers into support, sellers into resistance) or delta divergence at the extreme
• Stack all three: pattern + level + flow

CLEAN SIGNALS
• Bearish reversals print above the bar in red
• Bullish reversals print below the bar in green
• Auto-contrast text, compact codes, full pattern name on hover
• Confirmed-close signals only — no intrabar repainting
• Built-in alerts for both directions

A hammer in the middle of nowhere is noise.
A hammer at the weekly 50% with buyers stepping in? That's a trade.

file_ghha07G5KtOsw
file_iBhZSG0iCdAA2
file_RPcPtGopnvpk6
Profile picture
DVTrendz 4.5 Trading SuiteProfile picture@doomtardetrades·Aug 11

Big Updates and Releases coming in the next Day or Two.

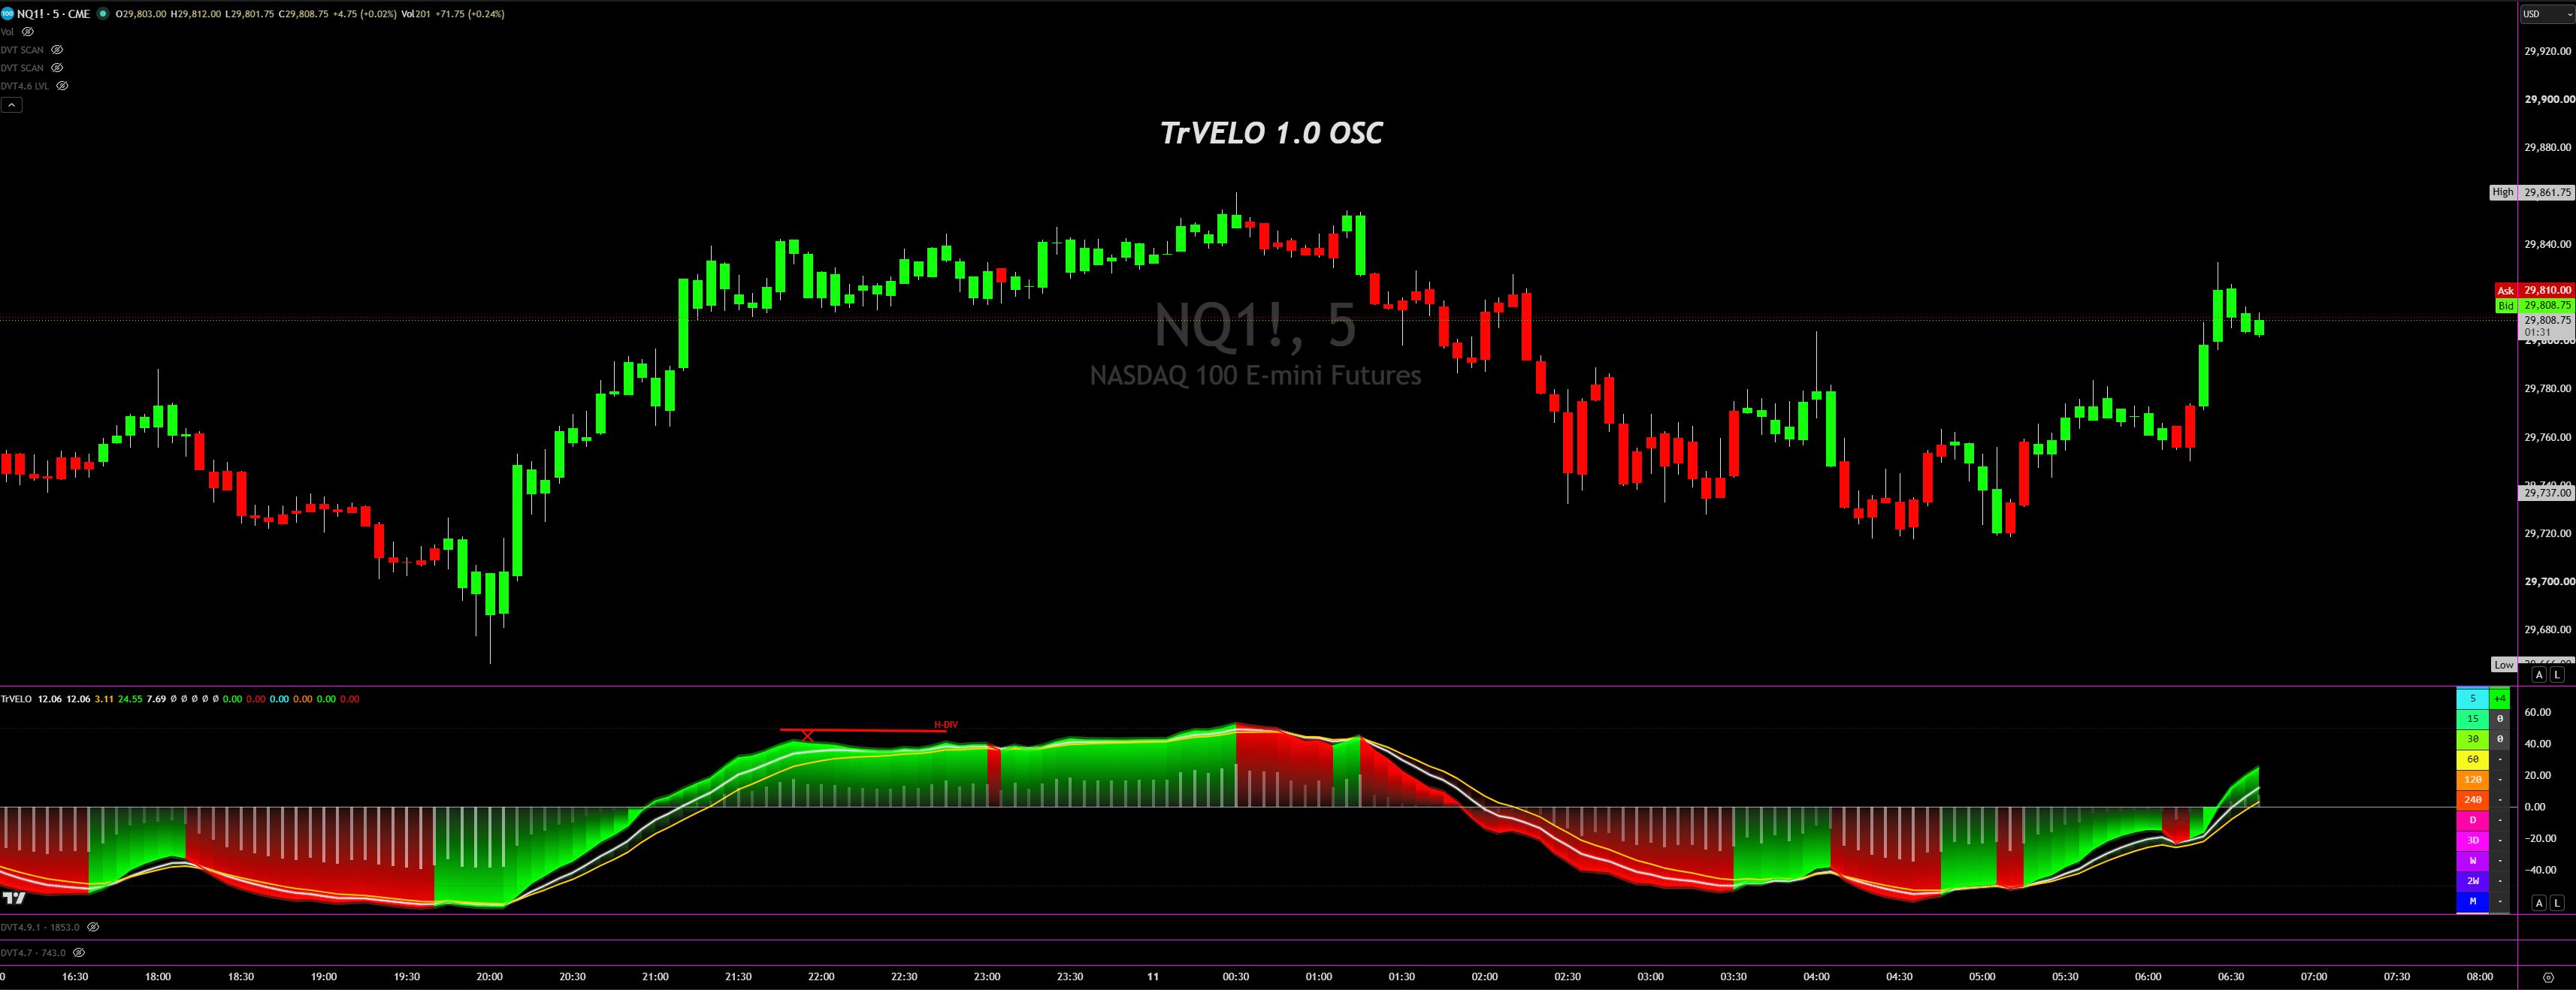
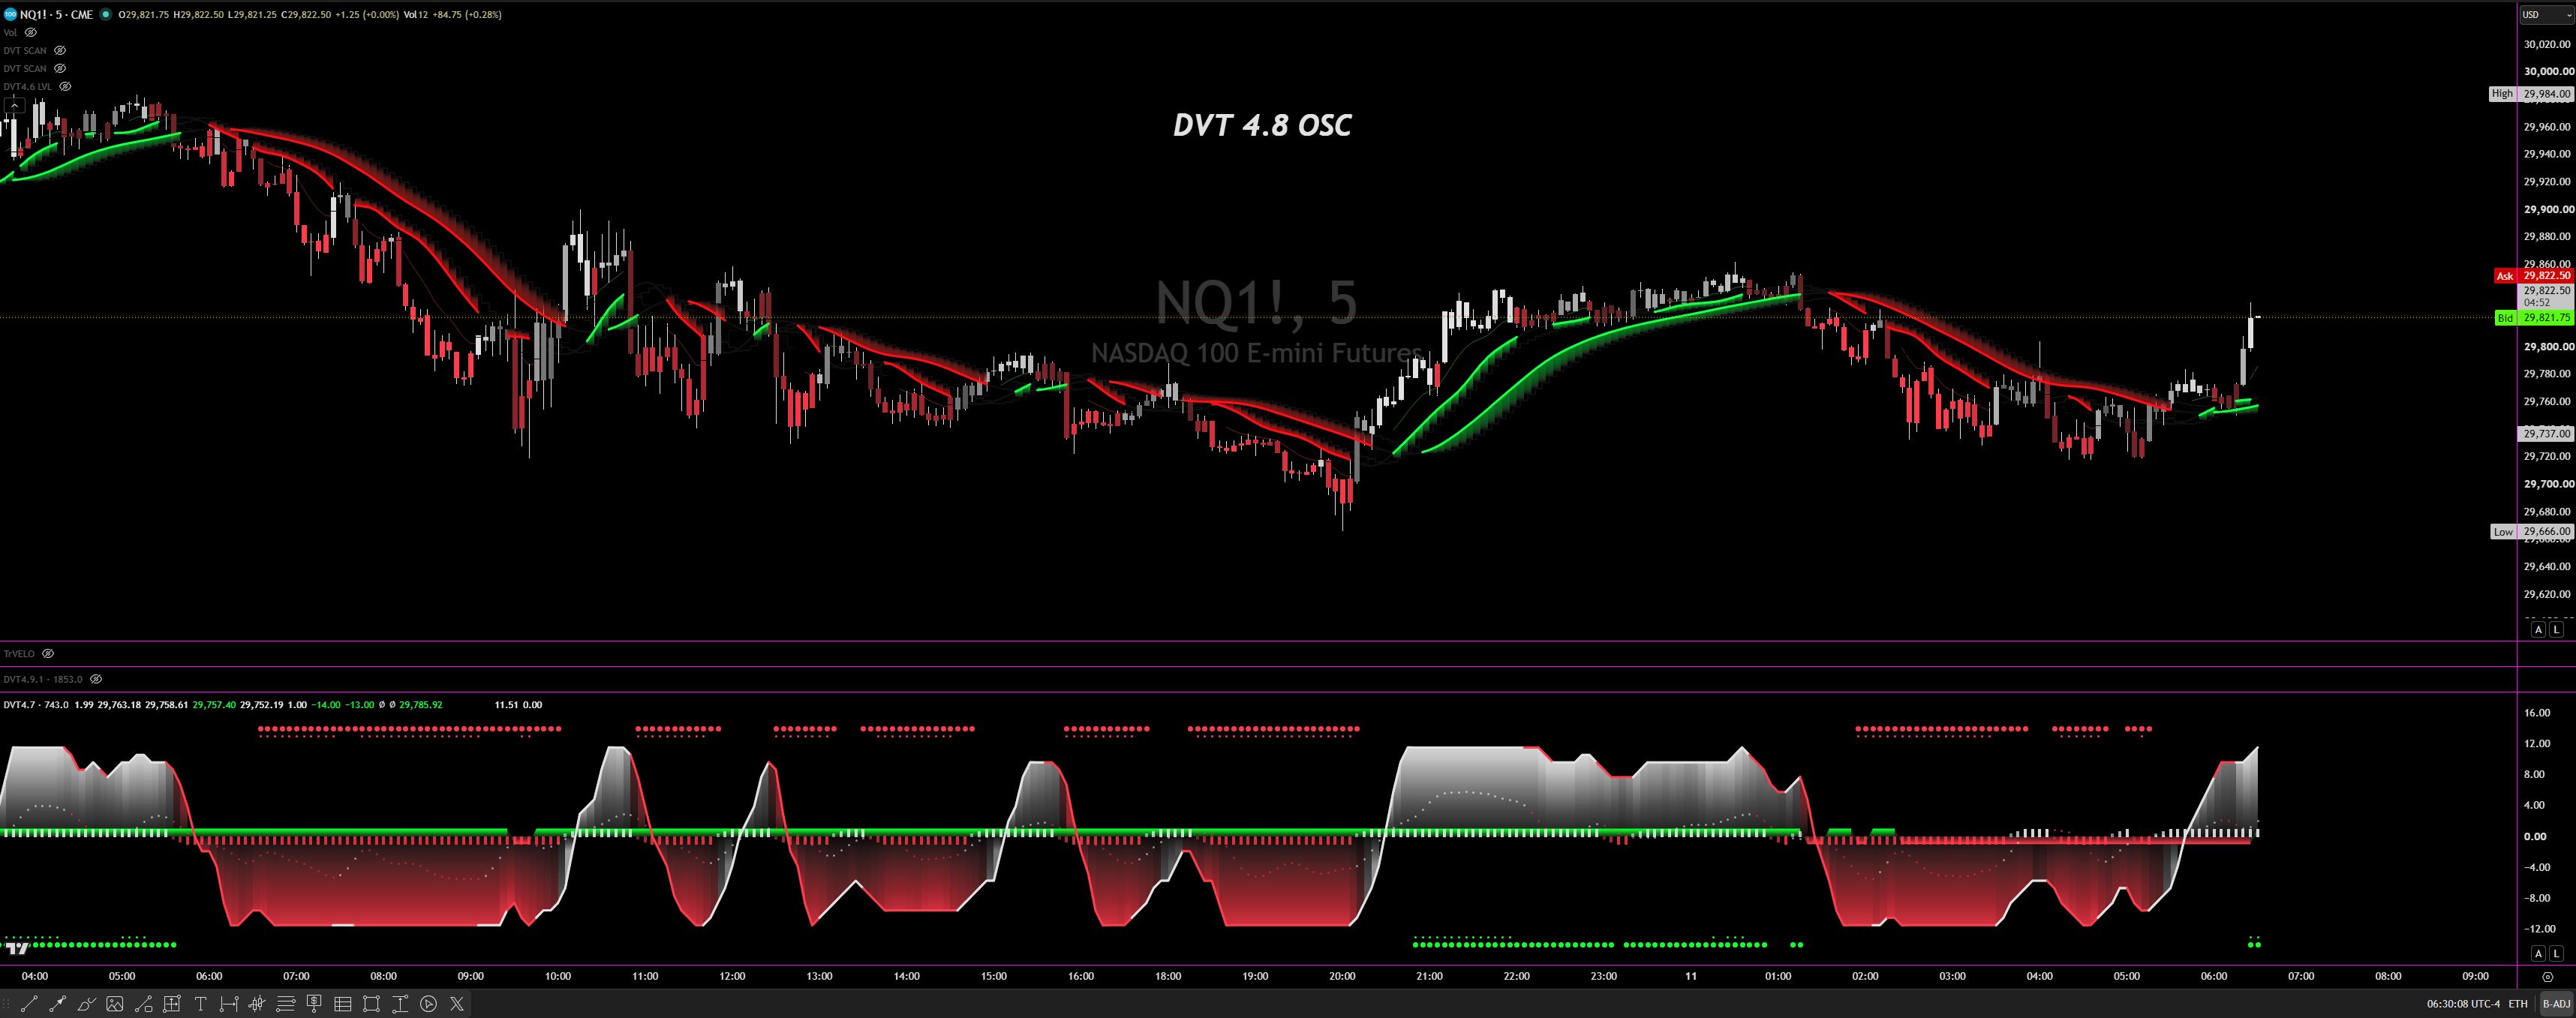
TrVELO 1.0 (Release)
DVT 4.8 OSC (Update)
DVT $.6 LVL (Update)

file_DwvPX3fw4D1oV
file_vuCALwl2FJTzm
file_oOIr4uRUYoiZJ
Profile picture
DVTrendz 4.5 Trading SuiteProfile picture@doomtardetrades·May 2

DVT 4.6

No FURU required

Profile picture
DVTrendz 4.5 Trading SuiteProfile picture@doomtardetrades·Apr 17

Class Dismissed 💲💲

file_ASDCRN30D8Z2r
Profile picture
DVTrendz 4.5 Trading SuiteProfile picture@doomtardetrades·Apr 15

# DVT 4.5 SCANNER — Complete User Manual

By TheTriggerMan

---

# Chapter 1: Overview

What is the DVT 4.5 Scanner?

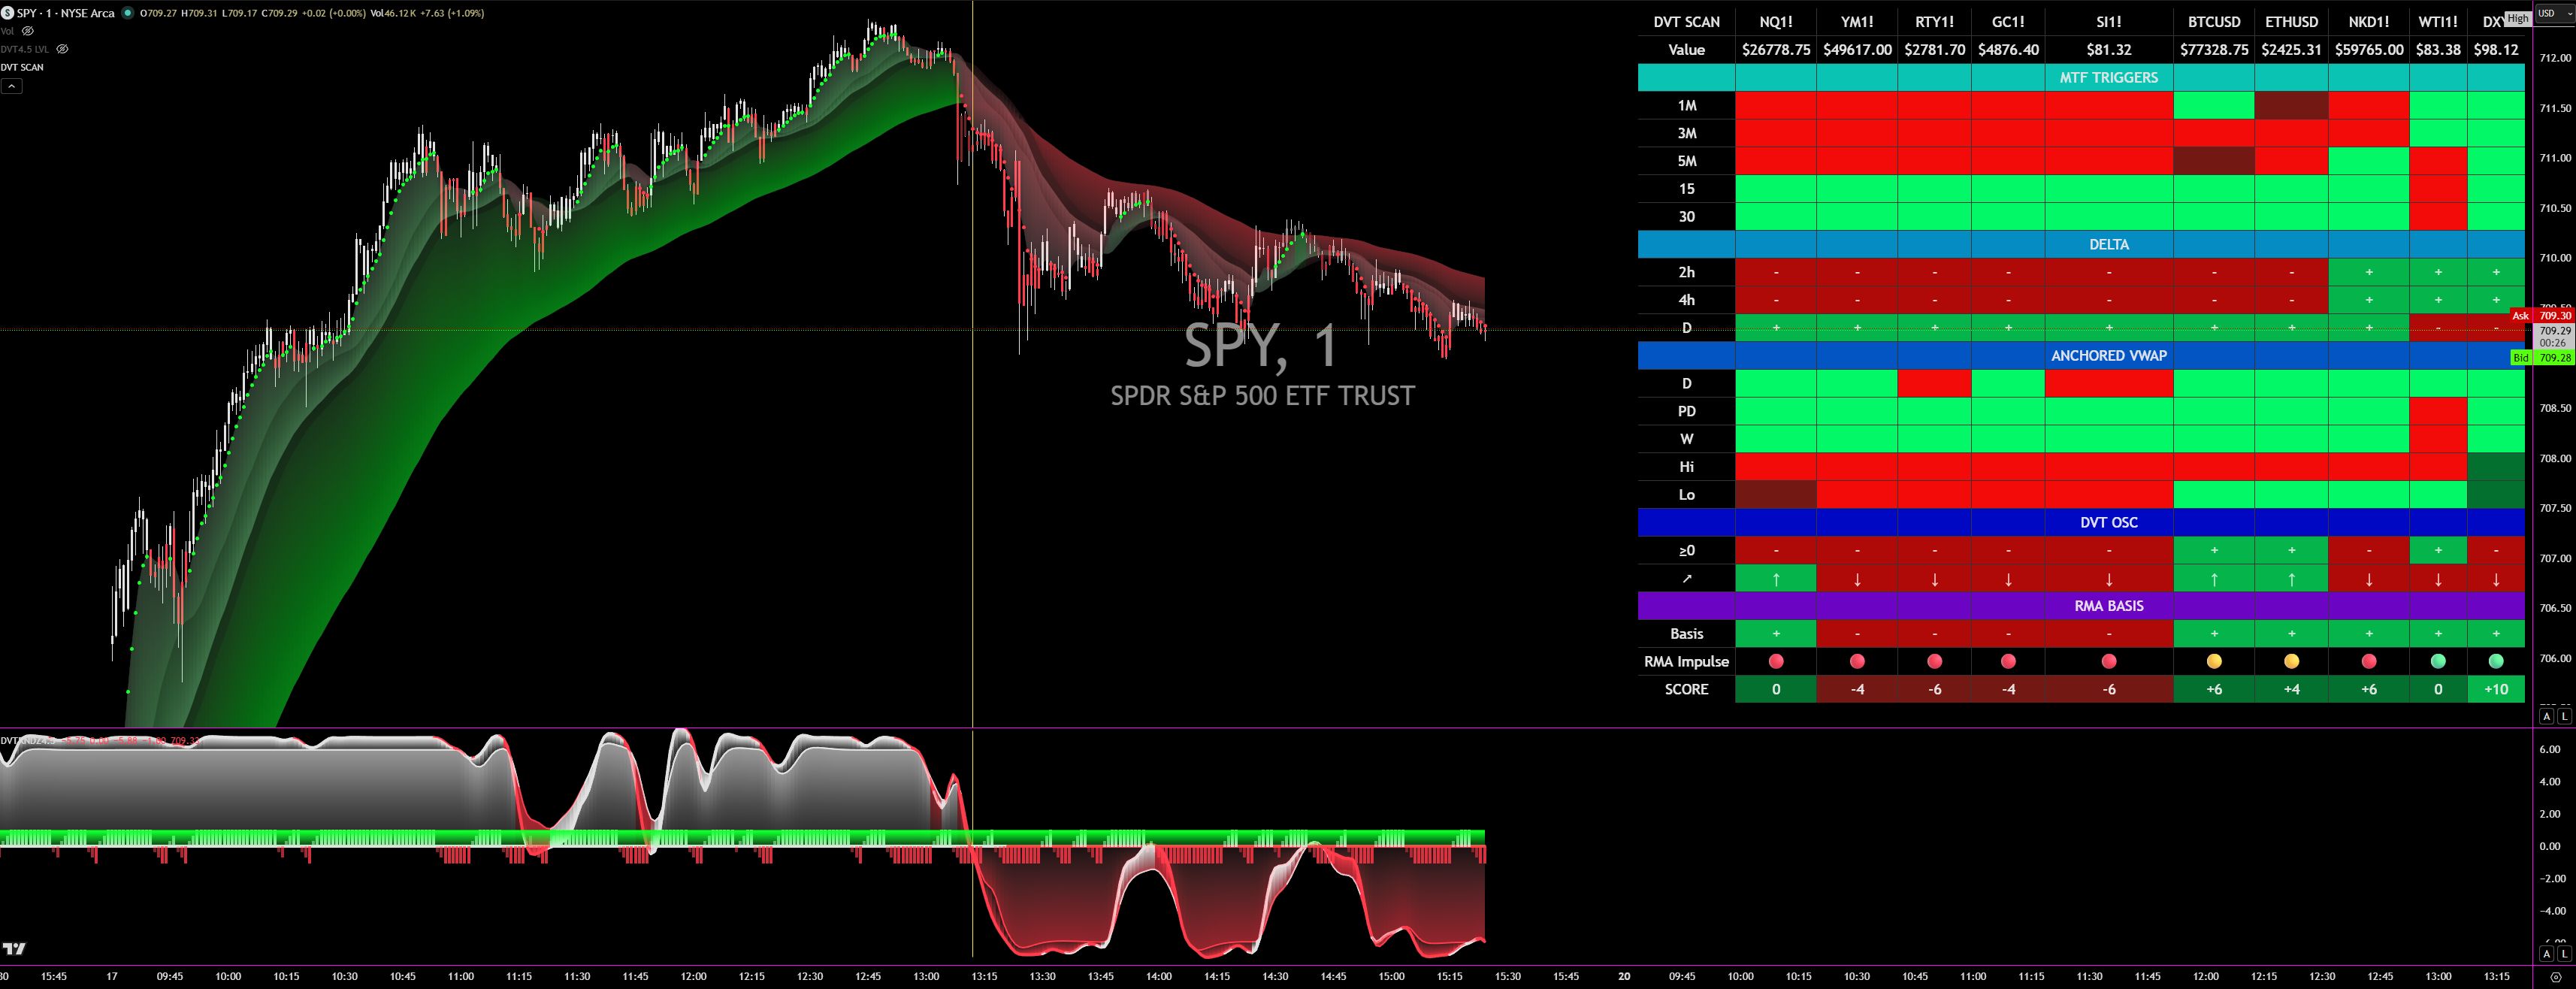
The DVT 4.5 Scanner is a professional-grade multi-symbol heatmap indicator for TradingView that consolidates the most important metrics from DVT 4.5 TRIGGERS/LEVELS and Deviation Trendz 4.5 into a single unified scanning table. Where most scanning tools force you to cycle through symbols one at a time, the DVT Scanner displays the complete momentum, volume, and positioning picture for up to 10 symbols simultaneously — on any chart.

This is not a signal generator that tells you when to buy or sell. The DVT Scanner is a dashboard — a real-time structural map of where ten different instruments stand relative to every critical DVT metric. It gives you the breadth context to identify which symbols are aligned with your strategy, which ones are diverging, and which ones deserve closer attention — all at a glance.

What the Scanner Measures

The scanner aggregates 31 individual metrics per symbol across five categories:

- 13 MTF Momentum Triggers (1M through Monthly)

- 5 Cumulative Delta anchors (2H, 4H, Daily, Weekly, Monthly)

- 10 Anchored VWAPs (Day, Prev Day, Weekly, Prev Week, Monthly, Prev Month, Quarterly, Prev Quarter, Highest, Lowest)

- 2 DVT Oscillator states (Above/Below Zero, Slope Direction)

- 1 RMA Basis state (chart-TF trend)

Plus two synthesized signals:

- RMA Impulse — the DVT 4.5 OSC bull_signal1/bear_signal1 logic

- Composite Score — weighted aggregate of all enabled metrics (range: -31 to +31)

What Separates the DVT Scanner From Everything Else

One scanner, ten symbols, thirty-one metrics: Most TradingView scanners show basic price action or a single indicator's output. The DVT Scanner fuses momentum, volume, and positioning data from five timeframe families into one cohesive view — and does it for ten symbols at once.

True multi-timeframe MTF Triggers: Thirteen proprietary momentum triggers spanning from 1-minute to Monthly, scaled using the DVT 4.5 RMA formulation to give you trend alignment across every meaningful timeframe — computed per symbol, not just the chart symbol.

Cross-symbol Cumulative Delta comparison: See which symbols are experiencing net buying vs net selling pressure across five anchor periods — side by side. This reveals which names are attracting institutional flow and which are being distributed.

Ten Anchored VWAPs per symbol: Every major institutional VWAP anchor — Day, Week, Month, Quarter (plus their Previous variants), and Highest/Lowest lookback anchors — shown as above/below positioning for all ten symbols simultaneously.

DVT Oscillator at a glance: The full DVT scoring engine (VWAP trend, Fast/Slow Fib triggers, RMA lines, conviction scaling) rendered as a simple Above-Below-Zero + Slope pair of cells per symbol.

RMA Impulse signals: The same bull_signal1/bear_signal1 logic from the DVT 4.5 Oscillator, ported directly. Green dot = bullish impulse with no bearish filter. Red dot = bearish impulse with no bullish filter. Yellow dot = neutral/transitional.

Composite Scoring: Every enabled metric contributes +1 (bullish) or -1 (bearish) to a composite score. At a glance, see which symbols have the strongest alignment. A +25 score means 25 more bullish signals than bearish across the entire DVT framework.

Four-Tier Heatmap Colors: Cells are color-coded with four strength levels (Very Strong, Strong, Weak, Neutral) based on the alignment of price position and directional slope — giving you a nuanced read on conviction, not just binary bull/bear.

---

# Chapter 2: Table Layout

The Transposed Heatmap

The scanner uses a transposed layout optimized for multi-symbol comparison:

- Rows represent metrics (each DVT indicator type gets its own row)

- Columns represent symbols (your 10 configured tickers across the top)

- Intersection cells show the state of that metric for that symbol (colored green or red with four strength tiers)

This makes horizontal scanning intuitive — pick any symbol column and read down to see its full metric profile, or pick any metric row and read across to see which symbols are aligned with that signal.

Table Structure (Top to Bottom)

Row 0: Title + Symbols

The top-left cell shows "DVT SCAN" as the table title. The remaining ten cells across show your configured symbol tickers (e.g., SPY, QQQ, AAPL, MSFT, NVDA, AMZN, TSLA, META, GOOG, AMD). Background matches the chart background color.

Row 1: Value Row

Displays the current close price for each symbol formatted as $X.XX (always two decimals). This gives you at-a-glance price context alongside the metric heatmap. Background matches the chart background color.

Section Headers

Each metric category has a colored section header row that spans the full table width with the section title centered. Section headers are visually merged via matching background color:

- MTF TRIGGERS (teal)

- DELTA (light blue)

- ANCHORED VWAP (blue)

- DVT OSC (dark blue)

- RMA BASIS (purple)

Metric Rows

Below each section header, individual metric rows display the actual data. Metric labels (left column) have the chart background color; the ten symbol cells show the heatmap values.

RMA Impulse Row

Sits just above the Score row. Shows emoji indicators (🟢 / 🔴 / 🟡) with the chart background color — unambiguous visual signals for bull impulse, bear impulse, or neutral state.

Score Row

The bottom row displays the Composite Score per symbol — a signed integer with color intensity proportional to magnitude. This is the "headline" readout: +25 means the symbol is strongly bullish across all metrics; -15 means moderately bearish.

---

# Chapter 3: MTF Momentum Triggers

The Foundation of Directional Bias

Thirteen multi-timeframe momentum triggers form the structural backbone of the scanner. Each trigger is an RMA-smoothed momentum line calculated on a specific timeframe, then tested against each symbol's close price to determine if price is above (bullish) or below (bearish).

| Trigger | Label | Base Length | Default |

|---------|-------|-------------|---------|

| 1 Minute | 1M | 30 | Off |

| 3 Minute | 3M | 30 | Off |

| 5 Minute | 5M | 30 | Off |

| 15 Minute | 15 | 30 | On |

| 30 Minute | 30 | 30 | Off |

| 60 Minute | 1H | 30 | On |

| 120 Minute | 2H | 30 | On |

| 240 Minute | 4H | 30 | Off |

| Daily | D | 30 | Off |

| 3-Day | 3D | 25 | On |

| Weekly | W | 25 | On |

| 2-Week | 2W | 25 | On |

| Monthly | M | 20 | On |

Four-Tier Cell Colors

Each MTF Trigger cell is colored using a four-tier system based on the alignment of price position and trigger slope:

- Very Strong Bull (bright green): Price above trigger AND trigger rising

- Strong Bull (medium green): Price above trigger with strong alignment

- Weak Bull (dim green): Price above trigger BUT trigger falling (weakening)

- Neutral/Very Weak (faded): Transitional or flat conditions

Mirror logic applies to the bearish side (Very Strong Bear, Strong Bear, Weak Bear, Neutral).

A full column of Very Strong Bull cells represents momentum stacking — the strongest directional alignment the system can show. Mixed bright/dim cells indicate a trend in transition.

How Traders Use the MTF Section

Vertical Alignment Reading: Pick a symbol column. Read top-to-bottom through all 13 trigger rows. If they're all green with bright shading, momentum is aligned from ultra-short-term (1M) through macro (Monthly). If the lower TFs are green but upper TFs red, the symbol is bouncing inside a larger downtrend.

Horizontal Divergence Reading: Pick a specific trigger (e.g., the Daily row). Read across all ten symbol columns. Symbols glowing bright green are leading the market; symbols red stand out as laggards or short candidates.

Confluence Zones: When 9+ triggers out of 13 show the same color, you have high-conviction directional alignment. Look for this across multiple symbols for broad market regime reads.

User Options

- Master Toggle enables/disables the entire MTF Triggers section

- 13 Individual Toggles — enable only the timeframes relevant to your strategy

- Disabled triggers don't appear in the table AND don't count toward the Composite Score

---

# Chapter 4: Cumulative Delta

Order Flow Across Five Anchor Periods

Cumulative Delta measures the net buying versus selling pressure using a simplified tick-based volume model (up-ticks count as buying volume, down-ticks as selling volume). The difference is accumulated and reset at anchor intervals.

Available Anchors

| Anchor | Label | Reset Interval | Default |

|--------|-------|----------------|---------|

| 2-Hour | 2h | Every 2 hours | On |

| 4-Hour | 4h | Every 4 hours | On |

| Daily | D | Start of each day | On |

| Weekly | W | Start of each week | On |

| Monthly | M | Start of each month | On |

Cell Display

Delta cells show a simple + or - character:

- + (green background): Cumulative delta is positive (net buying since anchor reset)

- - (red background): Cumulative delta is negative (net selling since anchor reset)

Delta cells use the Strong tier (medium transparency) since delta is a binary B/S indicator without a slope component.

How Traders Use the DELTA Section

Session Bias Confirmation: The Daily Delta row reveals which symbols had net buying or selling pressure during the current trading session. Symbols with + on Daily Delta + bullish triggers are attracting intraday institutional flow.

Multi-Period Divergence: Compare 2H/4H against Daily and Weekly. A symbol with - on 2h and 4h but + on Daily and Weekly suggests short-term selling into a larger accumulation pattern — potentially a buyable pullback.

Macro Flow Direction: The Monthly Delta row is slow-moving and changes rarely. When it flips from + to - (or vice versa) on multiple symbols simultaneously, you're likely witnessing a regime shift.

Price-Delta Divergence Hunting: Look for symbols where price is rising but Daily Delta shows - — classic distribution signal. Or price falling with Daily Delta + — accumulation signal.

User Options

- Master Toggle enables/disables the entire Delta section

- 5 Individual Anchor Toggles — enable only the delta periods you care about

---

# Chapter 5: Anchored VWAP

Ten Institutional VWAP Anchors

Anchored VWAP is the most-watched institutional benchmark in modern trading. The scanner plots ten distinct AVWAP anchors per symbol, testing price position against each:

| Label | Full Name | Anchor |

|-------|-----------|--------|

| D | Daily AVWAP | Today's open |

| PD | Previous Day AVWAP | Yesterday's open + today |

| W | Weekly AVWAP | This week's open |

| PW | Previous Week AVWAP | Last week's open + this week |

| M | Monthly AVWAP | This month's open |

| PM | Previous Month AVWAP | Last month's open + this month |

| Q | Quarterly AVWAP | Current quarter's open |

| PQ | Previous Quarter AVWAP | Last quarter's open + current |

| Hi | Highest AVWAP | Highest high over lookback |

| Lo | Lowest AVWAP | Lowest low over lookback |

The "Previous" Variants

Previous Day, Week, Month, and Quarter AVWAPs include both the prior period's data AND the current period's data. This creates a broader VWAP that spans two full periods, giving you context for whether the current period is diverging from the trend established by the previous one.

The Highest/Lowest AVWAPs

These anchor from the bar where the highest high (or lowest low) occurred within a user-configurable lookback window (default 100 bars). They automatically re-anchor whenever a new high or low is made. Useful for:

- Highest AVWAP: Gauging whether price has reclaimed a recent significant peak

- Lowest AVWAP: Gauging whether price has recovered from a recent significant trough

Four-Tier Cell Colors

AVWAP cells use the same four-tier color system as MTF Triggers:

- Very Strong Bull: Price above AVWAP AND AVWAP rising

- Strong Bull: Price above AVWAP with consistent alignment

- Weak Bull: Price above AVWAP BUT AVWAP falling

- Neutral: Transitional conditions

Mirror logic applies for bearish states.

How Traders Use the AVWAP Section

Multi-Timeframe VWAP Stack: A symbol with all ten AVWAP cells bright green has full institutional alignment — price is holding above every major VWAP anchor and every VWAP is rising. This is the strongest positioning signal the scanner shows.

Reversion Setups: Look for symbols where price is just below the Daily or Weekly AVWAP but above all the higher-TF AVWAPs. These often revert back toward the lower AVWAPs as institutional players defend key levels.

Breakdown Confirmations: When a symbol flips from above to below its Monthly or Quarterly AVWAP, that's a macro-level position shift. Combined with other DVT metrics turning red, it's a strong macro short signal.

Highest/Lowest as Extremes: When a symbol shows Hi as Very Strong Bull (price above the highest AVWAP), it's in clear breakout territory. Conversely, Lo as Very Strong Bear indicates breakdown territory.

User Options

- Master Toggle enables/disables the entire AVWAP section

- 10 Individual AVWAP Toggles — enable only the anchors you use

- Highest/Lowest Lookback: Adjustable from 10 to 500 bars (default 100)

---

# Chapter 6: DVT Oscillator

The Full DVT Scoring Engine

The DVT Oscillator is the proprietary scoring system from the Deviation Trendz 4.5 indicator, ported directly into the scanner. It synthesizes six different metric families into a single scalar value that oscillates around zero:

- VWAP trend direction (fast and slow components)

- Fast Fib Trigger trend (fastTRIGGER vs fastTRIGGERMEAN)

- Slow Fib Trigger trend (slowTRIGGER vs slowTRIGGERMEAN)

- RMA Basis, Fast, Slow cascade alignment

- Conviction factor (ATR-scaled separation between components)

- Cross-component trend relationships (RMA vs VWAP, VWAP vs Fast Trigger, etc.)

The final output trendzero value is above zero when the aggregate bullish weights exceed bearish weights (and vice versa).

The Two DVT OSC Cells

The scanner displays two cells per symbol under the DVT OSC section:

≥0 Cell

Shows + when the oscillator is above zero (bullish regime) or - when below zero (bearish regime). Background color follows the bull/bear state at Strong tier.

↗ (Slope) Cell

Shows when the oscillator is rising (momentum building) or when falling (momentum fading). Background color follows rising/falling at Strong tier.

Reading the Two Cells Together

| ≥0 | ↗ | Interpretation |

|----|----|----------------|

| + | | Bull regime with building momentum — strongest bull reading |

| + | | Bull regime but losing momentum — look for pullback |

| - | | Bear regime but recovering — potential bottom forming |

| - | | Bear regime with accelerating momentum — strongest bear reading |

How Traders Use the DVT OSC Section

Regime Identification: The ≥0 row tells you which symbols are in bull regimes vs bear regimes. Combined with the Composite Score, this gives you the macro/micro alignment story instantly.

Early Reversals: The row catches momentum shifts before the ≥0 row does. A symbol with - ≥0 but slope is showing early signs of a bottom — price may still be below zero but the oscillator is turning up.

Exhaustion Reading: A symbol with + ≥0 but slope is in a bull regime that's losing steam. If combined with price at a key AVWAP resistance or trigger cluster, it's a warning for longs.

User Options

- Master Toggle enables/disables the entire DVT OSC section

- Above/Below Zero Toggle — show/hide the ≥0 cell

- Slope Direction Toggle — show/hide the cell

---

# Chapter 7: RMA Basis

What RMA Basis Shows

The RMA Basis row displays the short-term directional trend for each symbol based on the relationship between the DVT rmaBasis line and its smoothed mean. This provides a quick read on whether a symbol's micro-structure is leaning bullish or bearish.

- Bullish +, green): rmaBasis is above its smoothed mean — short-term trend is up

- Bearish -, red): rmaBasis is below its smoothed mean — short-term trend is down

How to Use the RMA Basis Row

Confirmation Signal: The RMA Basis row confirms whether a symbol's micro-structure agrees with its macro setup. A symbol with full bullish MTF Triggers + bullish AVWAPs + bullish DVT OSC + bullish RMA Basis has complete alignment across all DVT subsystems.

Early Divergence Warning: RMA Basis often flips before the main DVT OSC does because it operates on a faster component of the DVT cascade. A symbol with bullish OSC but bearish RMA Basis may be in the early stages of a momentum shift.

User Options

- Master Toggle enables/disables the entire RMA Basis section

---

# Chapter 8: RMA Impulse

The DVT 4.5 OSC Signal Engine

The RMA Impulse row displays the exact bull_signal1 / bear_signal1 logic from the DVT 4.5 OSC indicator, ported directly. This is the signal system that traders use to identify high-conviction momentum impulses.

The Signal Logic

```

bull_imp = rmaSLOW >= rmaBASISOG AND rmaSLOW rising

bear_imp = rmaSLOW < rmaBASISOG AND rmaSLOW falling

bull_Filt = vwapTRENDEMA >= fastTRIGGER AND fastTRIGGERMEAN rising

bear_Filt = vwapTRENDEMA < fastTRIGGER AND fastTRIGGERMEAN falling

bull_signal1 = bull_imp AND NOT bear_Filt

bear_signal1 = bear_imp AND NOT bull_Filt

```

Translation: A bullish impulse fires when the RMA Slow line is rising above the RMA Basis AND the bearish filter conditions are NOT active. Same logic inverted for the bearish impulse.

The Three Signal States

The RMA Impulse row uses three distinct emoji indicators on a chart-background-colored cell:

| Emoji | Signal | Meaning |

|-------|--------|---------|

| 🟢 | bull_signal1 true | Bull impulse active, no bearish filter blocking |

| 🔴 | bear_signal1 true | Bear impulse active, no bullish filter blocking |

| 🟡 | Neither signal | Transitional / neutral / conditions not aligned |

How Traders Use the RMA Impulse Row

Conviction Filter: When the RMA Impulse shows 🟢 AND the Composite Score is strongly positive AND most MTF Triggers are green — you have maximum bullish conviction. Same inverse for bearish.

Neutral Avoidance: 🟡 cells warn that the symbol is in a transitional state. The impulse system is not firing a clear signal. This is often a chop/consolidation zone — not prime trading territory.

Cross-Symbol Scanning: Glance across the RMA Impulse row to instantly identify which symbols have active impulse signals. Those are your "trade candidates" for the session.

Impulse Alignment with Triggers: When RMA Impulse is 🟢 but most MTF Triggers are red, there's internal divergence — a potential short-term bounce inside a downtrend. When both align (🟢 + green triggers, or 🔴 + red triggers), the setup has the highest conviction.

User Options

- Master Toggle enables/disables the entire RMA Impulse row

---

# Chapter 9: Composite Score

The Headline Number

The Composite Score is the single most important readout in the scanner. It aggregates every enabled metric into a signed integer that summarizes the overall bullish-vs-bearish alignment for each symbol.

The Math

Every enabled metric contributes:

- +1 if bullish (price above trigger, delta positive, price above AVWAP, oscillator above zero, rmaBasis bullish, etc.)

- -1 if bearish (the inverse)

Metrics that are toggled OFF do not contribute. This means the Composite Score reflects only the metrics you've enabled in the display — making it a true "what I'm actually watching" score.

Score Ranges

With all 31 default metrics enabled:

- Maximum possible: +31 (every single metric bullish)

- Minimum possible: -31 (every single metric bearish)

- Zero: Perfectly balanced

Four-Tier Color Strength (Magnitude-Based)

The Score cell uses magnitude-based color tiering across four strength levels:

| Score Range | Tier | Color Intensity |

|-------------|------|----------------|

| |score| ≥ 25 | Very Strong | Most opaque |

| |score| ≥ 15 | Strong | Medium-high opacity |

| |score| ≥ 7 | Weak | Medium-low opacity |

| |score| < 7 | Neutral | Least opaque |

A +25 score cell will render as bright green; a +5 cell will render as dim/neutral green. This gives you instant visual ranking across all ten symbols.

How to Interpret Scores

| Score | Meaning | Trade Bias |

|-------|---------|------------|

| +20 to +31 | Very strong bull alignment | Long candidate |

| +10 to +19 | Moderate bull bias | Long with caveats |

| -9 to +9 | Mixed / chop | Wait for alignment |

| -10 to -19 | Moderate bear bias | Short with caveats |

| -20 to -31 | Very strong bear alignment | Short candidate |

Cross-Symbol Ranking

The Score row allows instant ranking of your watchlist. Scan horizontally — the highest positive scores are the strongest longs; the lowest negative scores are the strongest shorts.

On a day when SPY shows +25 and MSFT shows -15, the market regime is clearly bullish in broad markets but MSFT is experiencing symbol-specific weakness. This kind of pairs-trading insight emerges instantly from the scanner's score row.

---

# Chapter 10: Setup & Configuration

Initial Setup

1. Add the DVT 4.5 Scanner indicator to your chart

2. Configure Symbols — in the Symbols input group, enter up to 10 tickers you want to monitor

3. Choose Chart Timeframe — matched to your trading style (see profiles below)

4. Adjust Display — choose table position and text size

Symbol Configuration

The default 10 symbols are major US equities (SPY, QQQ, AAPL, MSFT, NVDA, AMZN, TSLA, META, GOOG, AMD). Common replacements:

- Futures Trader: ES1!, NQ1!, YM1!, RTY1!, GC1!, SI1!, CL1!, 6E1!, ZB1!, BTC1!

- Crypto Trader: BTCUSD, ETHUSD, SOLUSD, BNBUSD, XRPUSD, ADAUSD, DOGEUSD, DOTUSD, MATICUSD, AVAXUSD

- Forex Trader: EURUSD, GBPUSD, USDJPY, AUDUSD, USDCAD, USDCHF, NZDUSD, EURJPY, GBPJPY, EURGBP

Visibility Strategy

Don't enable every metric by default. Over-dense tables are hard to read. Recommended starter profiles below.

Scalper Profile

Focus: Ultra-short-term directional trades (seconds to minutes)

Recommended Chart TF: 1M or 3M

- MTF Triggers: 1M, 3M, 5M, 15M, 30M, 1H

- Delta: 2h, 4h

- AVWAP: D, PD, Hi, Lo

- DVT OSC: Both (≥0 and slope)

- RMA Basis: On

- RMA Impulse: On

Why: Scalpers need the fastest-reacting metrics. Lower-TF triggers catch micro-momentum shifts. Daily + Previous Day AVWAP provide the only institutional reference levels that matter on these timeframes. Highest/Lowest AVWAPs flag breakout/breakdown zones. RMA Impulse's 🟢/🔴 signals are your primary entry filter.

Day Trader Profile

Focus: Intraday trades (minutes to hours, closed before EOD)

Recommended Chart TF: 15M or 30M

- MTF Triggers: 15M, 1H, 2H, 3D

- Delta: 2h, 4h, D

- AVWAP: D, PD, W, Hi, Lo

- DVT OSC: Both

- RMA Basis: On

- RMA Impulse: On

Why: Day traders balance intraday momentum (15M/1H/2H triggers) against session structure (Daily delta, Daily AVWAP). The 3D trigger provides a macro anchor so you don't trade against a larger trend.

Swing Trader Profile

Focus: Multi-day holds (days to weeks)

Recommended Chart TF: 1H or 4H

- MTF Triggers: 1H, 2H, 4H, D, 3D, W, 2W, M

- Delta: D, W, M

- AVWAP: D, W, PW, M, PM, Q, Hi, Lo

- DVT OSC: Both

- RMA Basis: On

- RMA Impulse: On

Why: Swing traders focus on multi-day structure. Weekly and Monthly AVWAPs define major support/resistance. Weekly/Monthly Delta confirms macro flow direction.

Position Trader Profile

Focus: Long-term holds (weeks to months)

Recommended Chart TF: 4H or Daily

- MTF Triggers: 4H, D, 3D, W, 2W, M

- Delta: D, W, M

- AVWAP: W, PW, M, PM, Q, PQ, Hi, Lo

- DVT OSC: Both

- RMA Basis: On

- RMA Impulse: On

Why: Position traders ignore intraday noise. Higher-TF triggers, quarterly AVWAPs, and monthly delta define the investable trend structure.

Color Customization

All section header colors, bull/bear cell colors, and header text color are user-customizable in the Colors input group. Match your personal chart theme.

Recommended Themes

Default (High Contrast): Default colors work on both light and dark backgrounds.

Neon Dark Theme: Use bright neon colors (default greens/reds) for maximum heatmap visibility on dark chart backgrounds.

Pastel Light Theme: Replace defaults with softer greens/reds for reduced eye strain on light chart backgrounds.

---

# Chapter 11: Options Premium Profile

Trading Options Contracts with the DVT Scanner

The DVT Scanner supports OPRA options data feeds in TradingView, allowing you to load individual options contracts as symbols and scan them using the same 31-metric framework. This enables strike-by-strike and expiration-by-expiration momentum analysis — a rare capability for options traders.

How Options Contracts Load in the Scanner

TradingView's OPRA feed uses the OCC ticker format:

```

{Underlying}{YYMMDD}{C/P}{Strike × 1000, 8 digits}

```

Examples:

- SPX251219C05800000 = SPX December 19 2025 $5800 Call

- SPX251219P05800000 = SPX December 19 2025 $5800 Put

- SPXW251031C06000000 = SPX Weekly expiring Oct 31 2025 $6000 Call

- AAPL251219C00250000 = AAPL December 19 2025 $250 Call

Enter these tickers directly into the scanner's Symbol inputs (Symbol 1 through Symbol 10). The scanner computes all 31 DVT metrics on the options' premium price action — giving you a momentum/positioning read on the contract itself, not just the underlying.

Why This Works

Options premiums have their own distinct price action driven by:

- Delta (underlying direction exposure)

- Gamma (acceleration near the money)

- Theta (time decay)

- Vega (IV changes)

- Supply/demand dynamics on the specific strike

The DVT Scanner's triggers, AVWAPs, and oscillator track this premium action directly. A call option showing a +25 Composite Score means the premium itself is in a strong uptrend — which typically correlates with underlying direction + IV expansion + favorable gamma.

Options Daily Scalper Profile

Focus: Intraday options trades (minutes, held same day, usually 0DTE or 1DTE)

Recommended Chart TF: 1M or 3M

Recommended Contract Loadout: 5 Calls + 5 Puts spanning ATM ± 2-3 strikes on same expiration

Example symbol loadout for 0DTE SPX on Oct 31 2025 with SPX at 6000:

- sym01: SPXW251031C05900000 (ITM Call $5900)

- sym02: SPXW251031C05950000 (ITM Call $5950)

- sym03: SPXW251031C06000000 (ATM Call $6000)

- sym04: SPXW251031C06050000 (OTM Call $6050)

- sym05: SPXW251031C06100000 (OTM Call $6100)

- sym06: SPXW251031P05900000 (OTM Put $5900)

- sym07: SPXW251031P05950000 (OTM Put $5950)

- sym08: SPXW251031P06000000 (ATM Put $6000)

- sym09: SPXW251031P06050000 (ITM Put $6050)

- sym10: SPXW251031P06100000 (ITM Put $6100)

Metric Configuration:

- MTF Triggers: 1M, 3M, 5M, 15M, 30M

- Delta: 2h, 4h

- AVWAP: D, PD, Hi, Lo

- DVT OSC: Both

- RMA Basis: On

- RMA Impulse: On

How to Read This Setup:

- The 5 Call strikes form the left half of your table

- The 5 Put strikes form the right half

- When the underlying trends up: Call Composite Scores rise across all 5 strikes, Put scores fall across all 5 strikes

- Look for which Call strike shows the strongest +Score — that's the highest-conviction long contract

- Look for which Put strike shows the strongest +Score when markets reverse — that's the highest-conviction short hedge

Options Swing Trader Profile

Focus: Multi-day options holds (days to 1-2 weeks, typically 7-30 DTE)

Recommended Chart TF: 15M or 1H

Recommended Contract Loadout: 5 Calls at different strikes/expirations + 5 Puts similarly

Example symbol loadout for SPX swing positions:

- sym01: SPX251121C06000000 (21 DTE ATM Call)

- sym02: SPX251219C06000000 (49 DTE ATM Call)

- sym03: SPX251121C06200000 (21 DTE OTM Call)

- sym04: SPX251219C06200000 (49 DTE OTM Call)

- sym05: SPX260116C06500000 (LEAPS-ish OTM Call)

- sym06: SPX251121P05800000 (21 DTE OTM Put)

- sym07: SPX251219P05800000 (49 DTE OTM Put)

- sym08: SPX251121P06000000 (21 DTE ATM Put)

- sym09: SPX251219P06000000 (49 DTE ATM Put)

- sym10: SPX260116P05500000 (LEAPS-ish OTM Put)

Metric Configuration:

- MTF Triggers: 15M, 1H, 2H, 4H, D, 3D, W

- Delta: D, W, M

- AVWAP: D, W, PW, M, Hi, Lo

- DVT OSC: Both

- RMA Basis: On

- RMA Impulse: On

How to Read This Setup:

- Compare Composite Scores across different expirations to see which DTE has the cleanest momentum

- Near-dated contracts (21 DTE) will show more volatile scores; far-dated (49 DTE+) will be smoother

- LEAPS-like contracts reflect macro positioning — their scores often lead the near-dated trend

- When all 5 Call scores align bullish and Put scores align bearish, you have confirmed directional bias

Alpha Tips for Buying & Selling Options

Buying Calls (Long Directional)

1. Wait for RMA Impulse = 🟢 on the specific Call contract before entering. This confirms the premium is in a bull impulse.

2. Look for Composite Score ≥ +15 on the Call. This means multiple DVT subsystems agree the premium is trending up.

3. Check the underlying's scanner readings simultaneously. The Call's score should align with the underlying's score. If the Call is +20 but the underlying is -5, that's suspicious — likely IV inflation rather than genuine directional momentum.

4. Prefer strikes where the 1H or 2H Trigger flipped from below to above within the last 20 bars. This captures the start of a move before premium decay kicks in.

5. Scale out on Composite Score peaks. When the Call's score reaches +25 to +31 AND the ≥0 slope flips from ↑ to ↓ (exhaustion), take partial profits.

Buying Puts (Long Directional Downside)

1. Wait for RMA Impulse = 🔴 on the Put contract AND 🔴 on the underlying. Double confirmation.

2. Look for Composite Score ≥ +15 on the Put (remember, a rising Put premium = bullish Put score). Concurrent Composite Score ≤ -15 on the underlying.

3. Daily Delta on the underlying should be -. If the underlying is showing bullish delta but you're buying Puts, you're fighting order flow.

4. Prefer weekly-dated or short-dated Puts during macro bearish conditions (most triggers red on the underlying). Avoid Puts during choppy/sideways scanner states.

5. Exit quickly on bounces. Put premium decays rapidly if the underlying stops falling. If the underlying's 5M/15M triggers flip back green, close the Put.

Selling Options (Premium Collection)

1. Sell Calls when the underlying shows weak/neutral Composite Score AND the specific OTM Call contract shows a weak Composite Score. You want the premium to drift sideways or down.

2. Sell Puts when the underlying shows positive Composite Score AND strong RMA Impulse 🟢. The underlying is in a defined uptrend so Put values should decay.

3. Avoid selling options when RMA Impulse is 🟡 on the underlying. Yellow = chop/consolidation = unpredictable premium behavior = bad for premium sellers.

4. The best environment for Iron Condors / Strangles is when ALL 10 option strikes in your scanner show mixed/neutral Composite Scores (all between -10 and +10). This signals broad pricing without directional conviction — ideal for non-directional strategies.

5. The Value row in the scanner tells you the current premium. Combined with the Composite Score, you can rank strikes by "premium per unit of directional conviction" — sell the strikes where score is weak but premium is rich.

Strike Selection Alpha

1. ATM Strike Momentum: The ATM Call's Composite Score typically leads OTM strikes. If ATM Call is +20 but OTM 1% Call is only +10, the move has limited follow-through. If OTM 1% Call is +25 (higher than ATM), you have gamma-driven acceleration — ride it.

2. Wing Divergence: When deep OTM options (wings) show opposite Composite Scores from ATM, something unusual is happening. Could indicate tail-risk pricing shifts, unusual flow, or dealer positioning changes.

3. Expiration Arbitrage: Compare same-strike/different-expiration Composite Scores. If near-dated shows +25 but far-dated shows +5, the market is pricing in short-term strength only. Consider rolling your position forward to capture sustained moves.

4. IV Impact on Delta Row: The underlying's Daily Delta combined with the options' Composite Score separates direction (delta) from IV (premium). If both show green, it's a clean directional move. If underlying delta is green but options score is weak, IV is probably collapsing (vega drain).

Risk Warnings

- Options decay accelerates exponentially in the last 7 days before expiration. Scanner metrics may show bullish alignment on a 1DTE contract even as theta wipes out the premium. Always factor in DTE when interpreting options scanner readings.

- 0DTE contracts have extremely fast price action. Use only the Scalper profile (1M/3M chart). Higher-TF triggers are unreliable on 0DTE because the contract itself has < 1 day of meaningful price history.

- Low-volume strikes may show erratic scanner readings. If an OTM strike has low open interest and low volume, the "price action" is largely bid-ask spread noise. Stick to liquid strikes (high OI) for reliable scanner data.

- Options scanner readings do NOT predict underlying direction. They show the premium's momentum. A Call can show +25 Composite Score and still lose value overnight due to IV crush after earnings. Always combine with fundamental catalyst awareness.

---

# Chapter 12: Reading the Scanner Like a Pro

The Five-Second Glance

With practice, you can extract the complete state of 10 symbols in under five seconds:

1. Start with the SCORE row. Identify the highest positive and lowest negative scores. These are your extremes.

2. Check RMA Impulse emojis. Look for active 🟢 or 🔴 signals that align with your score reads.

3. Scan the DVT OSC row. Identify which symbols have + ↑ (strongest bull) or - ↓ (strongest bear).

4. Vertical read on extremes. For the symbols with highest/lowest scores, read down their columns to understand WHY they have those scores.

5. Look for divergences. Are any symbols showing mixed signals — e.g., bullish triggers but bearish delta?

The Watchlist Hunt

Use the scanner as a daily watchlist filter:

1. Load the scanner with 10 symbols from a broader universe (e.g., your top 10 S&P sectors)

2. Identify the top 2-3 symbols by absolute score magnitude

3. Open charts of those symbols individually for deeper analysis

4. Use the DVT 4.5 Oscillator and DVT 4.5 TRIGGERS/LEVELS on single-symbol charts for precise entries

Pairs Trading

The scanner is a powerful pairs-trading tool:

- If two correlated symbols show dramatically different scores (e.g., SPY +25, QQQ -10), a pair trade may be setting up — long the strong one, short the weak one

- Look for intra-sector divergences (e.g., MSFT bullish, AAPL bearish) as rotation signals

Regime Detection

When the majority of your 10 symbols show strongly positive or strongly negative scores simultaneously, the broader market regime is clear. Use this to filter your bias:

- 8-10 symbols bullish: Risk-on environment, favor longs only

- 8-10 symbols bearish: Risk-off environment, favor shorts only

- Mixed: Chop / transition — trade less, stick to strongest symbols

Divergence Trading

Look for specific divergence patterns:

- Price-Delta Divergence: Symbol with rising price but - on multiple delta periods = distribution warning

- Trigger-AVWAP Divergence: Symbol with bullish triggers but bearish AVWAPs = unstable rally

- OSC-Score Divergence: Symbol with bullish OSC but negative Composite Score = mixed signal, skip

---

# Chapter 13: Troubleshooting

"I see blank cells for some symbols"

The symbol ticker is likely invalid or delisted. Check the Symbols input group — TradingView requires full exchange prefixes for some instruments (e.g., NASDAQ:AAPL not just AAPL). For options, ensure the OCC ticker format is correct and the contract exists/has expired.

"The RMA Basis contradicts my trigger alignment"

RMA Basis operates on a different component of the DVT cascade than the MTF Triggers. Occasional divergence is normal — it often indicates early momentum shifts before they show in the triggers.

"The table is too wide / too narrow"

Adjust table text size in the Display input group:

- tiny: Smallest, fits on narrow screens

- small: Balanced default

- normal: Larger, easier to read

- large: Maximum visibility

Alternatively, disable metric sections you don't use to shrink the table vertically.

"The table blocks my price action"

Move the table using the Table Position input. Options include all four corners and both middle sides. Choose the position that least obstructs your chart.

"Options contracts show blank/NA cells"

Ensure your TradingView subscription includes OPRA options data. The OPRA feed requires a paid add-on. Additionally, verify the options contract hasn't expired and has sufficient volume/OI for meaningful data.

---

# Chapter 14: Integration with Other DVT 4.5 Tools

The DVT 4.5 Scanner is designed to complement — not replace — the other DVT 4.5 indicators:

DVT 4.5 TRIGGERS/LEVELS (Overlay)

- Use on individual symbol charts for precise trigger prices and AVWAP levels

- The scanner gives you the breadth; the overlay gives you the depth

Deviation Trendz 4.5 (Oscillator)

- Use on individual symbol charts for the actual oscillator waveform + delta heatmap

- The scanner's DVT OSC row is a summary; the full oscillator shows the real-time value curve

- Use Deviation Trendz 4.5 for precise entry timing on scanner-flagged setups

Workflow

1. Scanner (this tool): Daily watchlist filtering — identify top 2-3 candidates

2. DVT 4.5 TRIGGERS/LEVELS: Load on top candidates — map out support/resistance and trigger levels

3. Deviation Trendz 4.5: Monitor oscillator + impulse signals for precise entries

4. Execute with confluence across all three tools

---

# Chapter 15: Changelog

v4.5 Scanner (Current)

Core Features

- 13 MTF Momentum Triggers (1M through Monthly)

- 5 Cumulative Delta anchor periods

- 10 Anchored VWAP anchors (including Highest/Lowest lookback anchors)

- DVT Oscillator (above/below zero + slope)

- RMA Basis trend indicator

- RMA Impulse (🟢🔴🟡 emoji signals from DVT 4.5 OSC)

- Composite Score (-31 to +31 range)

UI Features

- Transposed table layout (metrics as rows, symbols as columns)

- "DVT SCAN" title cell at top-left

- Value/Price row showing current close per symbol (always $X.XX)

- Combined section headers (centered text, matching backgrounds)

- 4-tier color strength (Very Strong, Strong, Weak, Neutral)

- Faint grey gridlines

- _color backgrounds for title, symbols, metric labels, RMA Impulse, and Score rows

- Fully customizable colors (bull, bear, sections, header text)

- Four table sizes (tiny, small, normal, large)

- Six table positions (all corners + middle sides)

Metric Controls

- Master toggles for each section (Triggers, Delta, AVWAP, OSC, RMA Basis, RMA Impulse)

- 31 individual metric toggles

- Each disabled metric removed from table AND excluded from Composite Score

Technical Architecture

- 10 () calls (one per symbol)

- Bit-packed return tuples to fit 31 metrics per symbol

- Transposed-only layout

- Script-scope helper functions for cell rendering

- OPRA options data feed supported for options contract scanning

---

End of Manual