
DS Flow ✦ Volume-by-Price Footprint · NinjaTrader 8
DS Flow
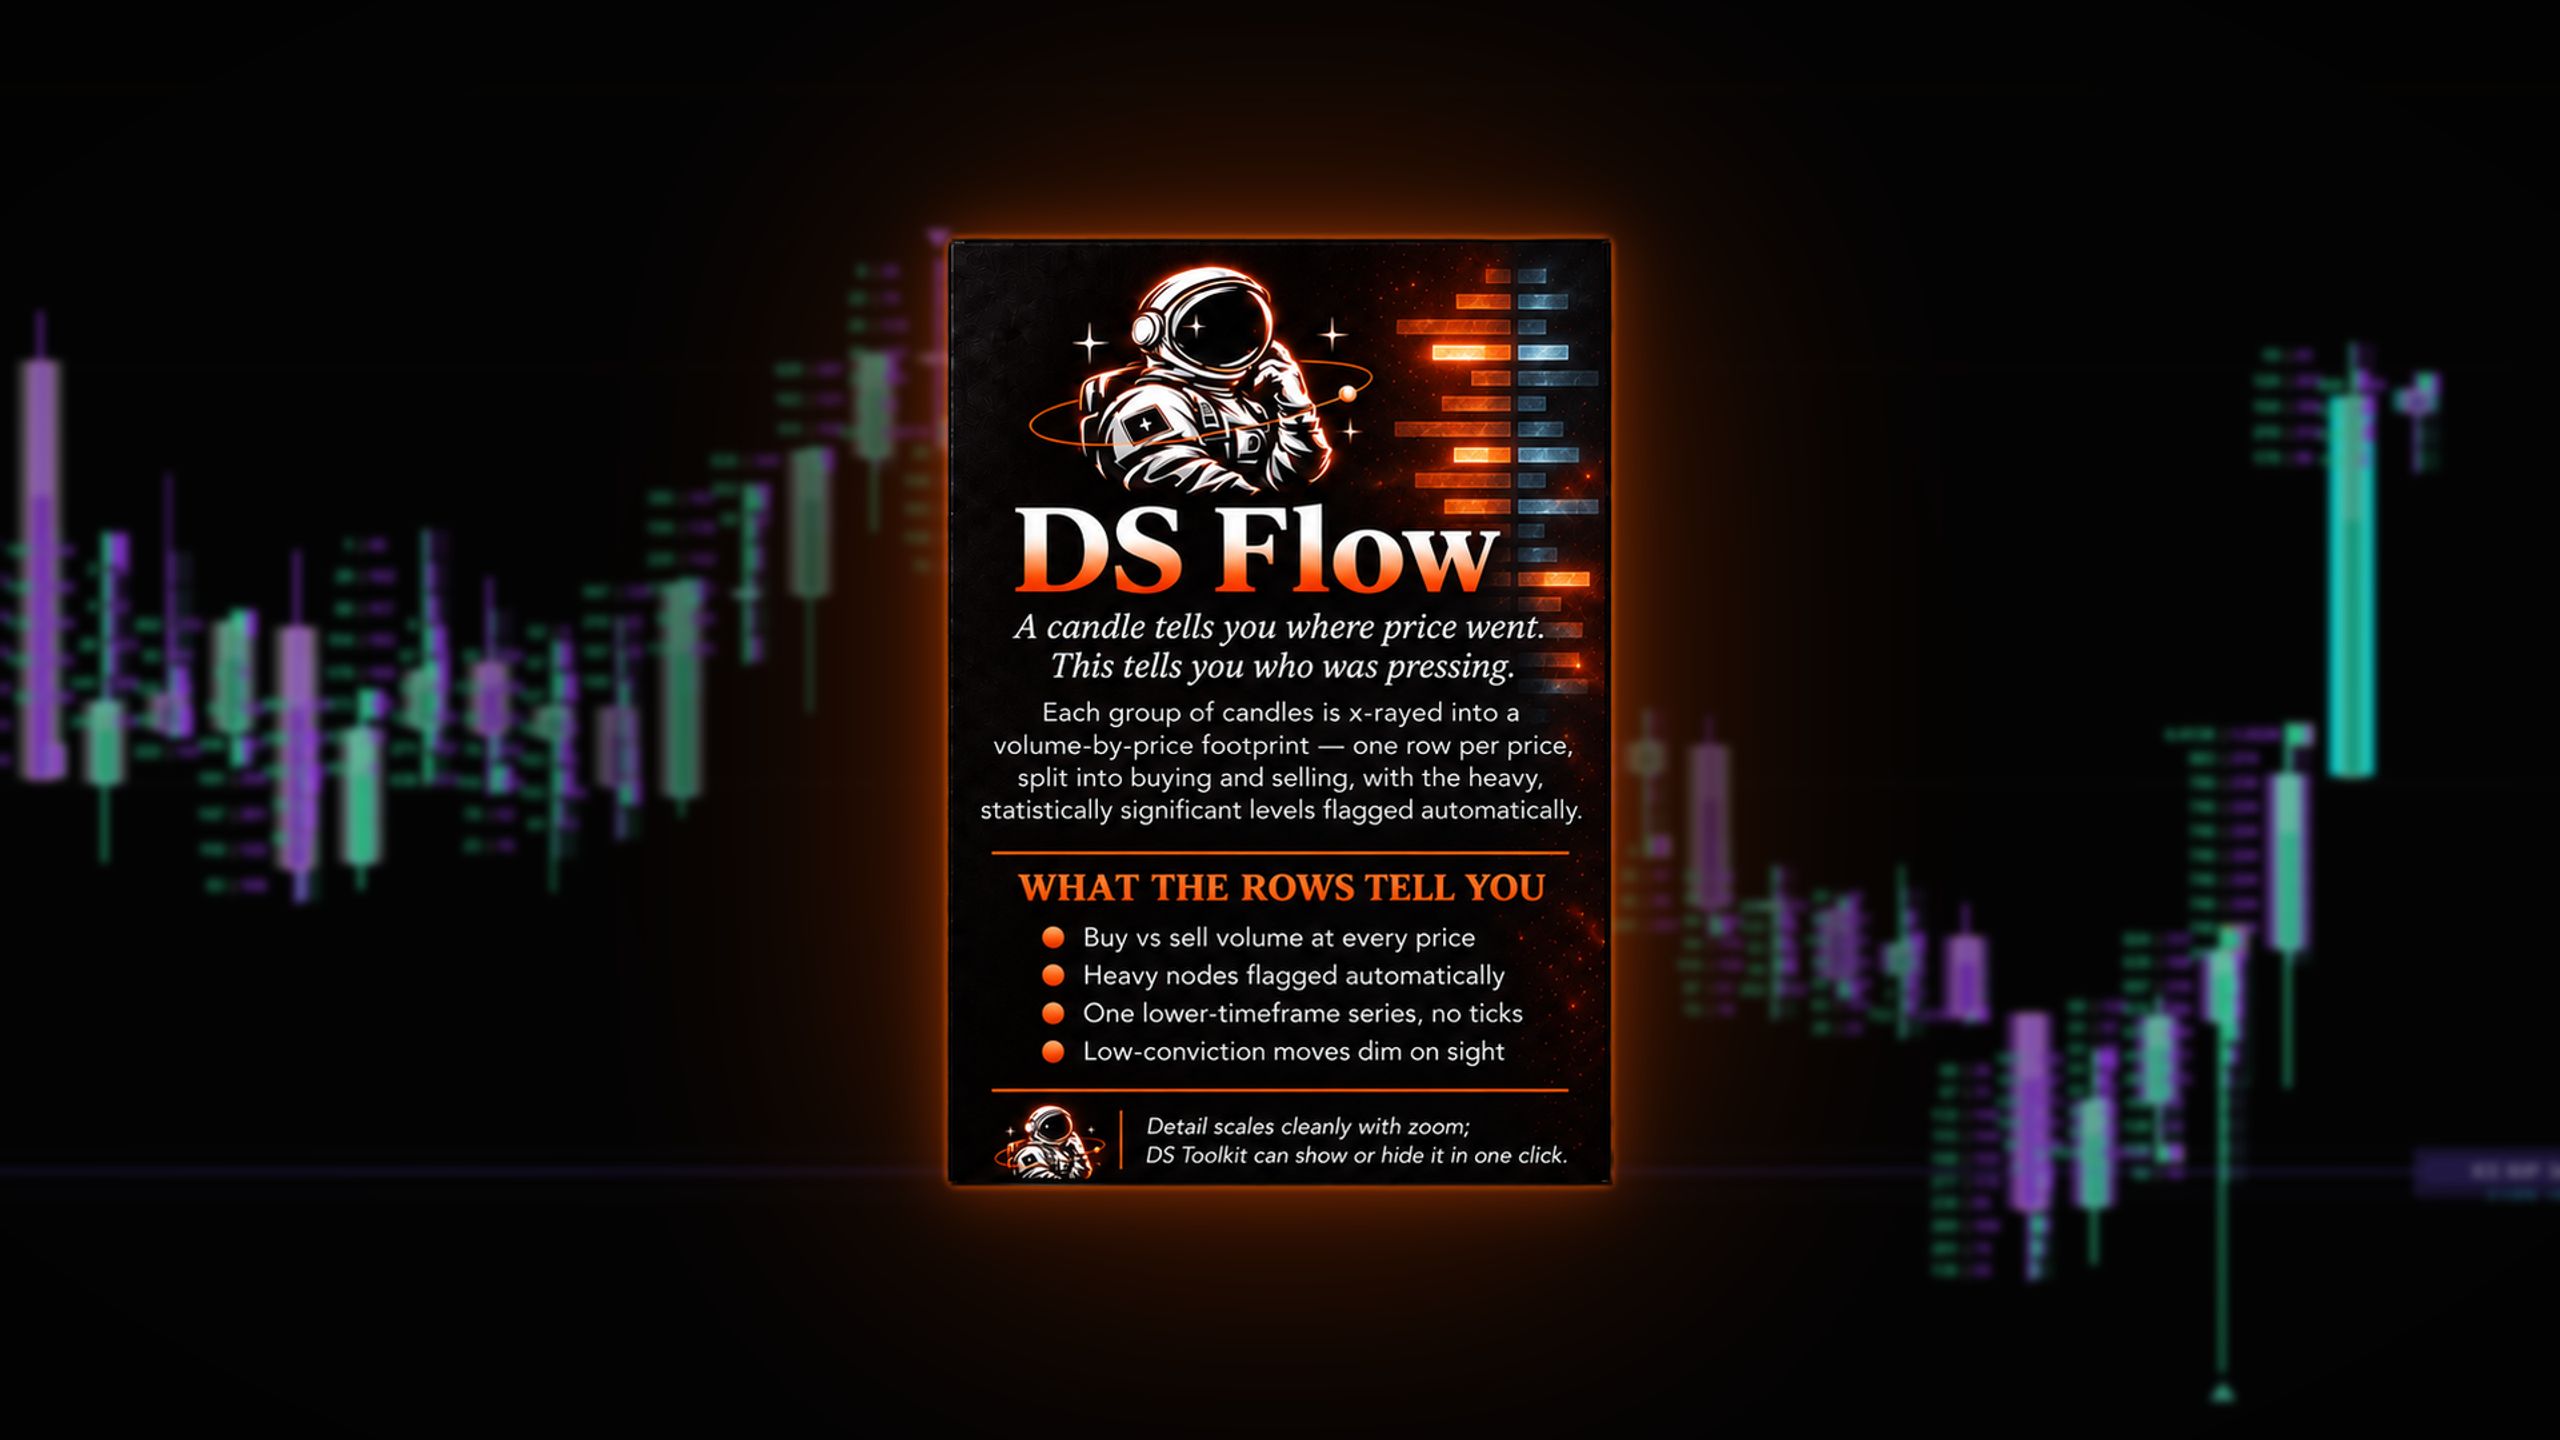
✦ A candle tells you where the market went. This tells you where it did business — and who was pressing.
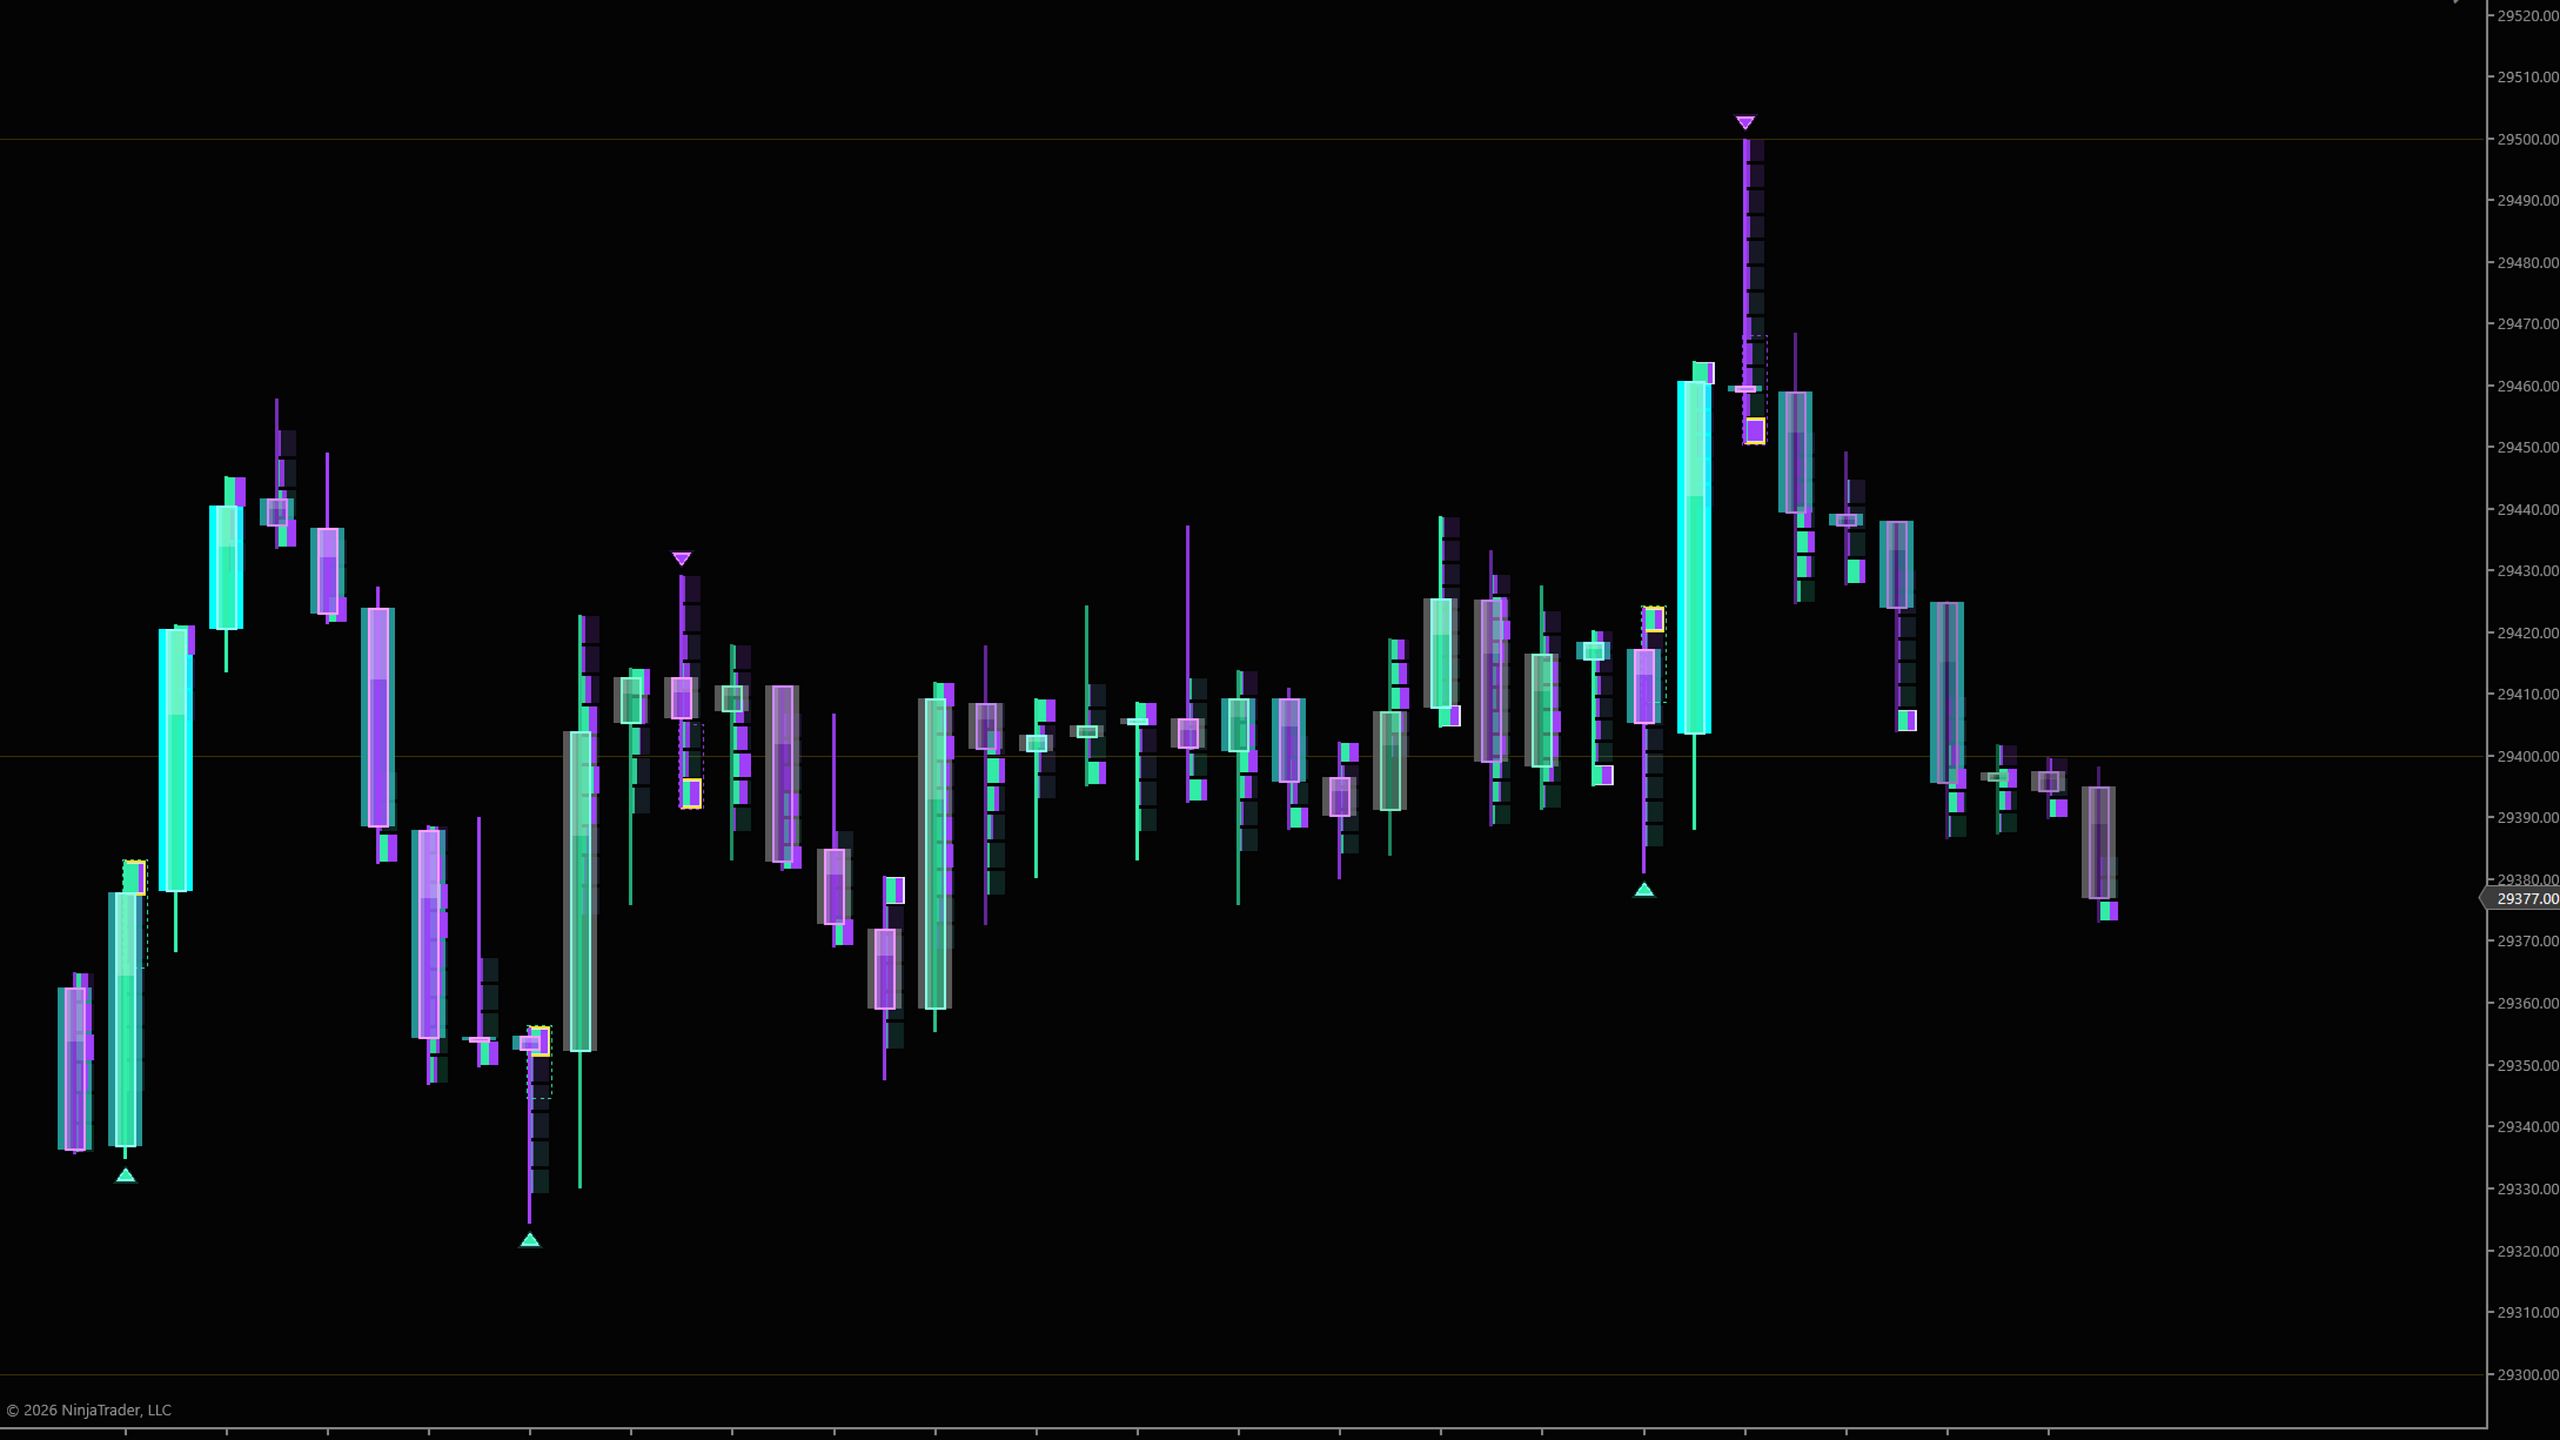
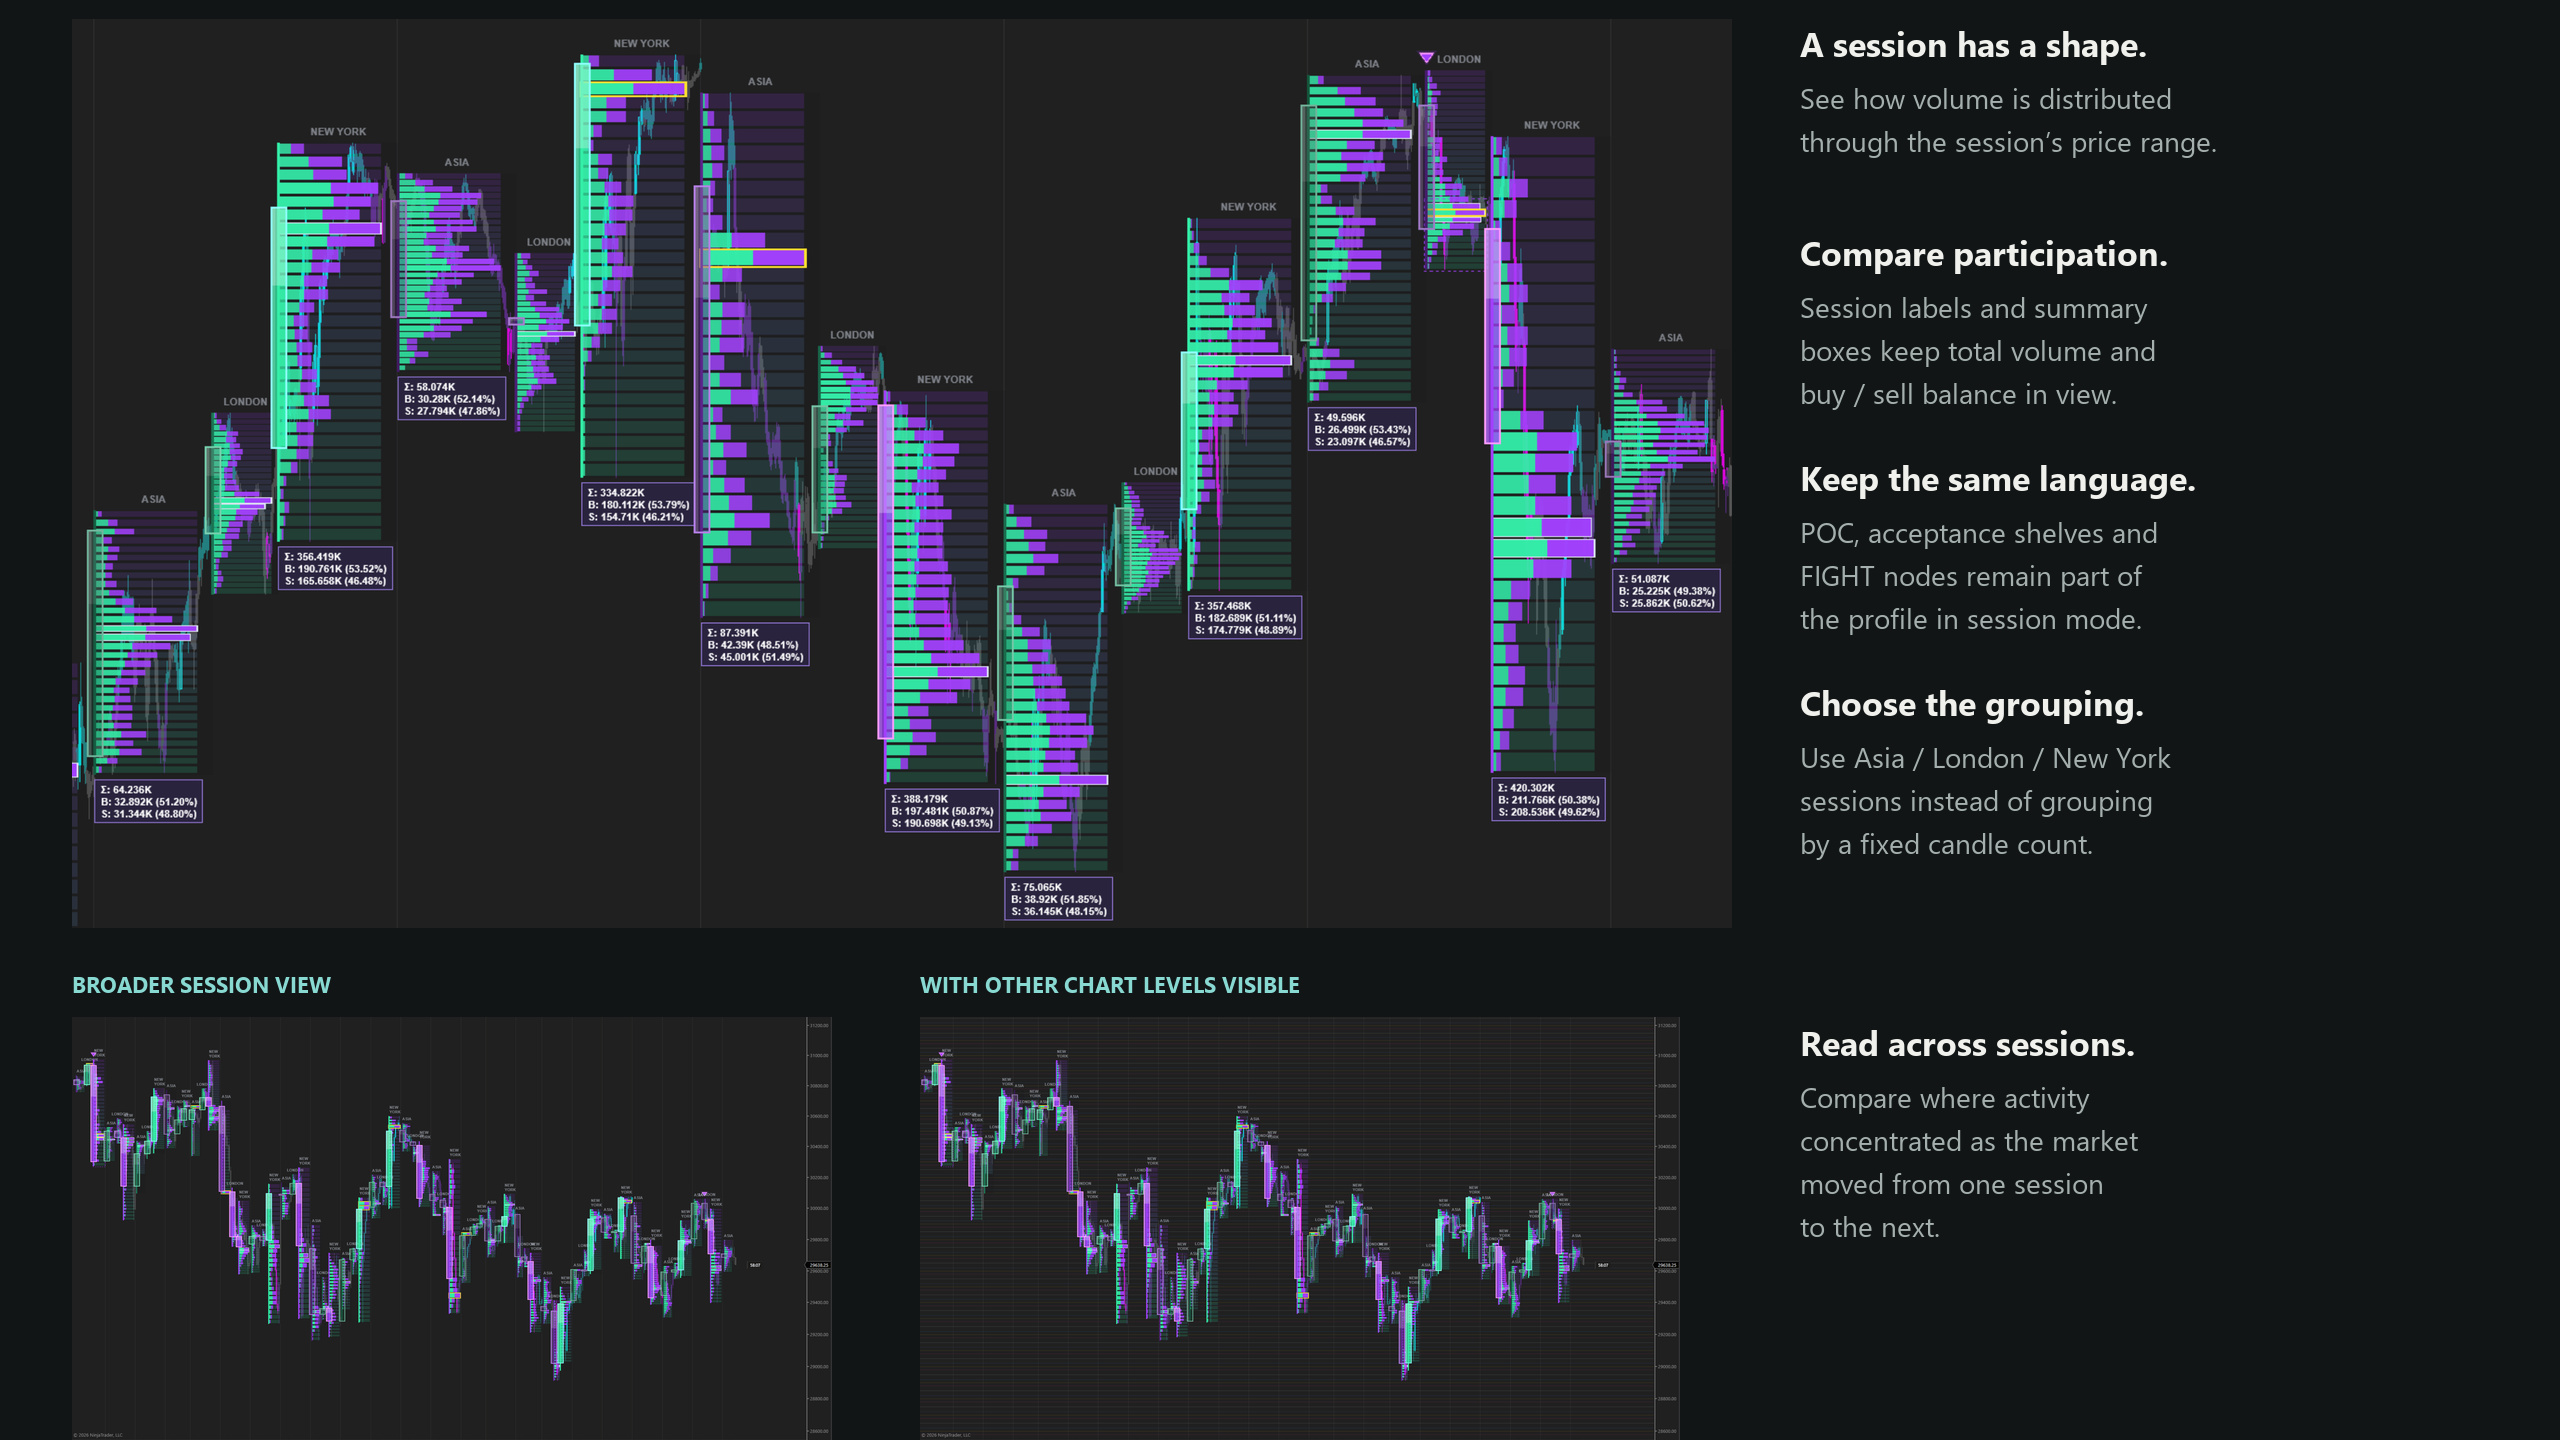
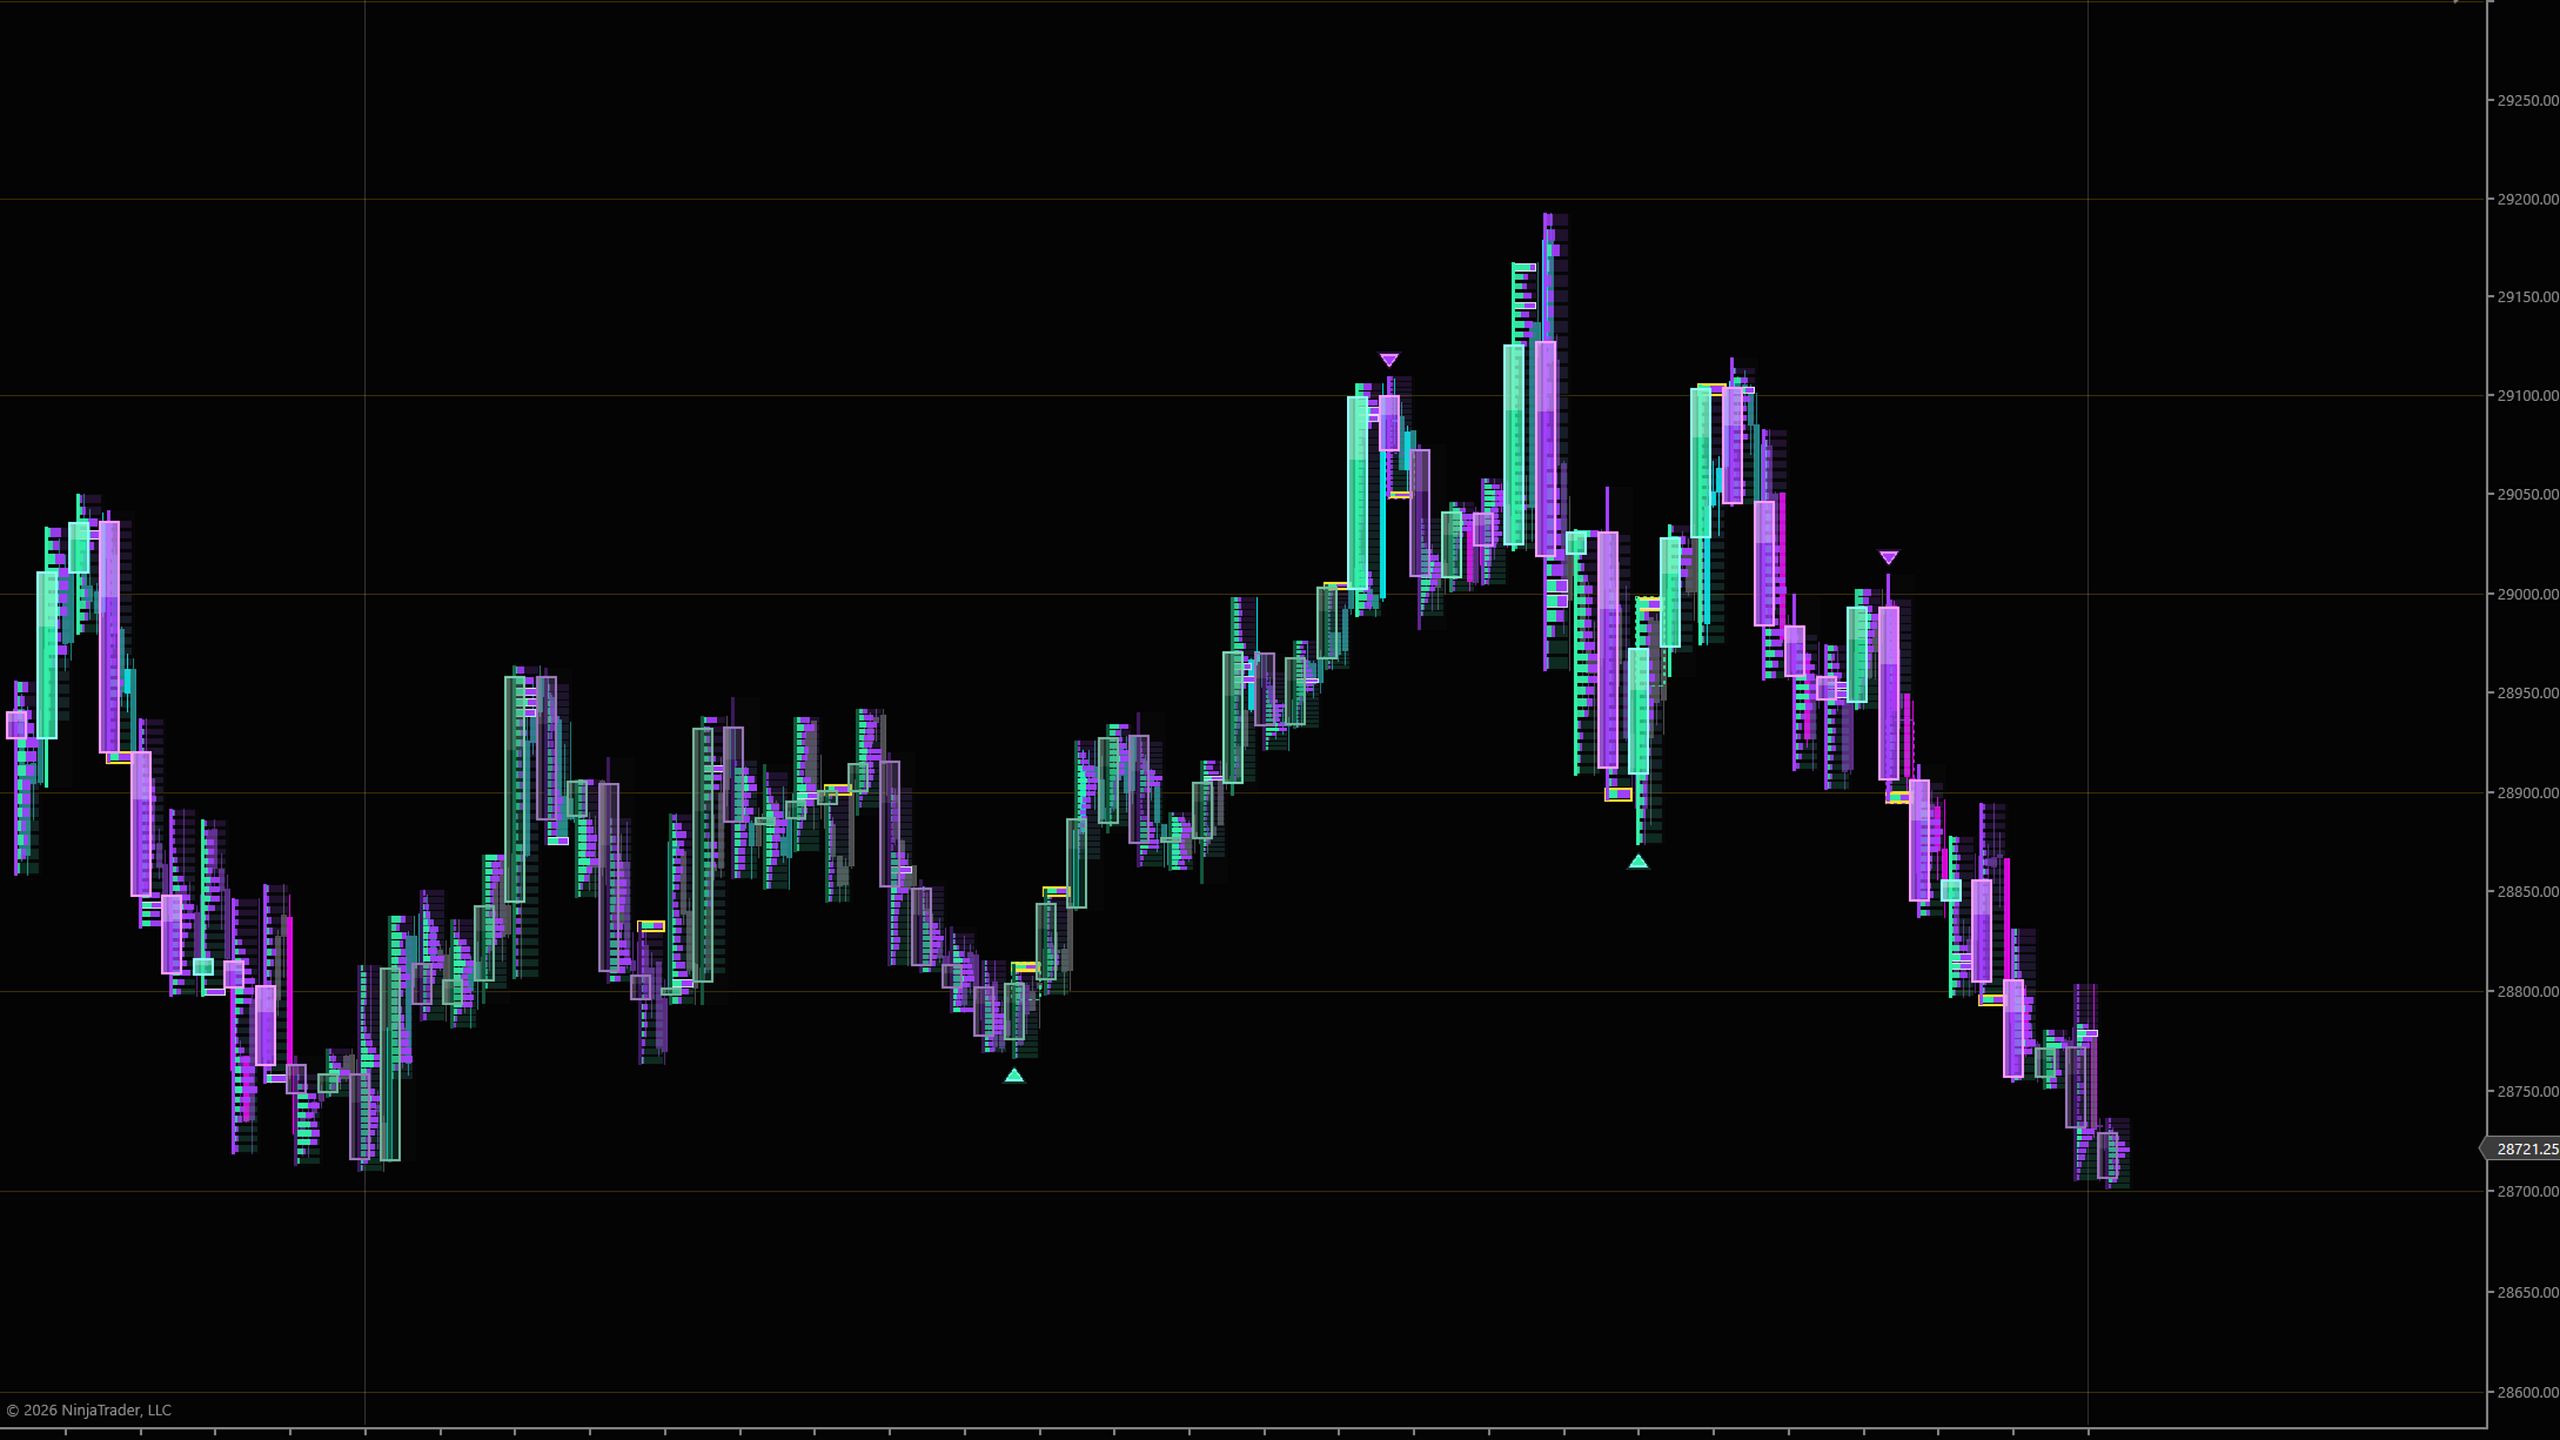
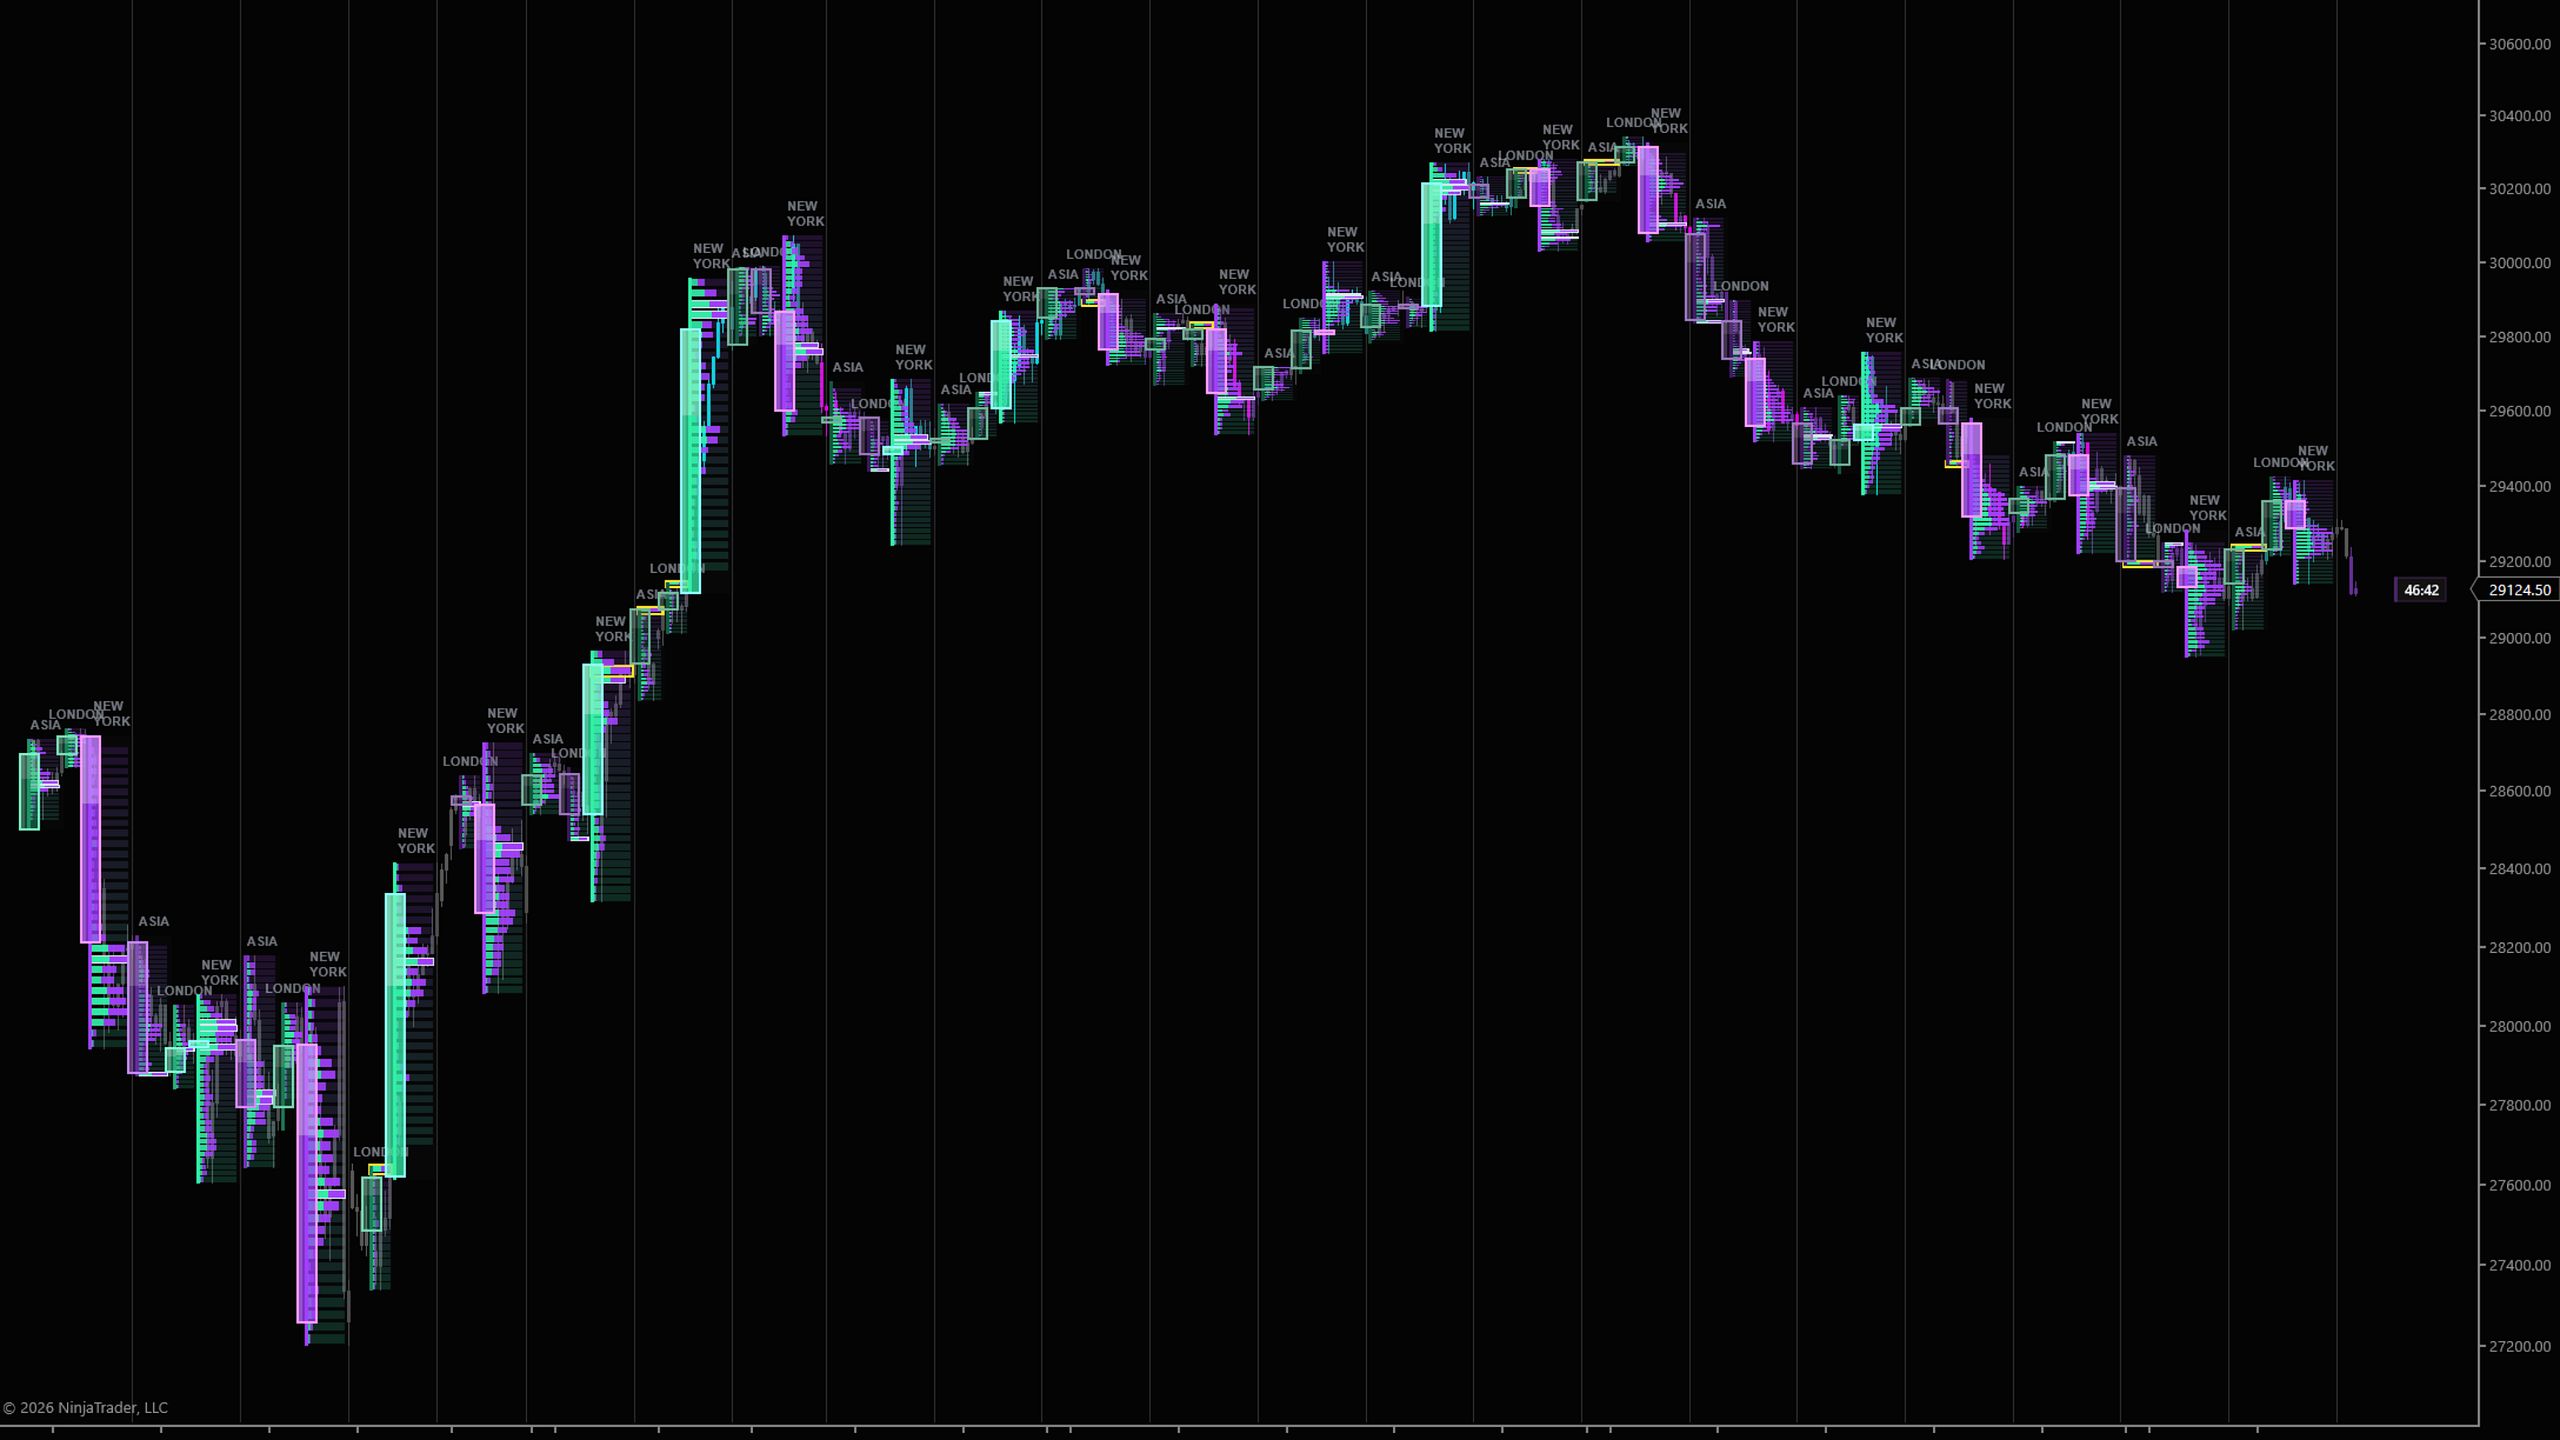
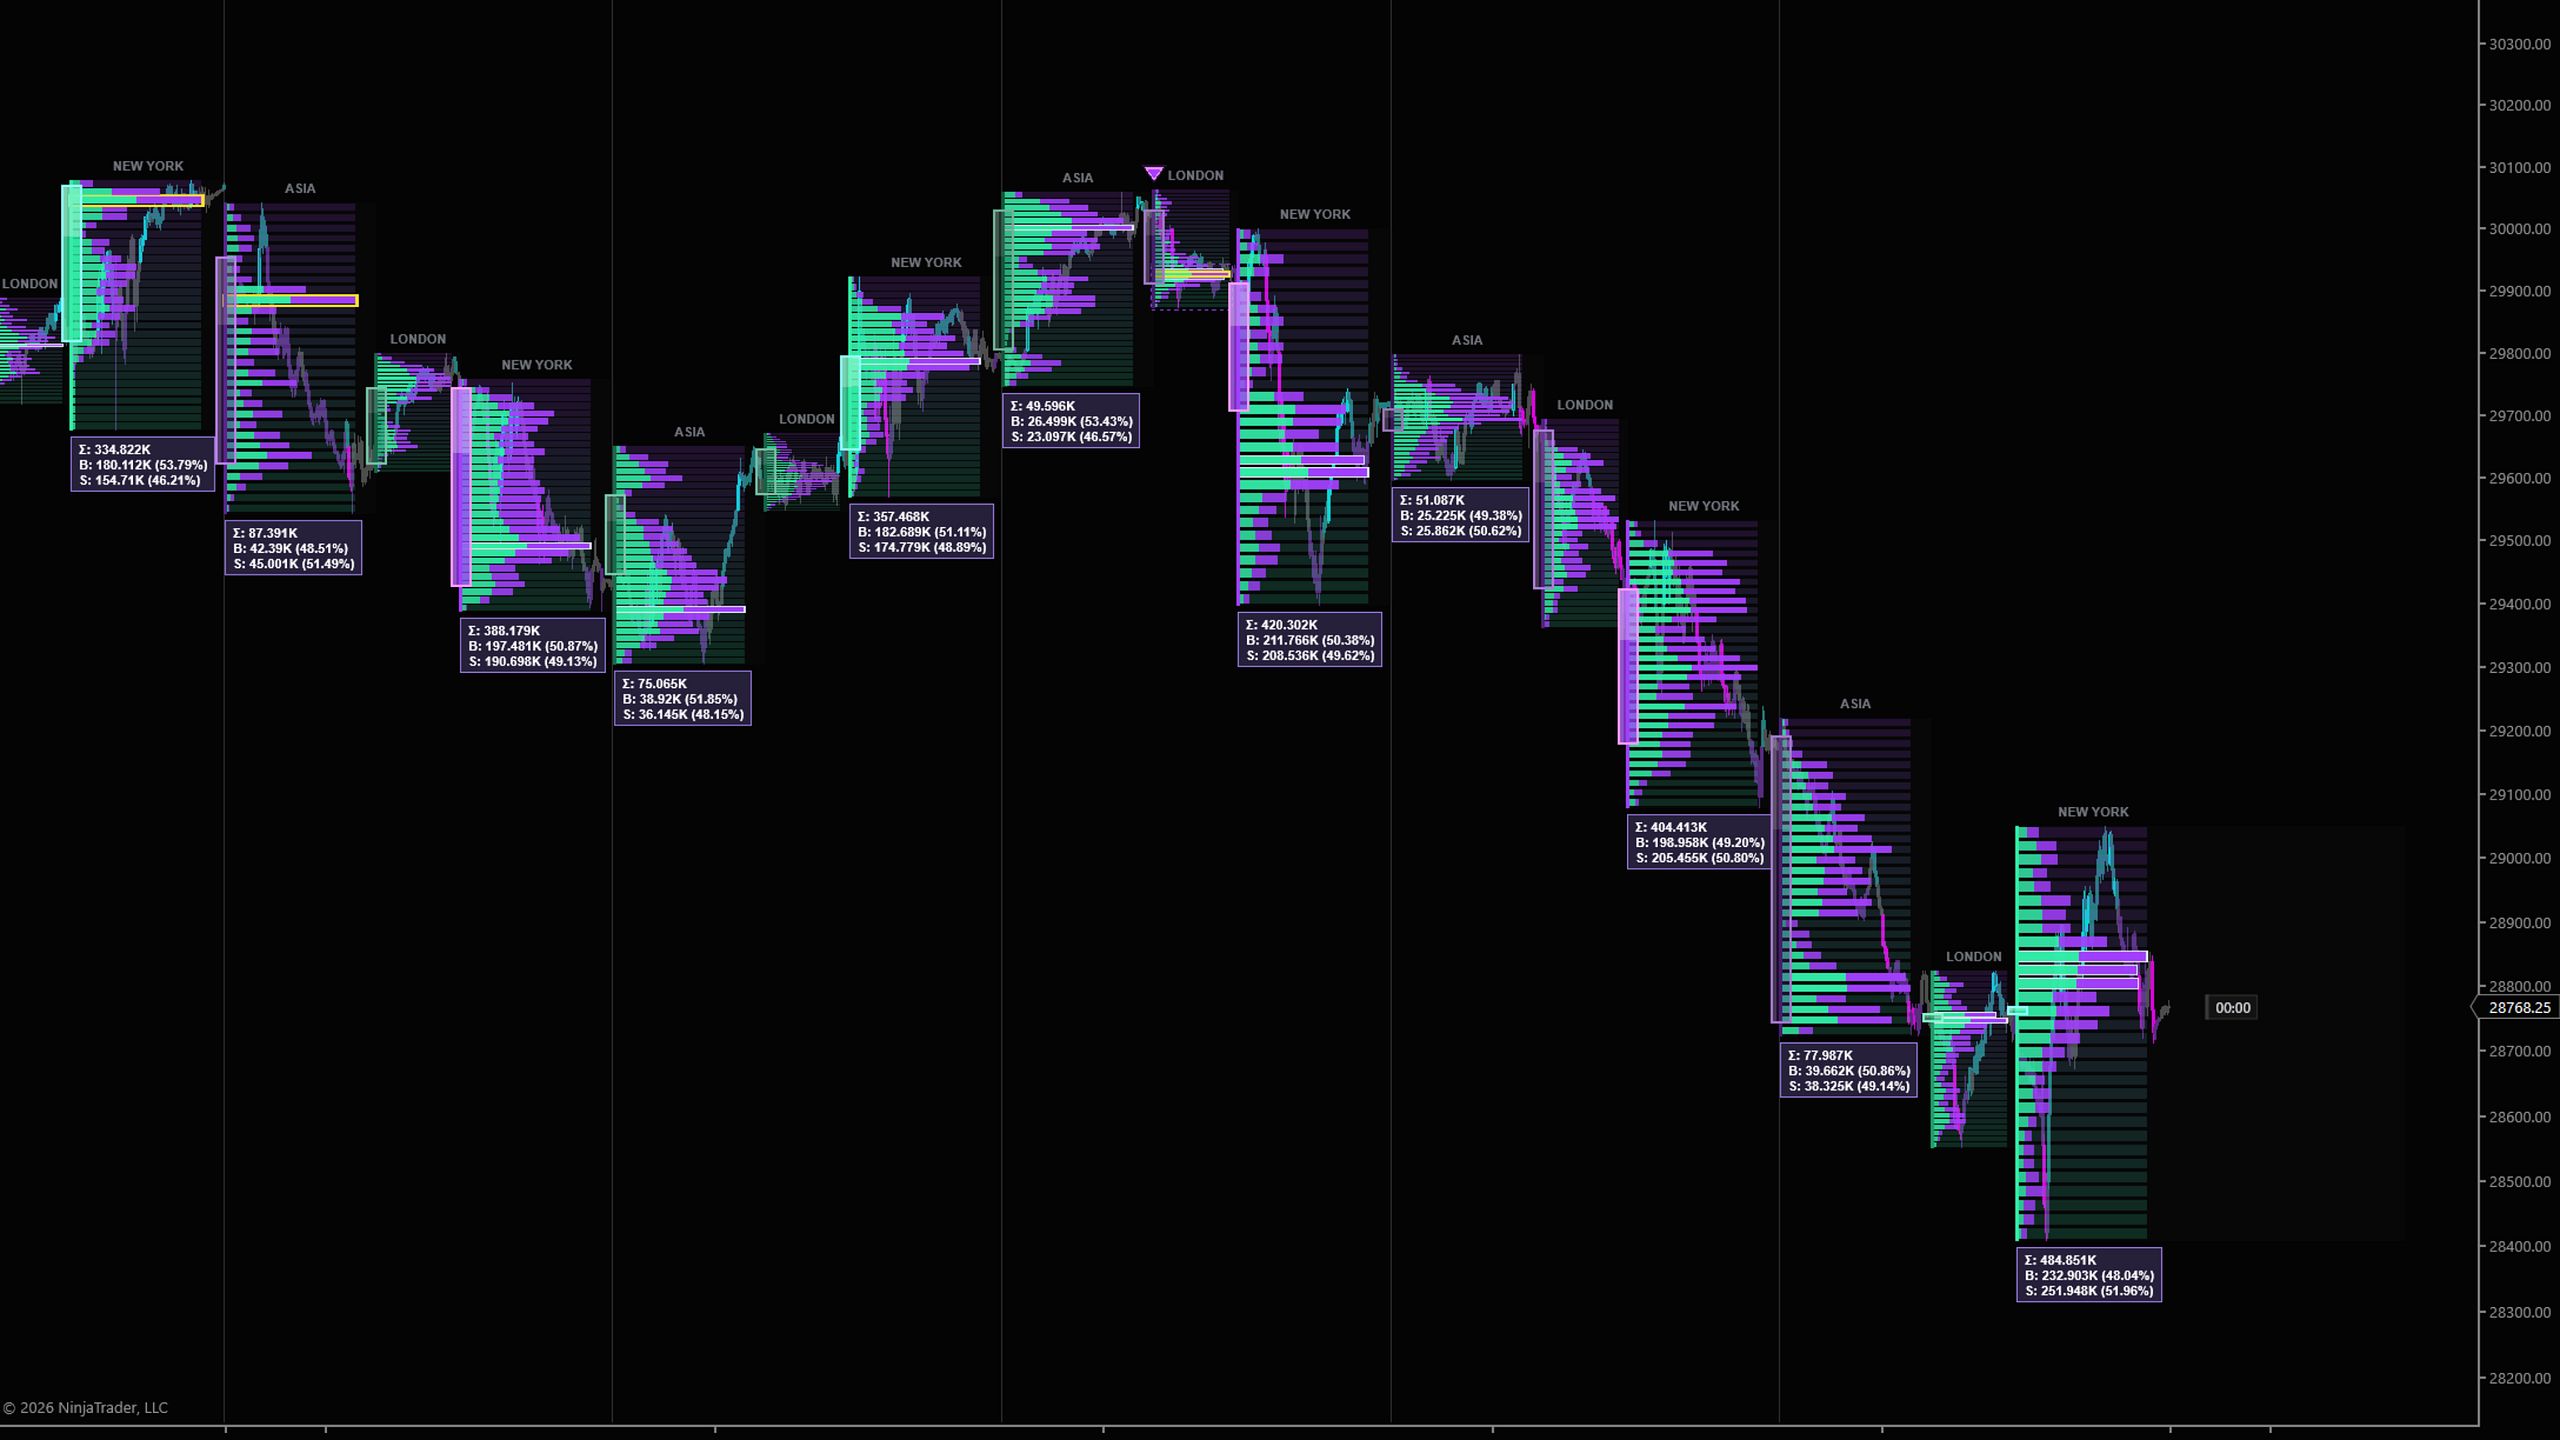
Each group of candles is x-rayed into a volume-by-price profile: one row per price, split into buy and sell, the longest row the fairest price.
◆ What the rows tell you
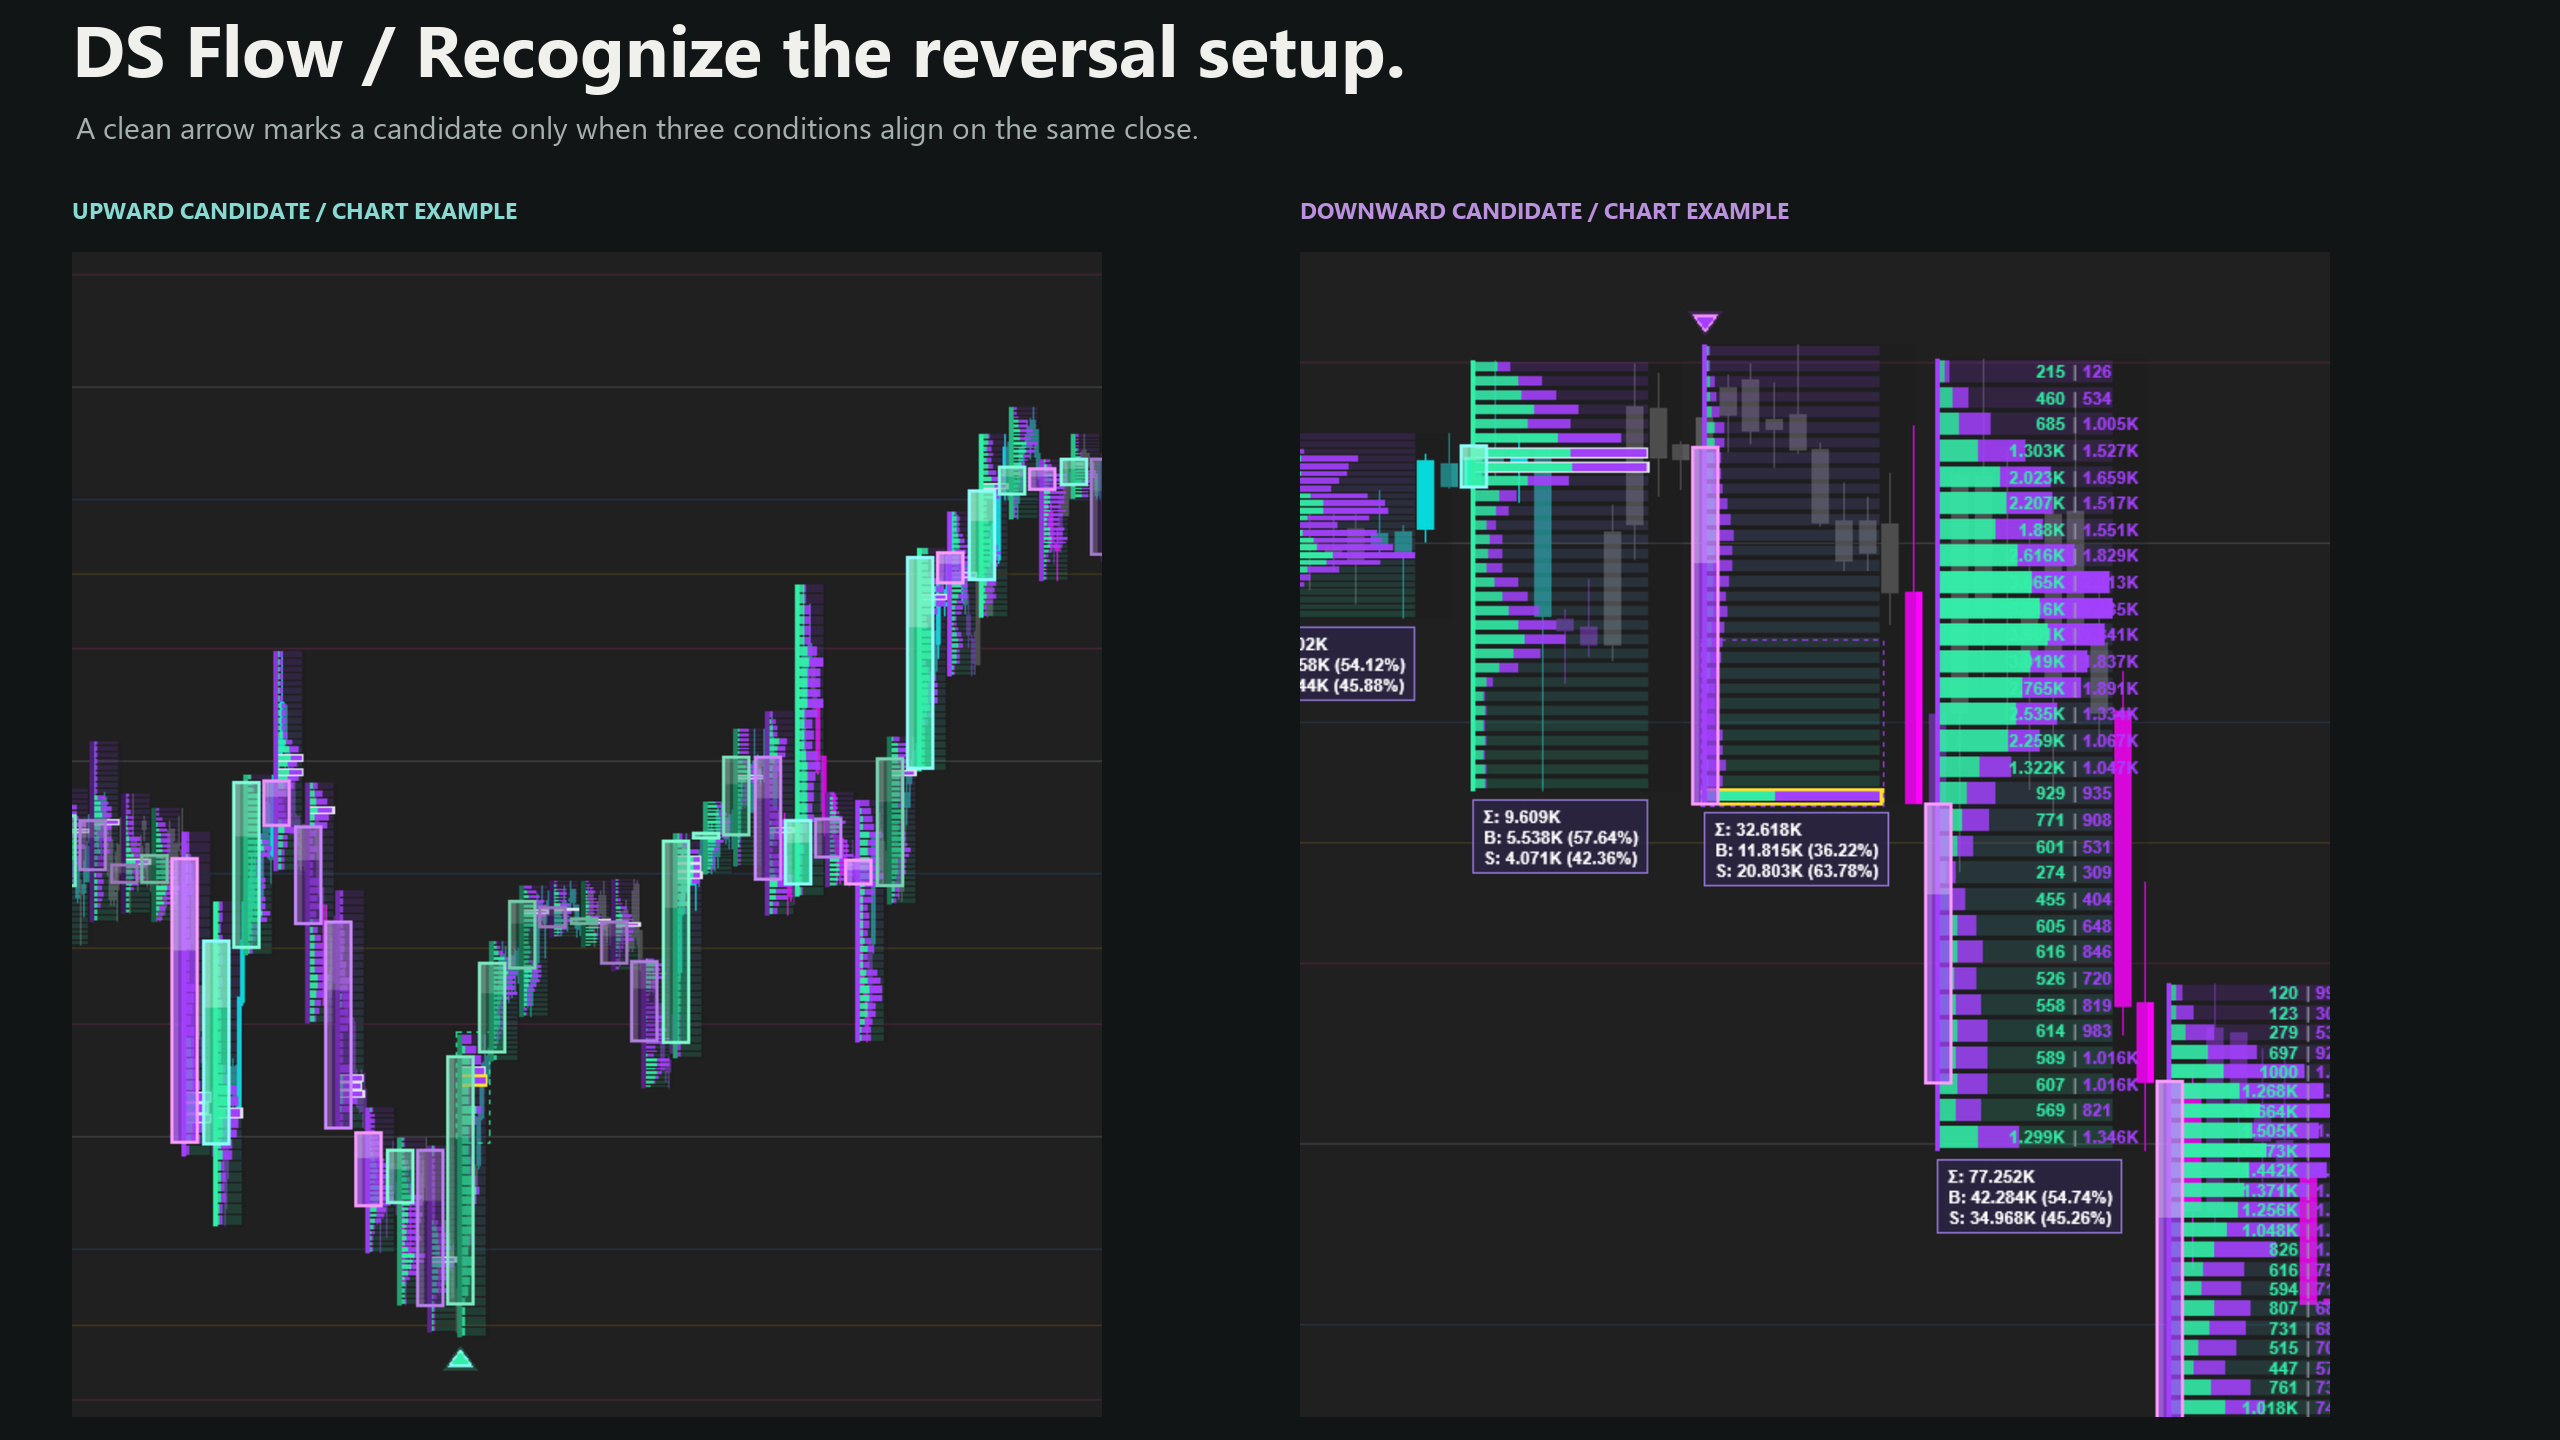
▸ Statistically heavy rows flagged as acceptance shelves — the magnets and reaction zones
▸ Buy% vs Sell% in a summary box for absorption and exhaustion
▸ A glass candle that dims on below-average volume, so a hollow move is obvious
▸ Built from one extra lower-timeframe series — no tick-history download needed
Detail scales cleanly with zoom, and DS Toolkit can show or hide the whole overlay from the toolbar.
✦ ✦ ✦
Educational software, not investment advice. Futures trading carries substantial risk of loss. NinjaTrader® is a registered trademark of NinjaTrader Group, LLC — no affiliation or endorsement.