
DS ProHeikinAshi ✦ Heikin-Ashi Candle & Flip Level Panel · NinjaTrader 8
DS Pro Heikin Ashi
✦ A Heikin-Ashi chart shows the trend and hides the price. Its candles are averages, so nothing on it is a price that traded.
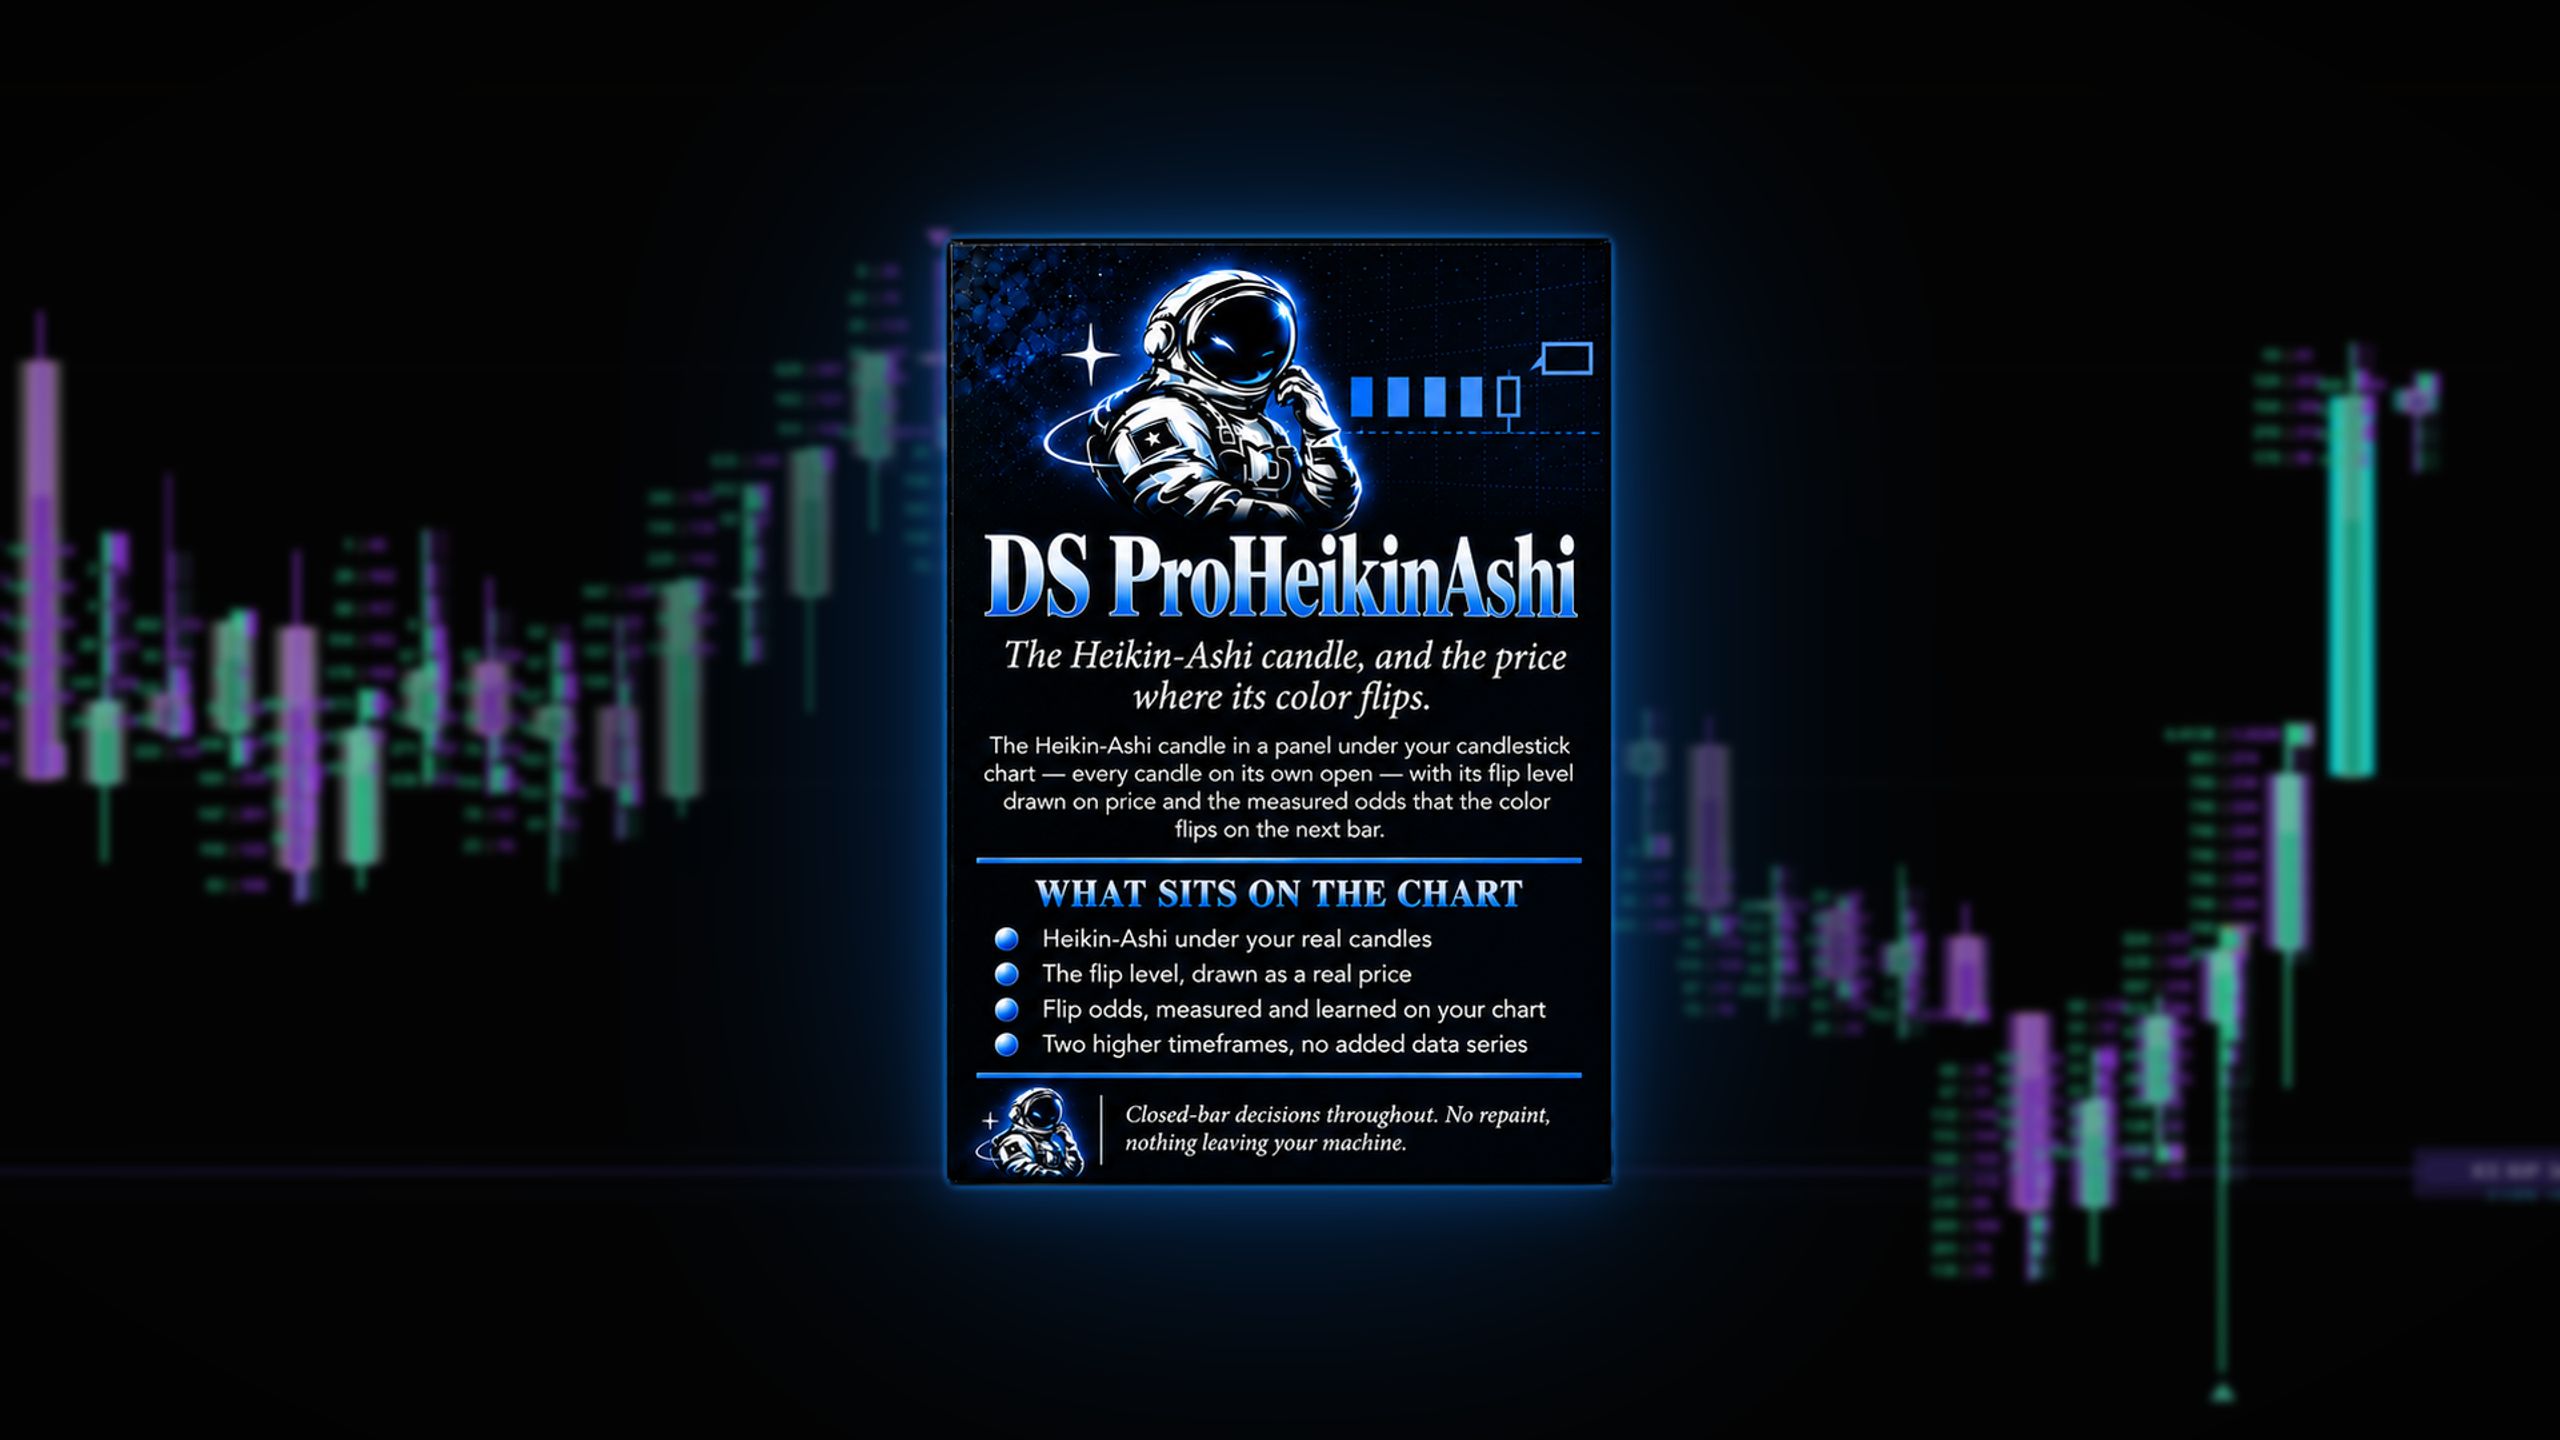
DS ProHeikinAshi leaves your candlestick chart alone and draws the Heikin-Ashi candle in a panel under it, with the one thing a Heikin-Ashi chart cannot show: the price at which its color flips.
◆ What the panel reads
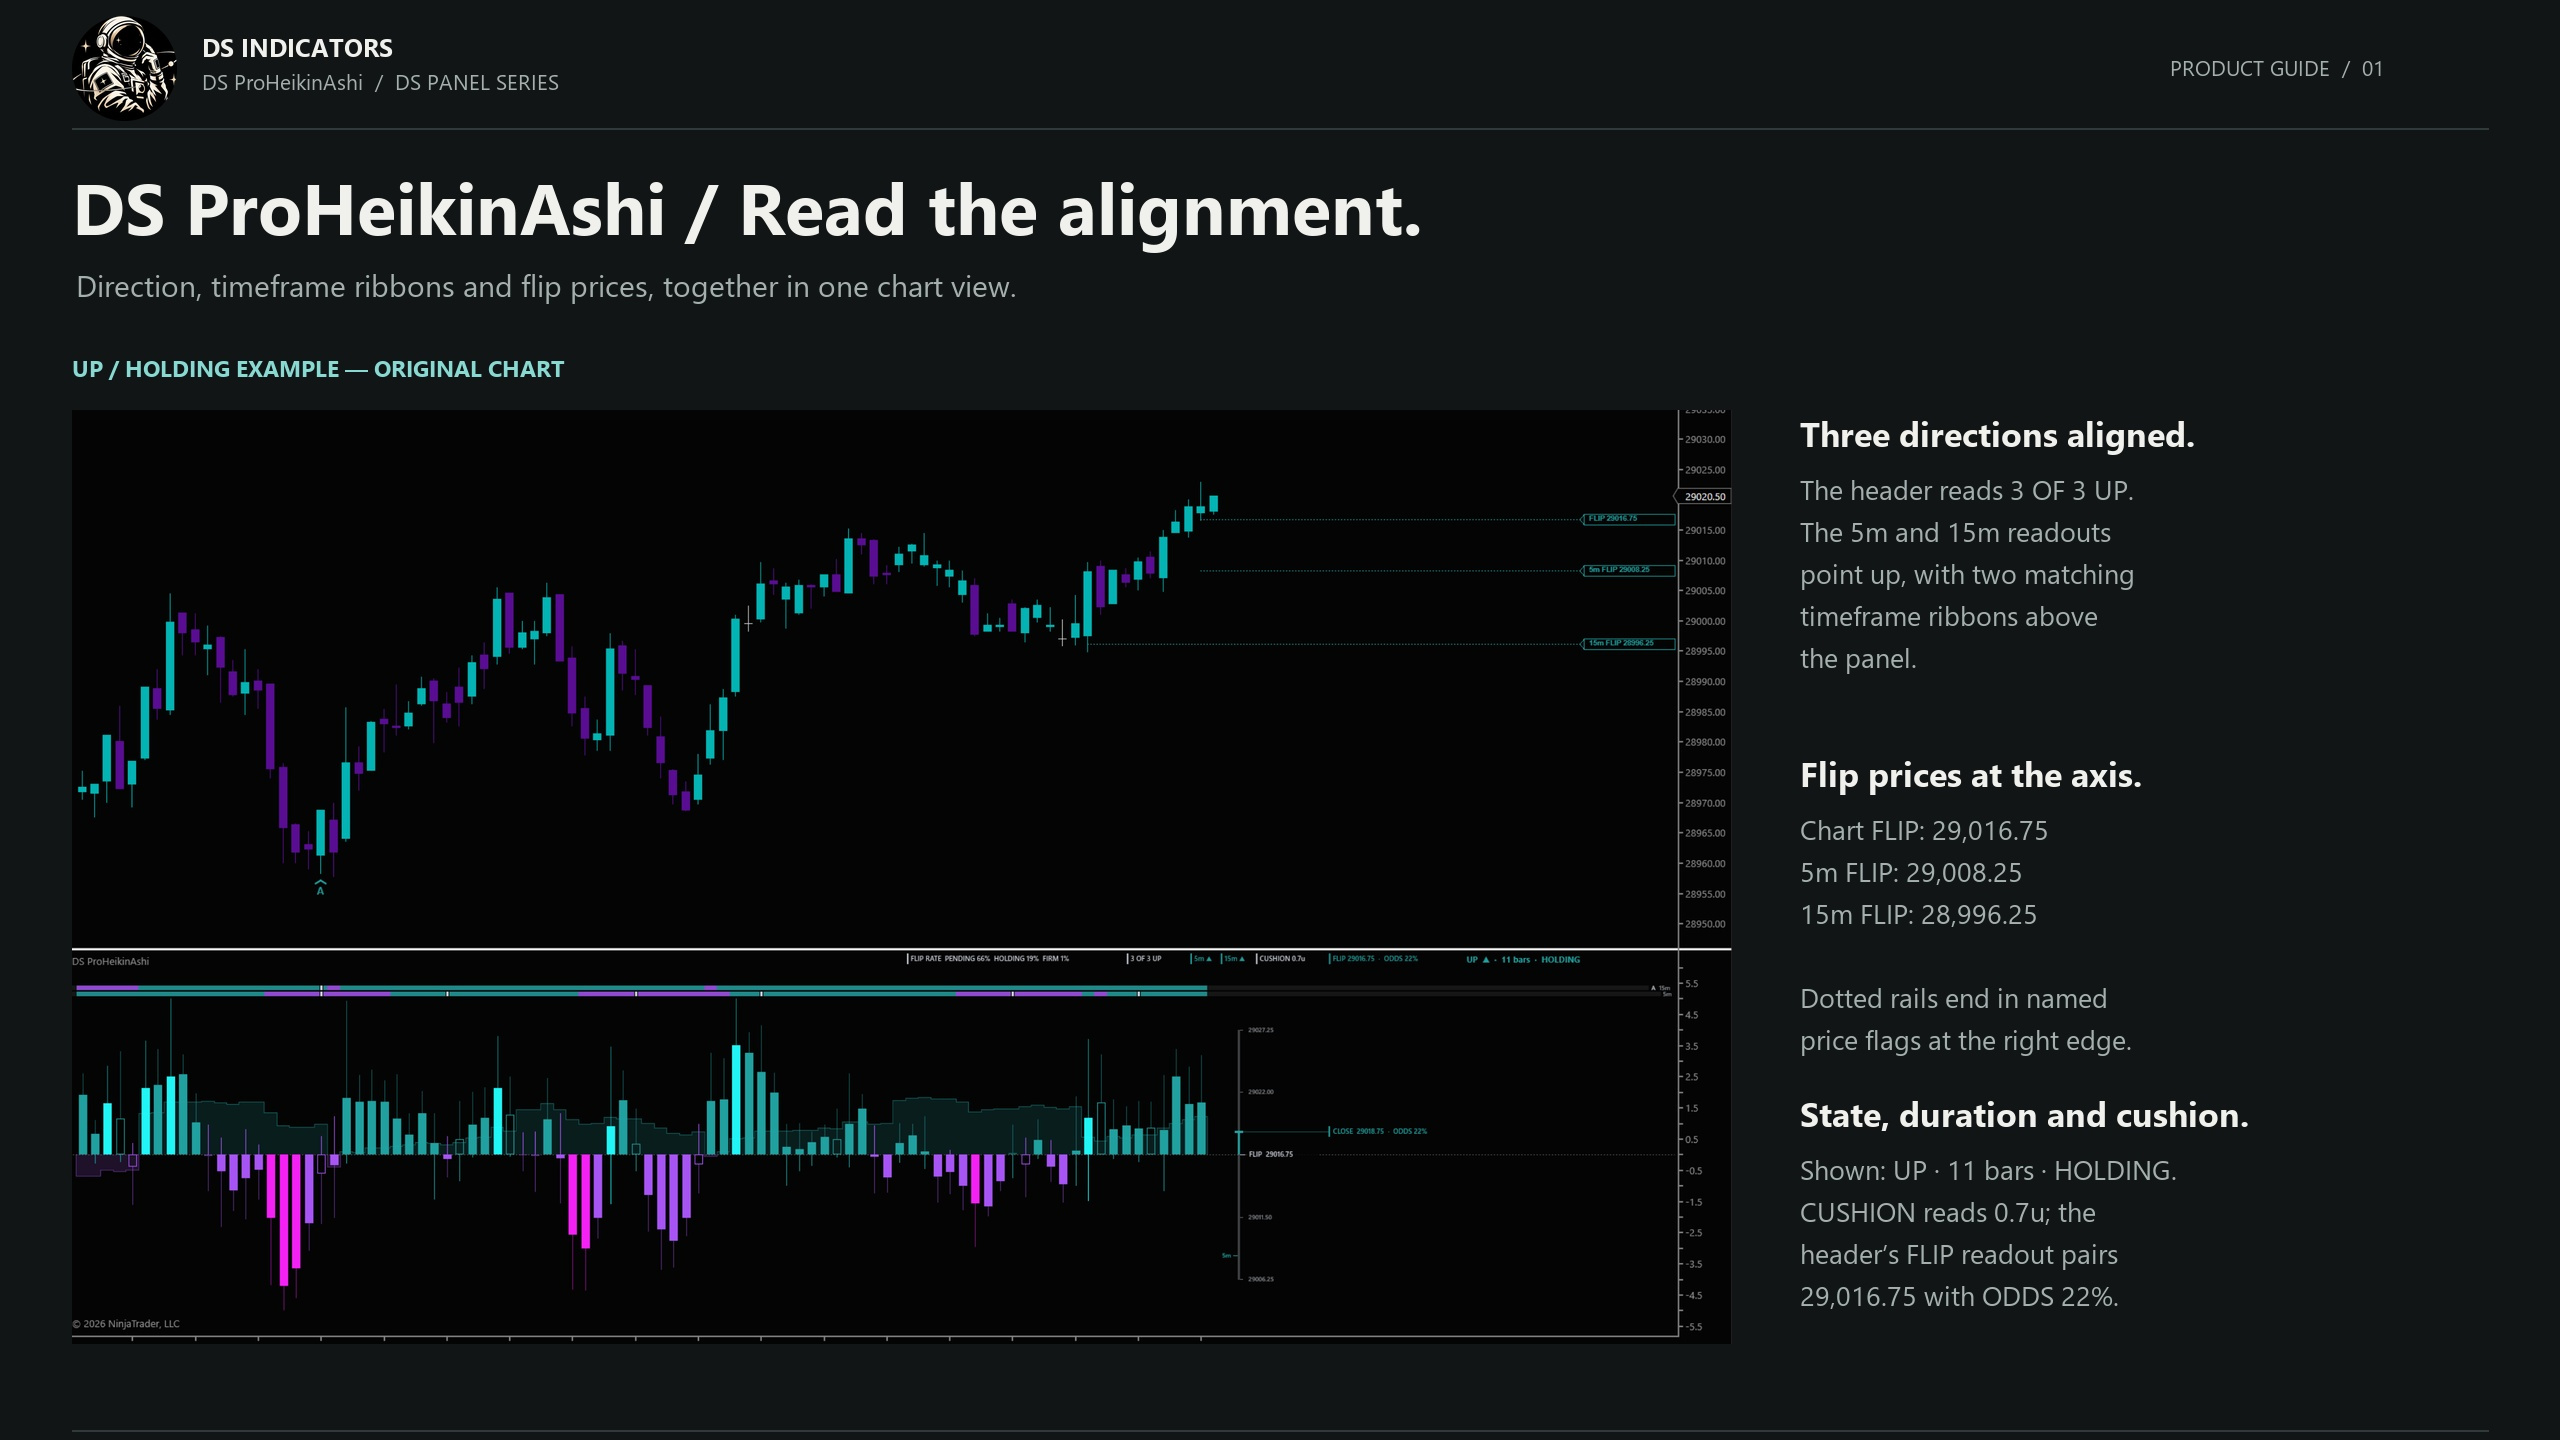
▸ FLIP LEVEL — the price the next bar’s average must finish beyond for the color to change, drawn on your price chart as a rail
▸ CUSHION — how far the close stands clear of it, in the chart’s own unit: FLIP PENDING, HOLDING or FIRM
▸ FLIP ODDS — how often a candle with this cushion flipped on the next bar, from a measured table that then learns your chart
▸ Two higher-timeframe candles as lanes, built from the chart’s own bars with no second data series
No length, threshold or sensitivity to tune. A Heikin-Ashi color describes the last few bars — measured, it did not say where price went next, and the panel is not a forecast. What can be measured is when the color ends.
Closed-bar decisions throughout — it does not repaint.
✦ ✦ ✦
Educational software, not investment advice. Futures trading carries substantial risk of loss. NinjaTrader® is a registered trademark of NinjaTrader Group, LLC — no affiliation or endorsement.