


DS ProRSI ✦ RSI Crossovers as Price Levels · NinjaTrader 8
DS ProRSI
✦ An RSI cross is a moment on an oscillator. This turns it into a level on your actual chart.
Every RSI/signal crossover is anchored to the swing that produced it, spaced from its neighbours by ATR, and left on the price panel as a level you can actually trade against.
◆ How a level behaves
▸ Tinted by how extreme the RSI was the moment it was born
▸ Labelled with the exact RSI reading and a live touch count
▸ Frozen to a thin grey trace the instant price closes through it
▸ The panel’s Y-axis locks, so dragging the chart can never distort the read
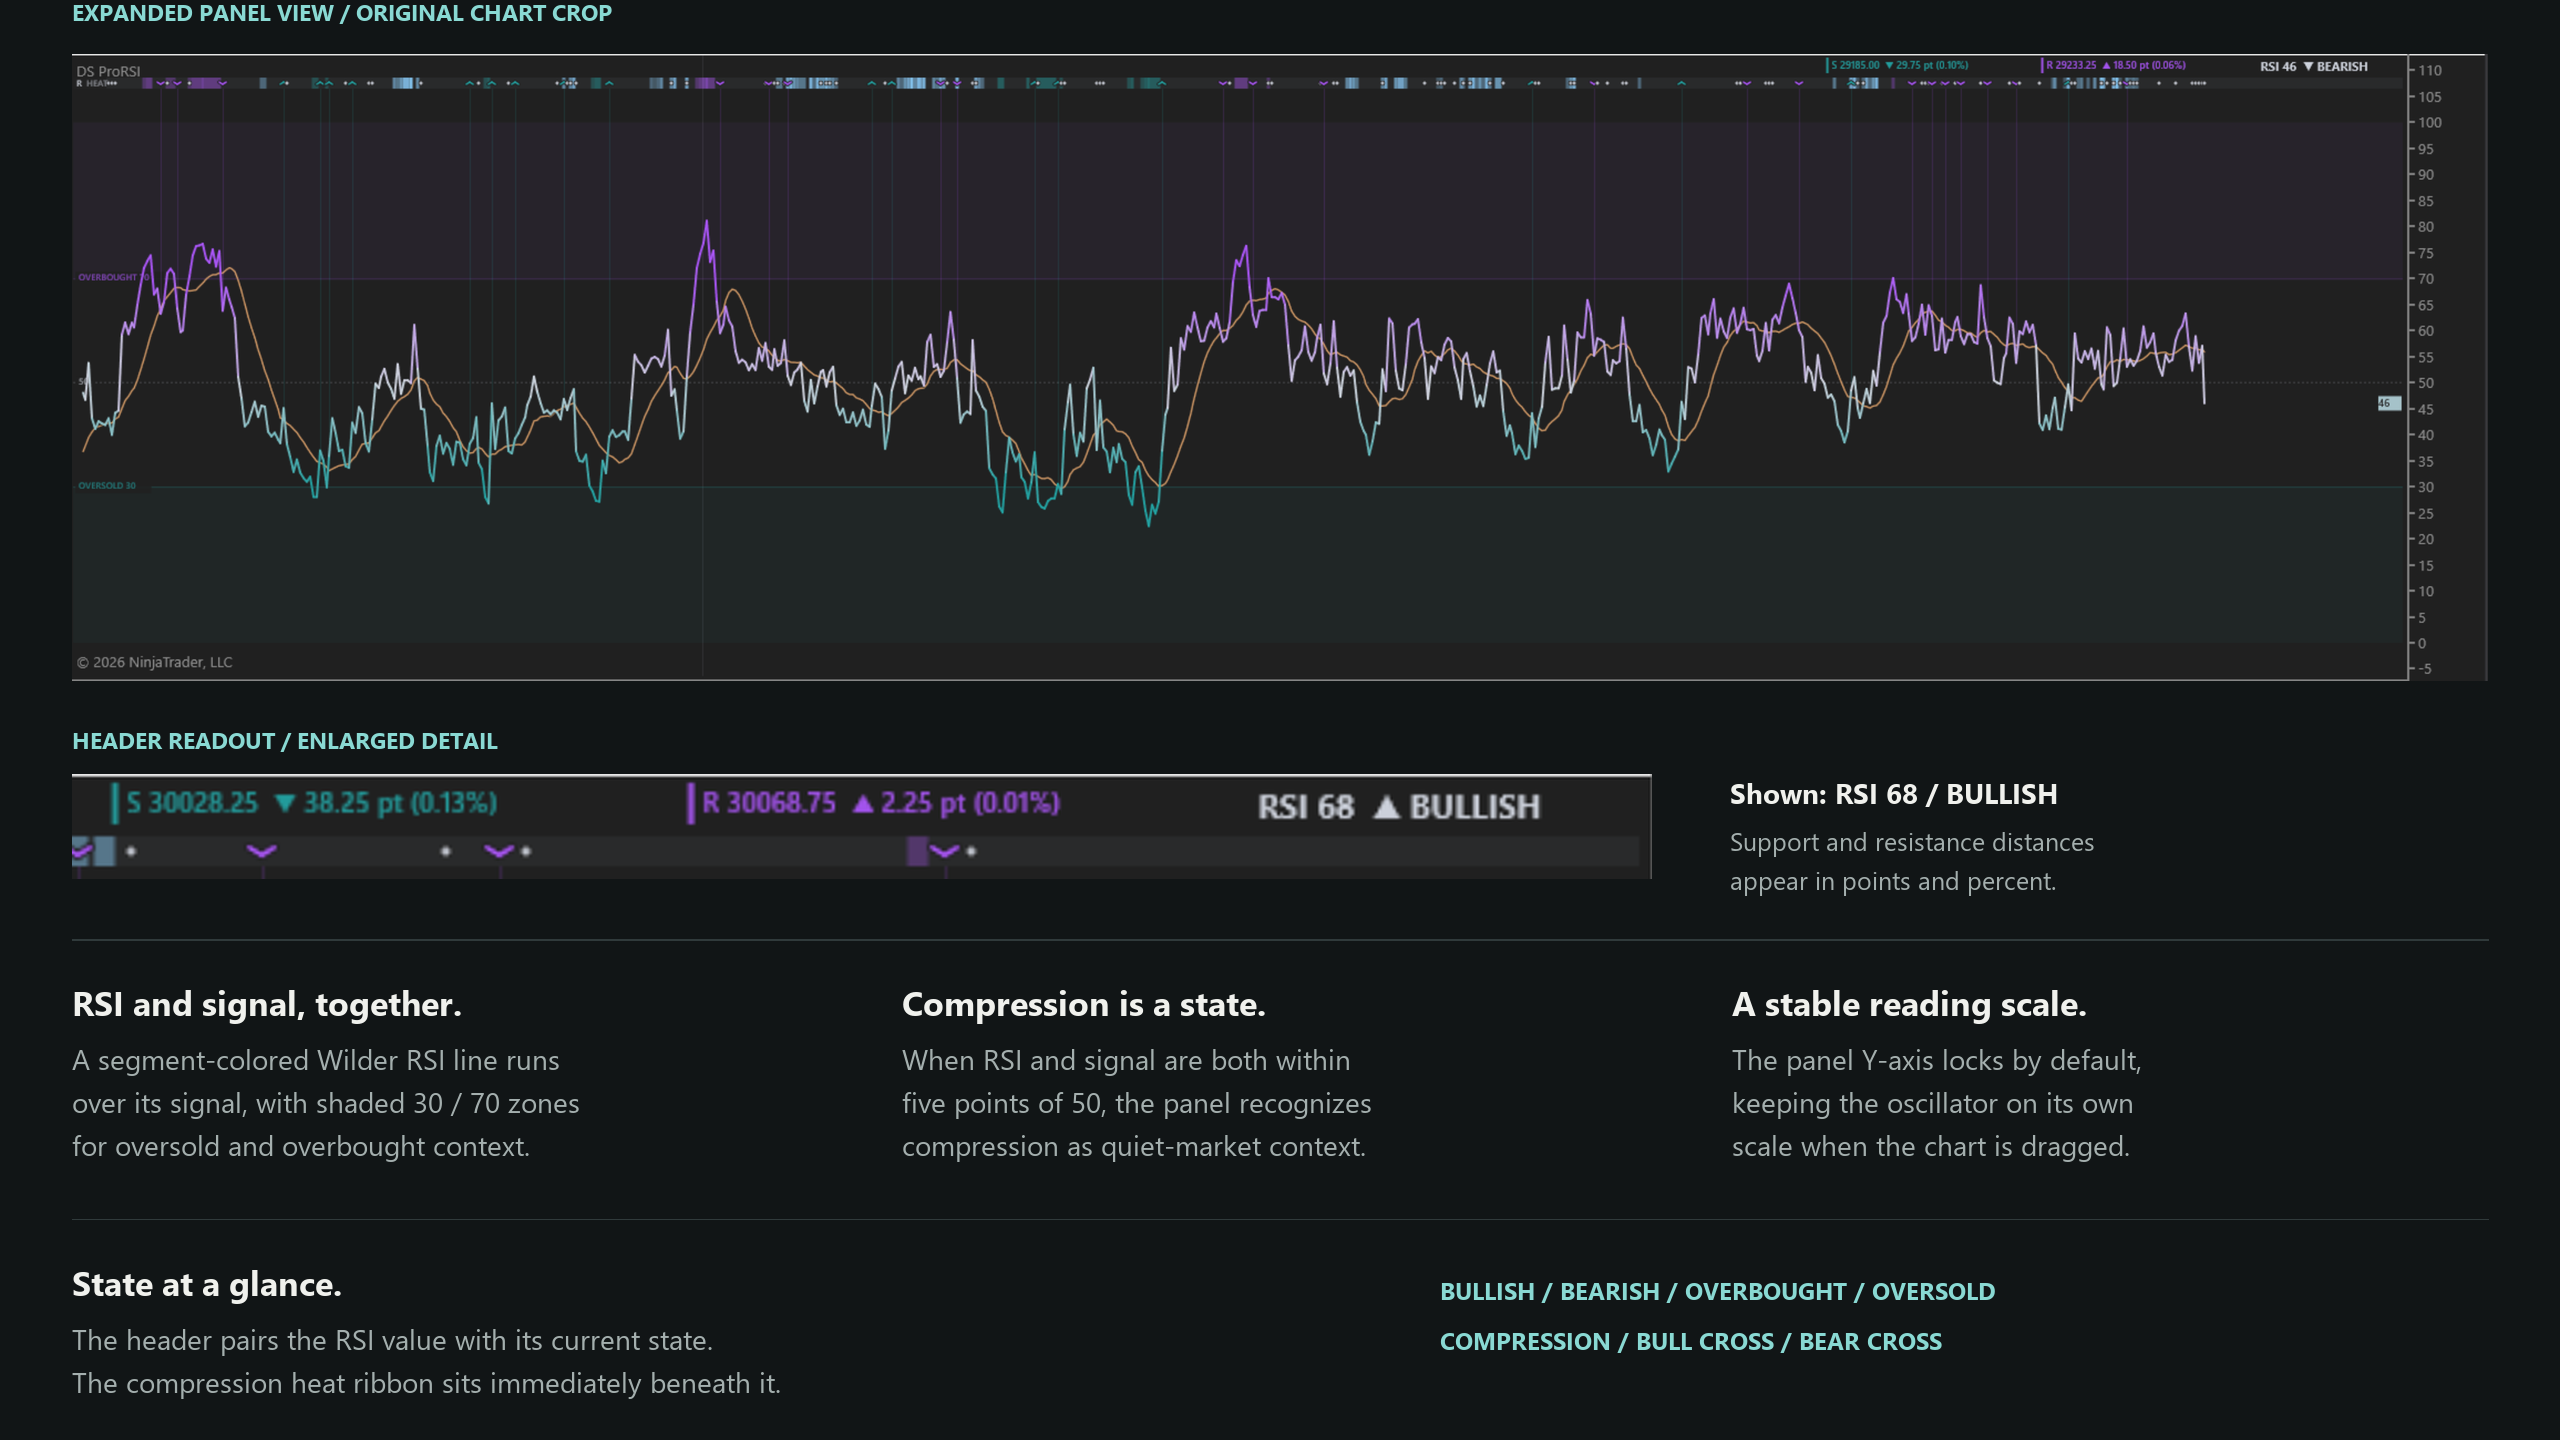
Underneath, a full RSI panel: heat ribbon, shaded 30/70 zones, a segment-coloured line, and the nearest support and resistance distance in points and percent.
Closed-bar decisions throughout — it does not repaint.
✦ ✦ ✦
Educational software, not investment advice. Futures trading carries substantial risk of loss. NinjaTrader® is a registered trademark of NinjaTrader Group, LLC — no affiliation or endorsement.