
Dynamiflow (NinjaTrader 8)
Dynamiflow
DynamiFlow is a chart indicator for NinjaTrader 8 that reads order flow itself, book depth and transactions, so it needs a data feed with market depth.
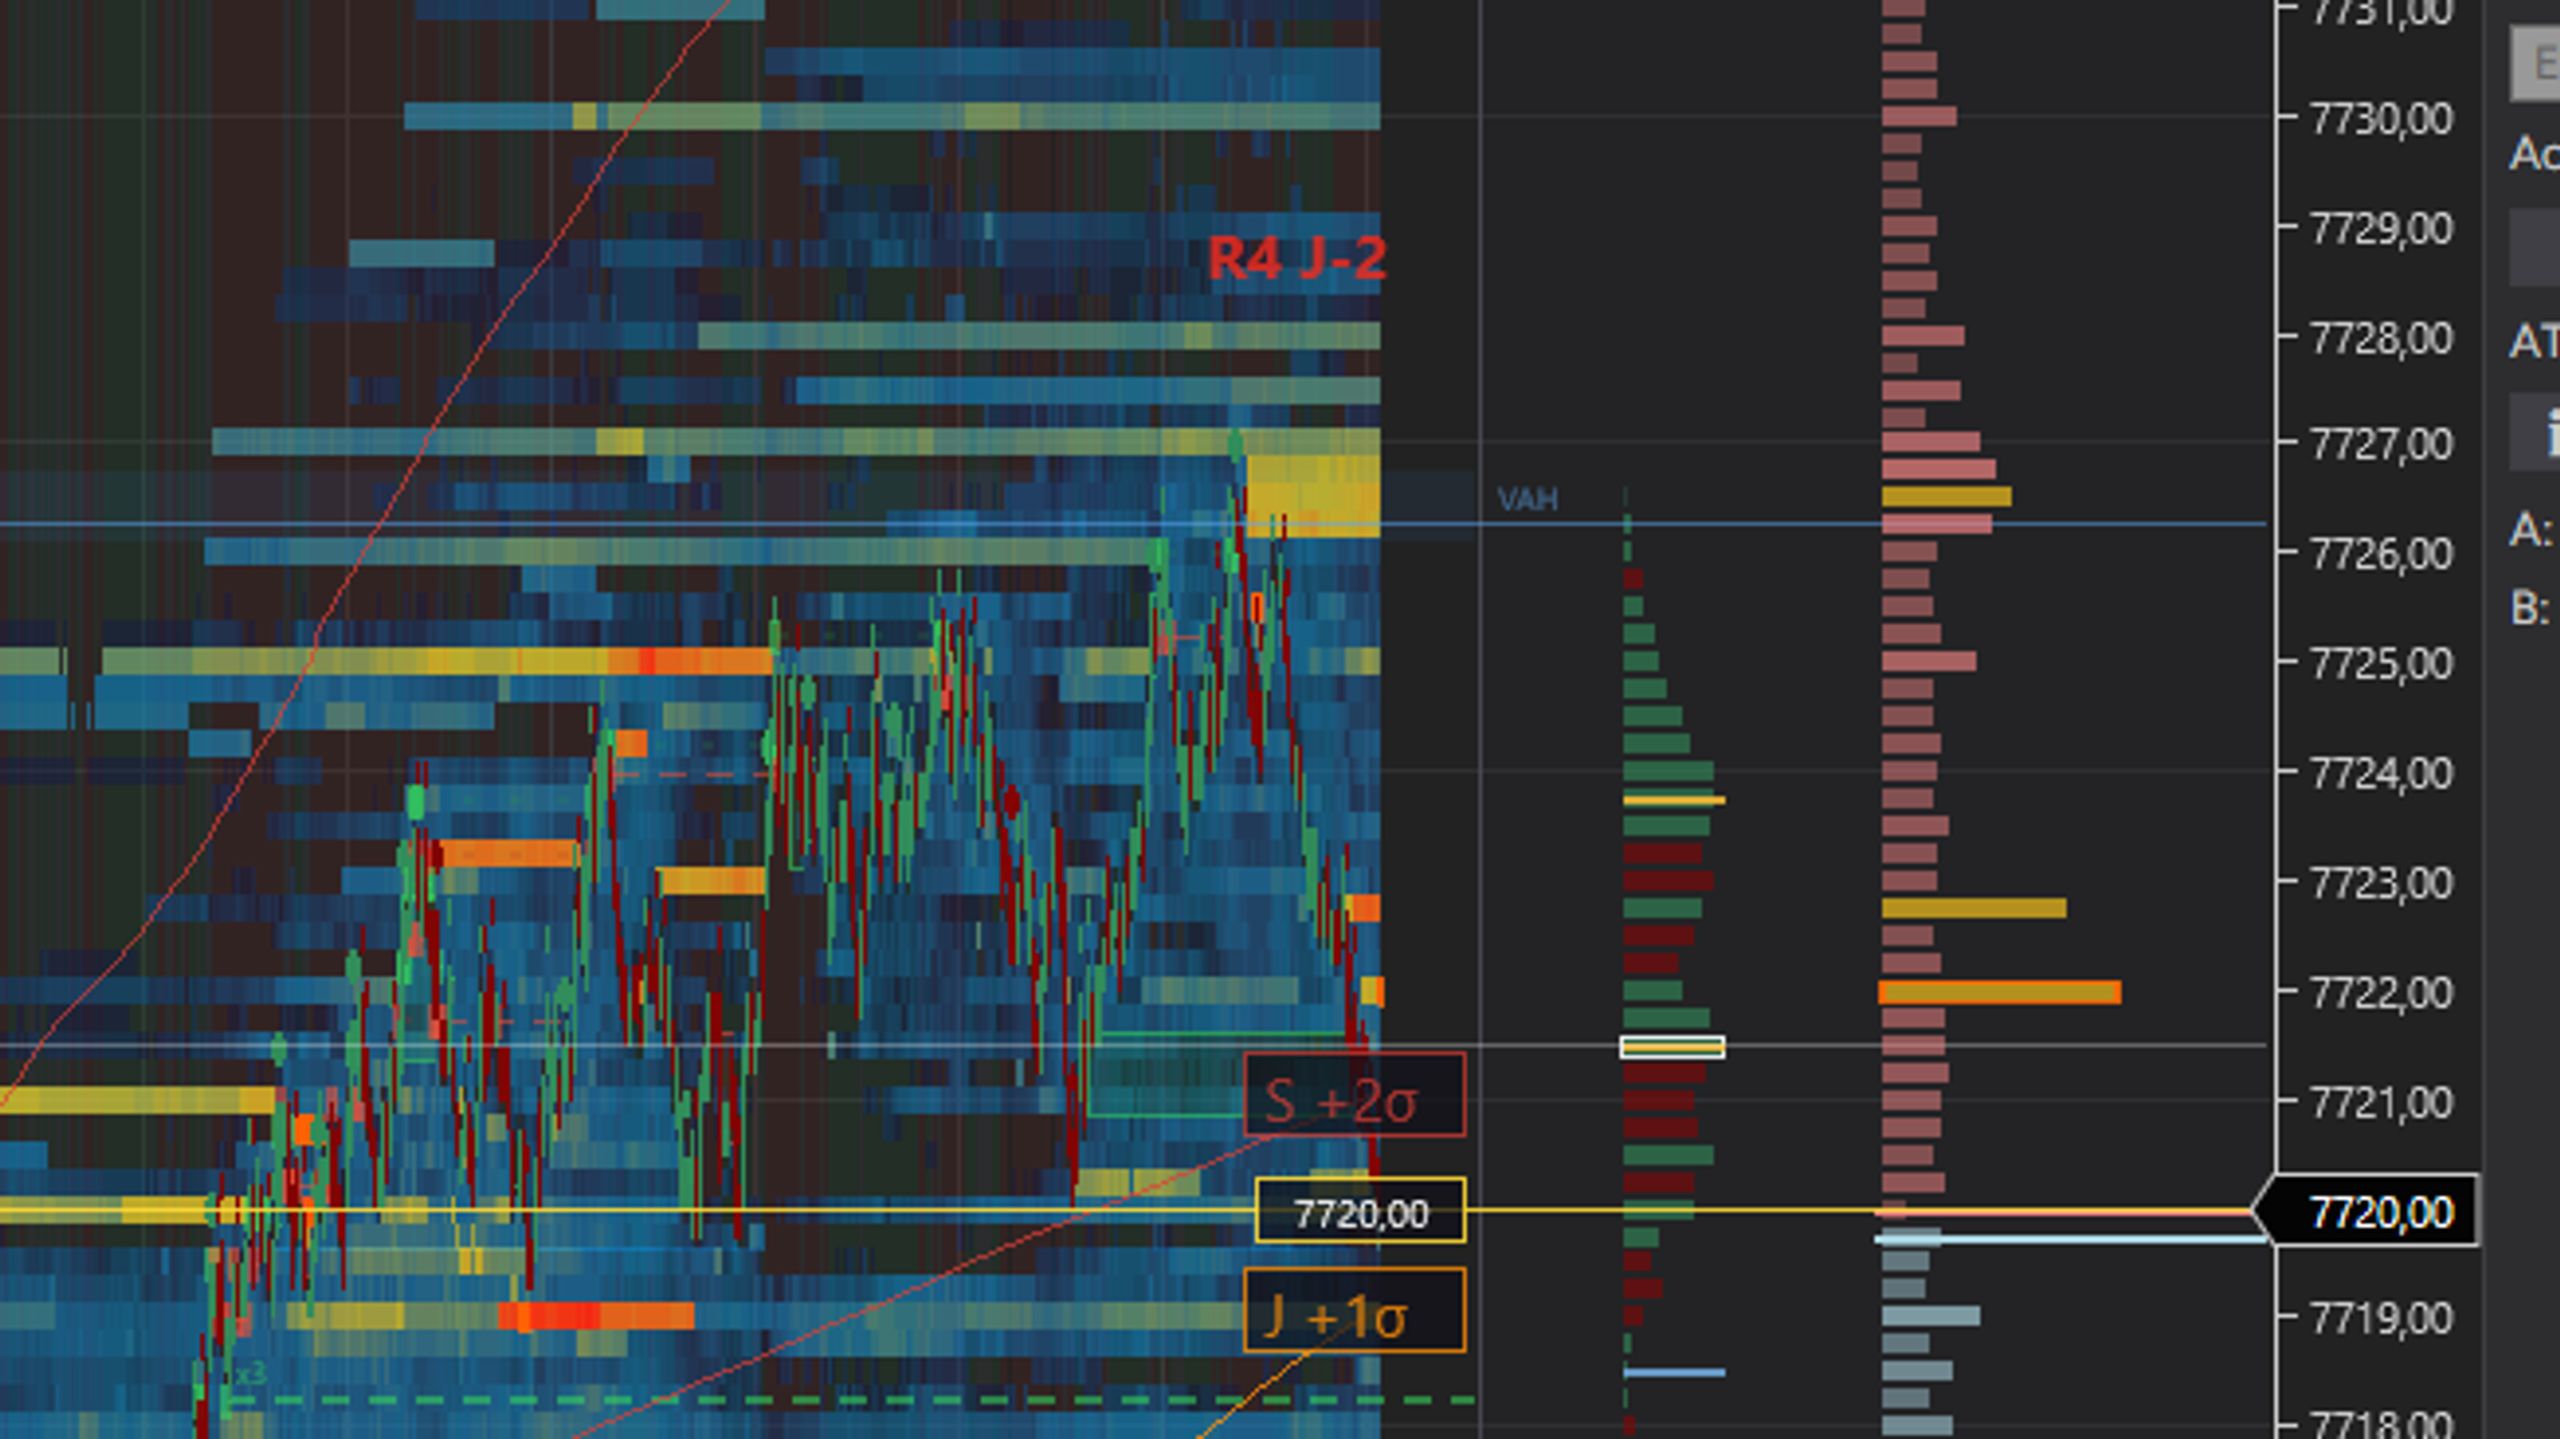
The heatmap shows resting orders, one column per candle, one cell per tick, with a visibility threshold that sets itself from the last sixty seconds.
The footprint marks imbalances: two stacked ones open a zone that extends until price covers half of it, and three candles defending the same price within two ticks draw a counted rail.
Volume profile on the left with POC, 70% value area, HVN and LVN nodes; live book on the right; untouched nPOC, nVAH and nVAL stay until price reaches them.
Three VWAPs, daily, weekly anchored to Monday and monthly, each with two standard deviation bands, plus hosted Camarilla levels over five sessions.
The dashboard sums up in seven lines, in real time, who is pushing and how hard: session CVD, bar delta, aggression over 5 and 15 minutes, last block, toxicity and regime, distance to the next zone.
The book survives a chart close: every bar records its column locally, up to five days replay on open, and live capture always takes over.
Context bands at the bottom are drawn by DynamiFlow Panels, a second indicator shipped with it and covered by the same key.
Large block, attack, wall and absorption each have a sound, with anti-burst delay and optional Windows voice.
No arrows, no buy or sell signals: it describes the flow and leaves the decision to you.