Daye's QT Time Levels
Daye's QT Time Levels
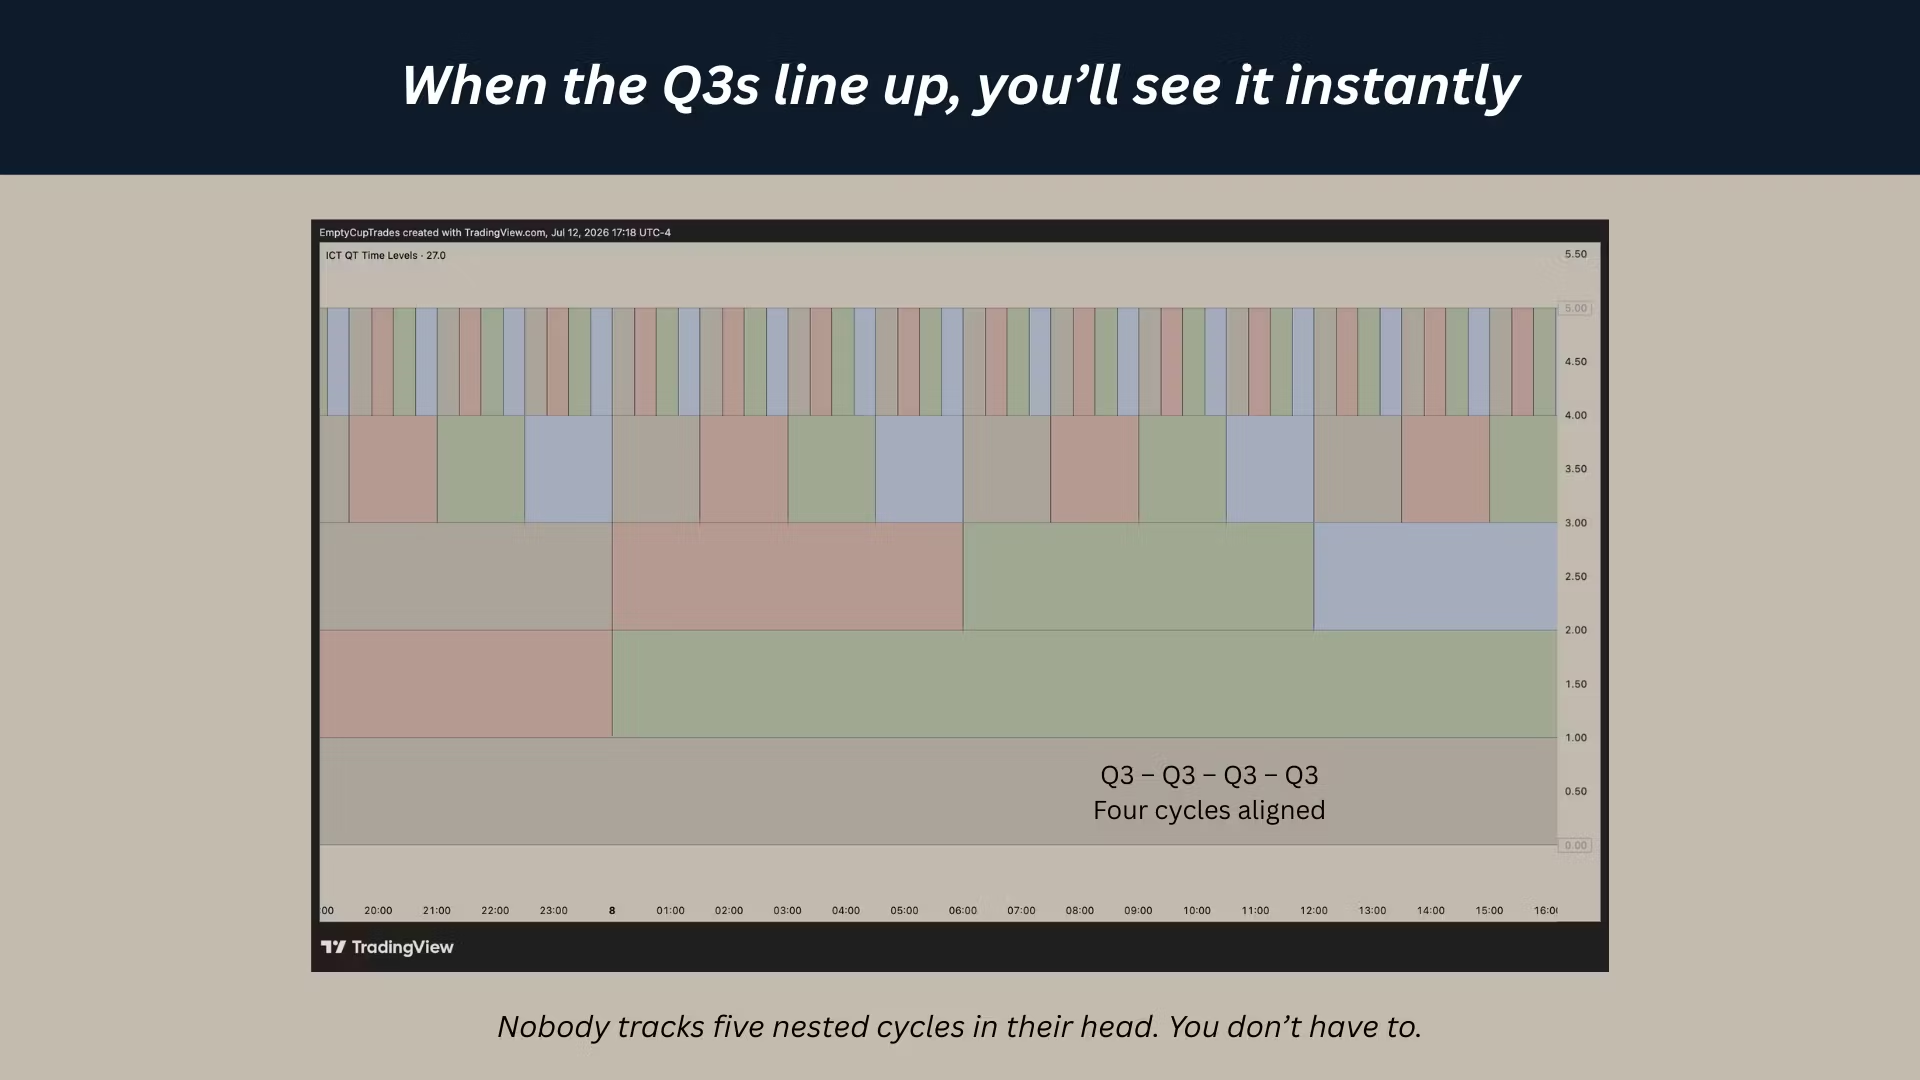
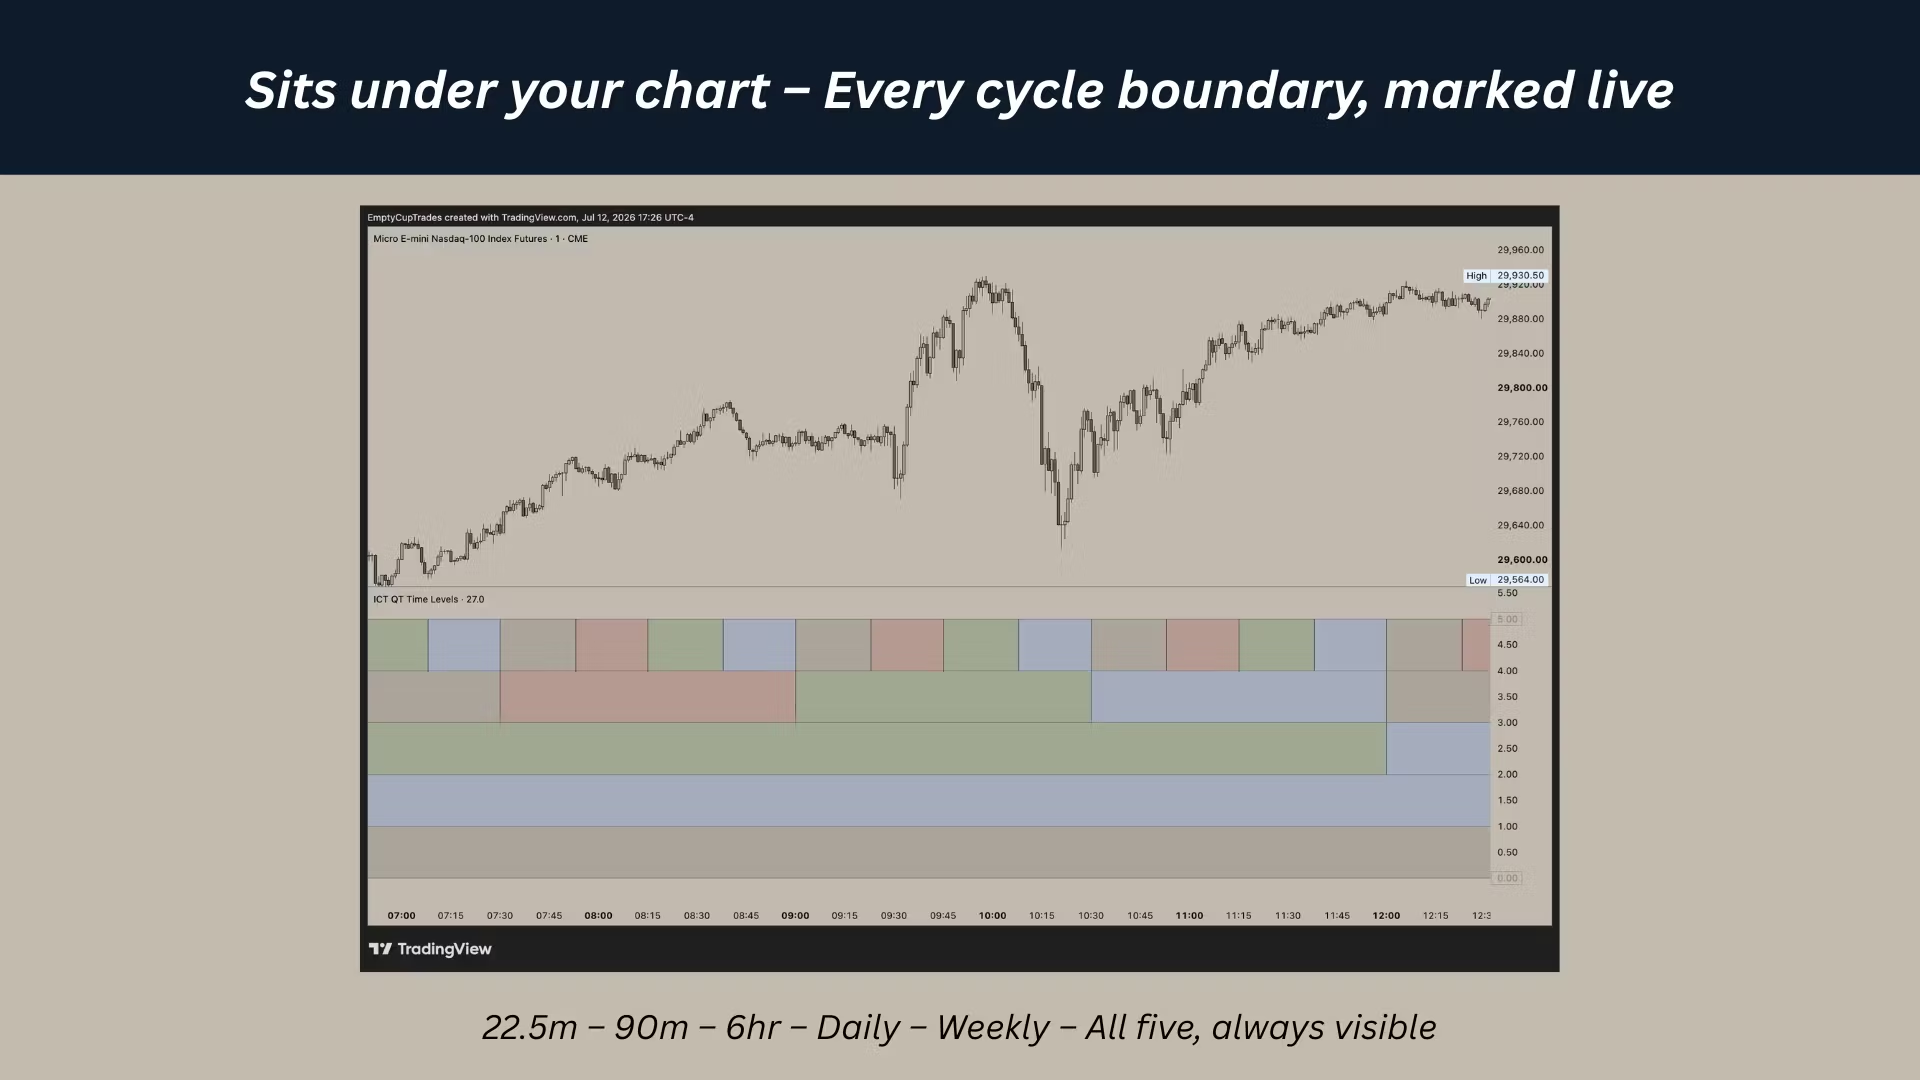
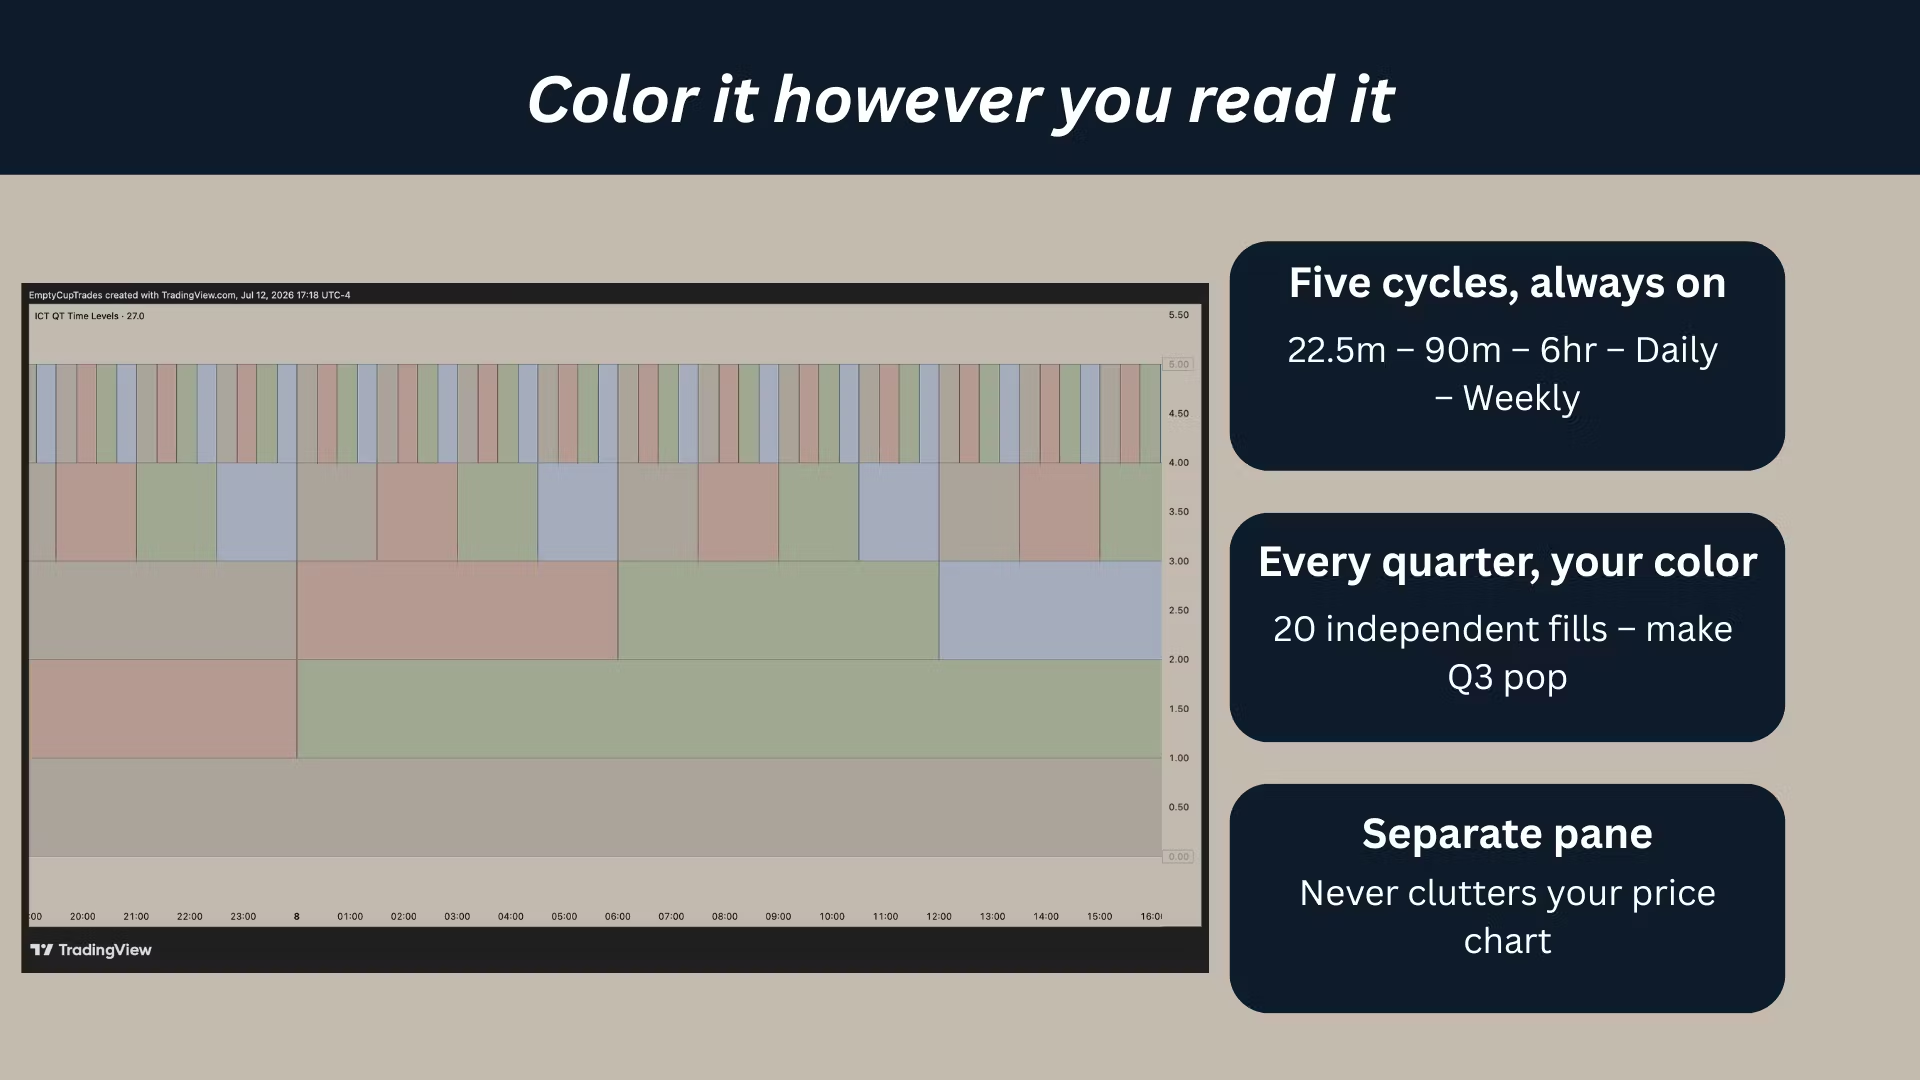
Plots three independent layers of time-based vertical divisions on a panel below your chart — lines every 22.5 minutes, every 90 minutes, and every 6 hours. Every key quarter theory time boundary visible at a glance.
All three period indices are calculated from milliseconds elapsed since New York midnight, keeping every layer synchronized to the same origin on any chart timeframe. Each layer fires once at each boundary crossing and draws in its own visual band — 22.5 minute lines in the top band, 90 minute in the middle, 6 hour in the bottom — so all three fractal levels are readable simultaneously without overlap.
When a key price level and a time level converge you have your highest probability setup. Combine with Quarter Theory True Open for the complete framework.
*Update: Made the individual quarters of each quarter cycle color customizable.
Full setup guide and exact settings: https://youtu.be/6yeSQxhyUyw
- 15 days ago