
Expected Move Cone
How far the options market expects price to move, on your own TradingView chart
Know how big a move the options market is pricing, before the open.
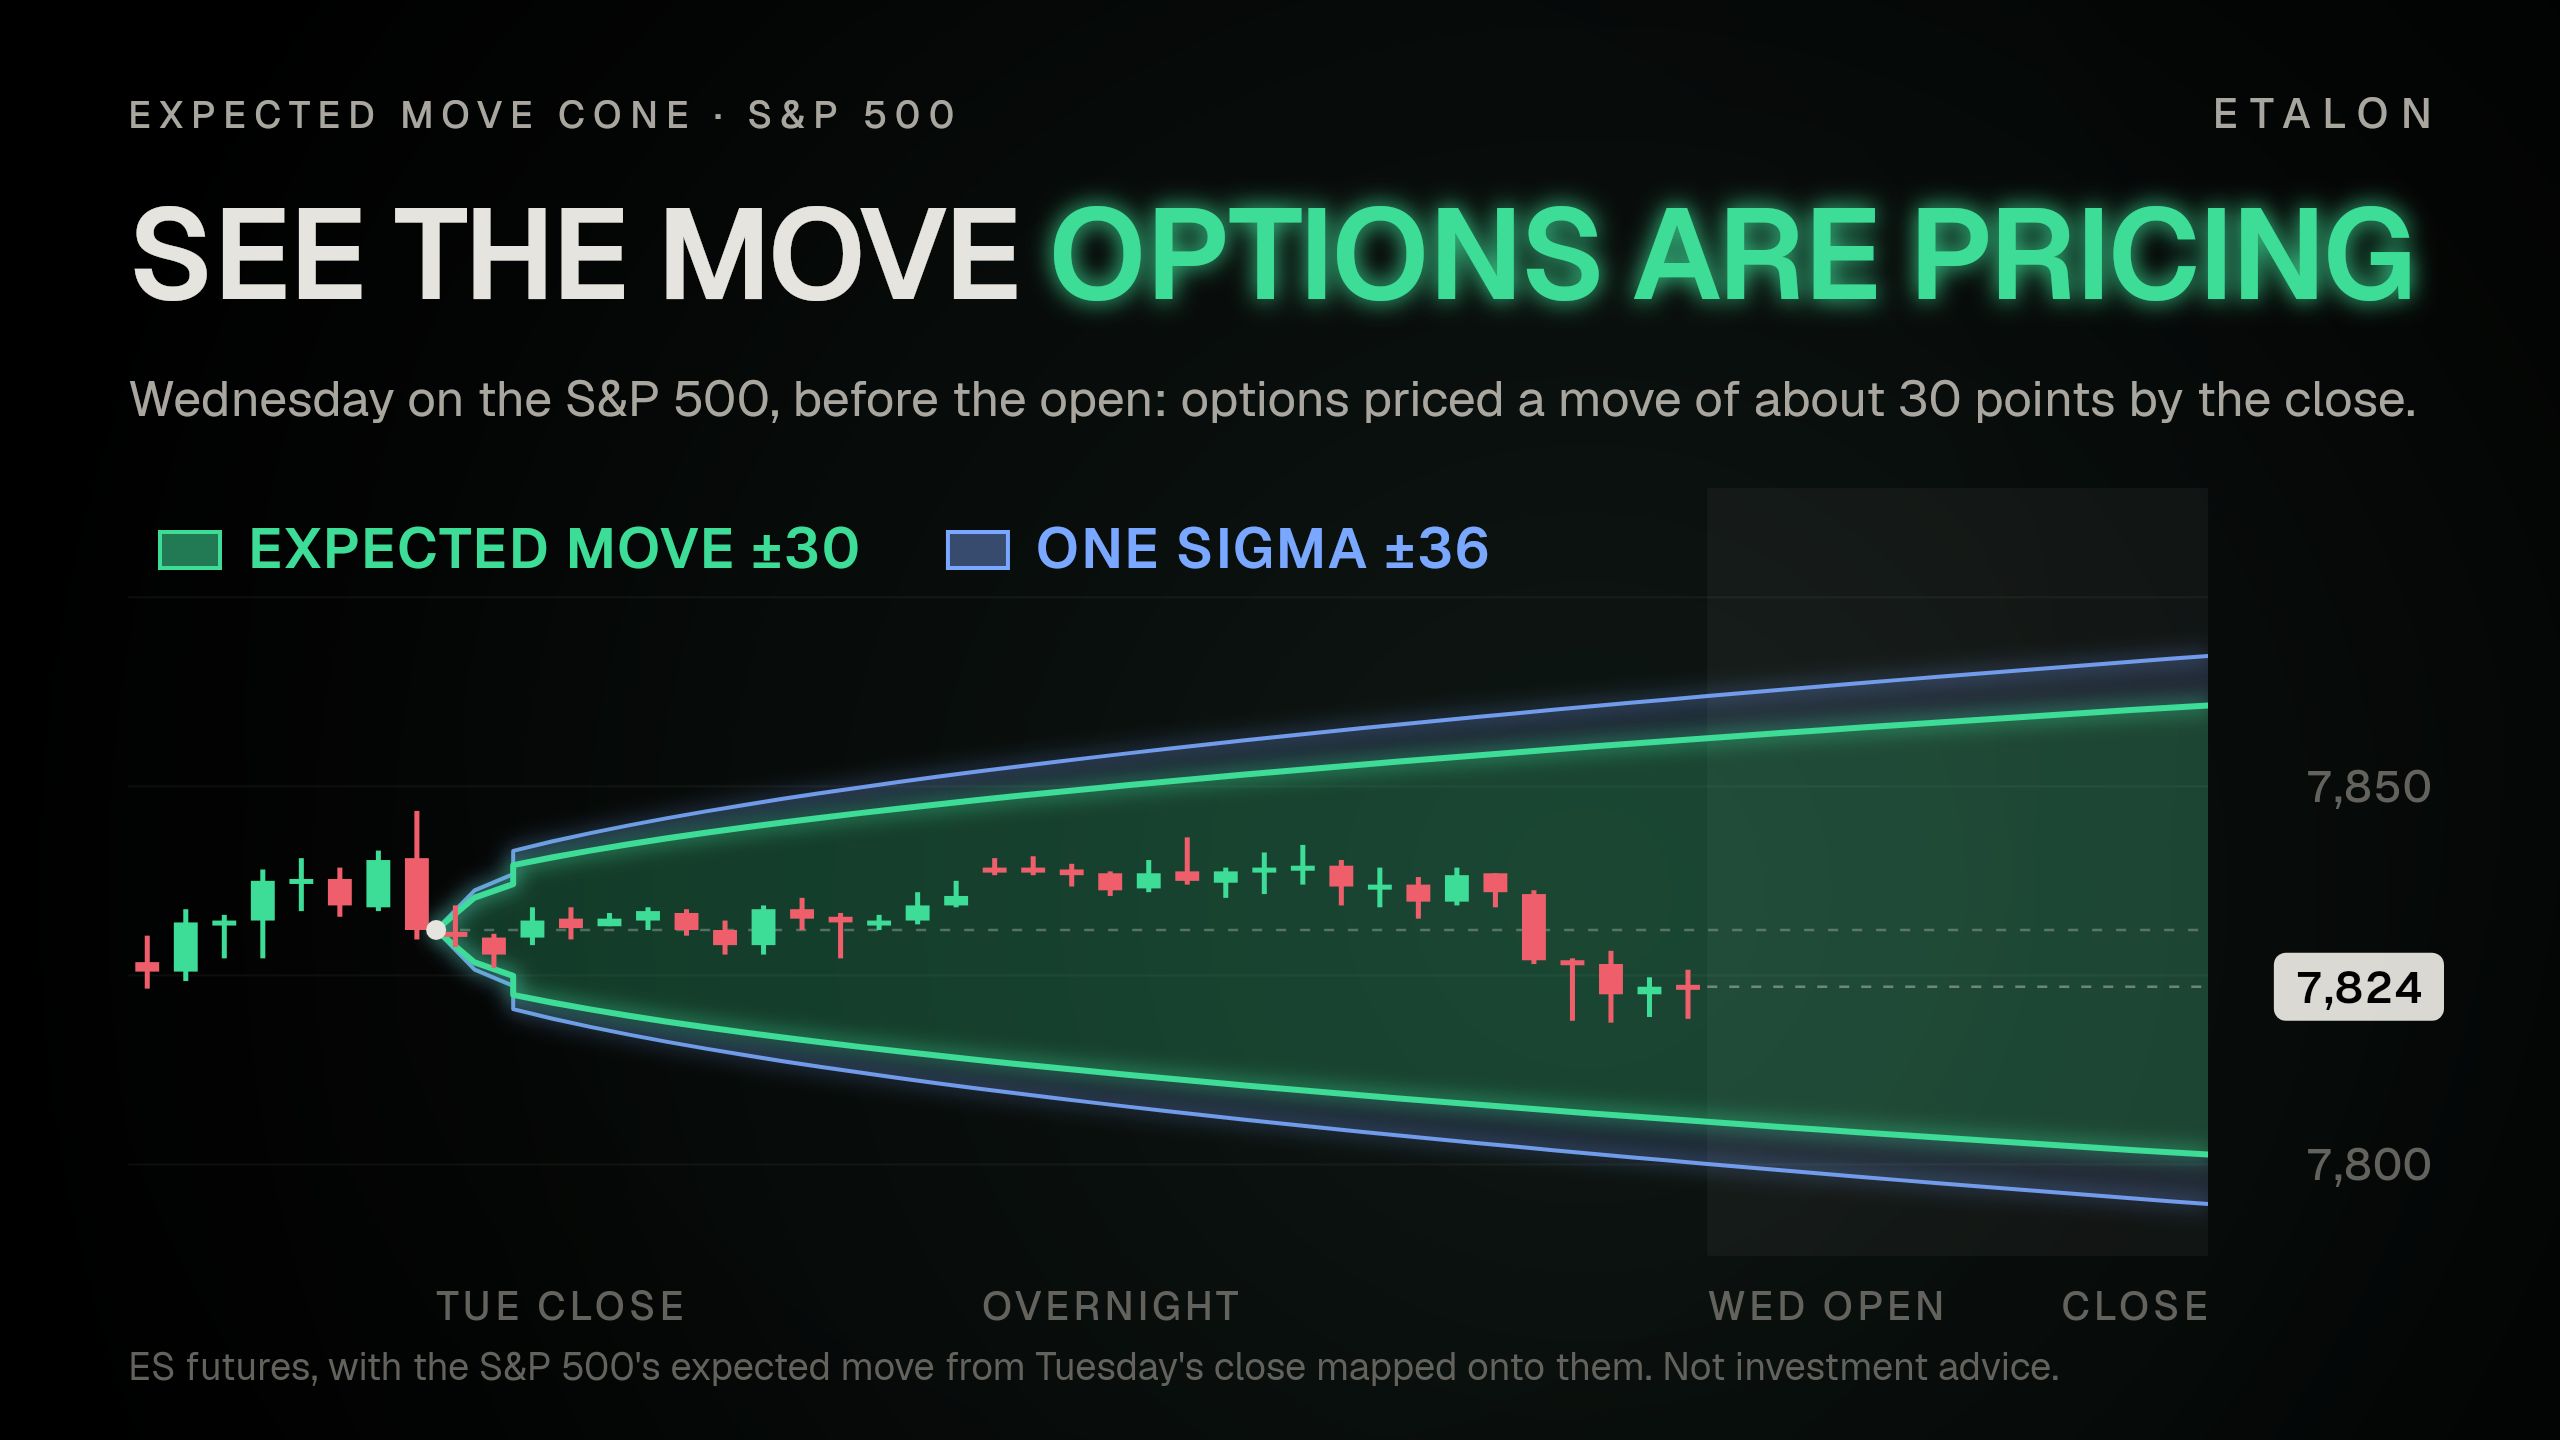
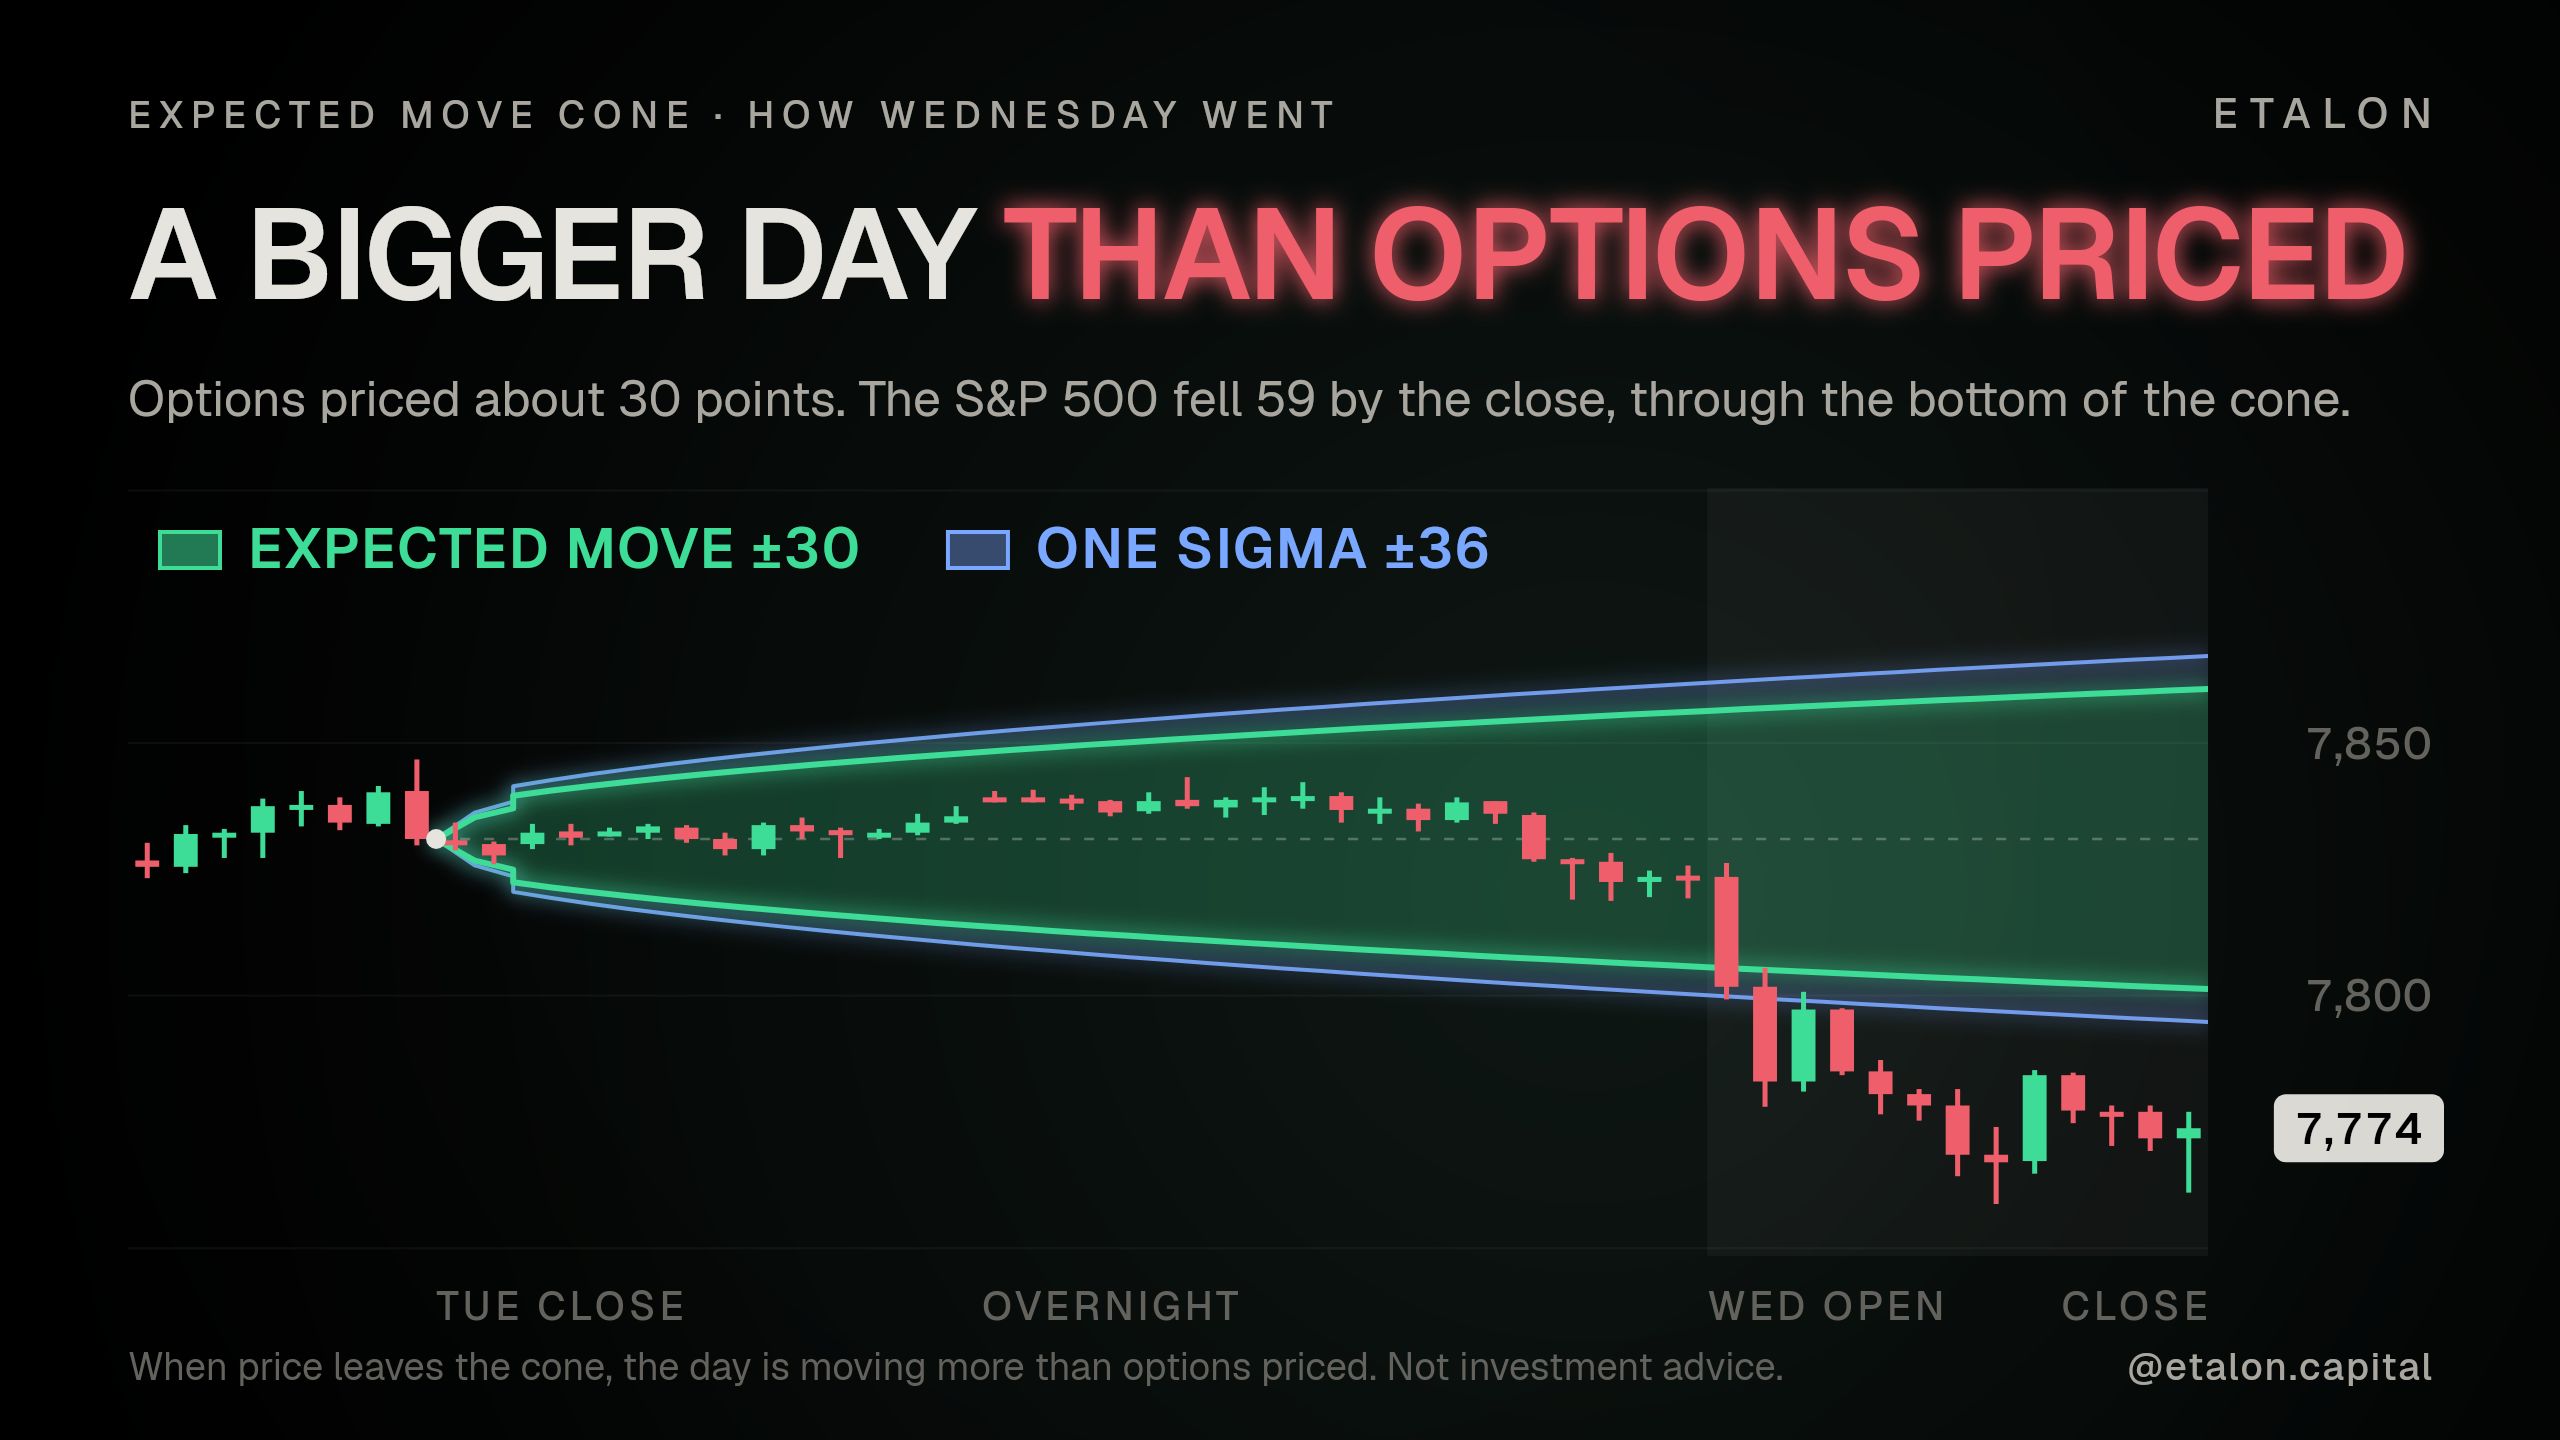
The cone is the expected move: the size of the move options are pricing, up or down, by expiry. It comes from real options quotes, not a volatility index or a guess from past moves. When price leaves the cone, the market is moving more than options priced.
On your TradingView chart:
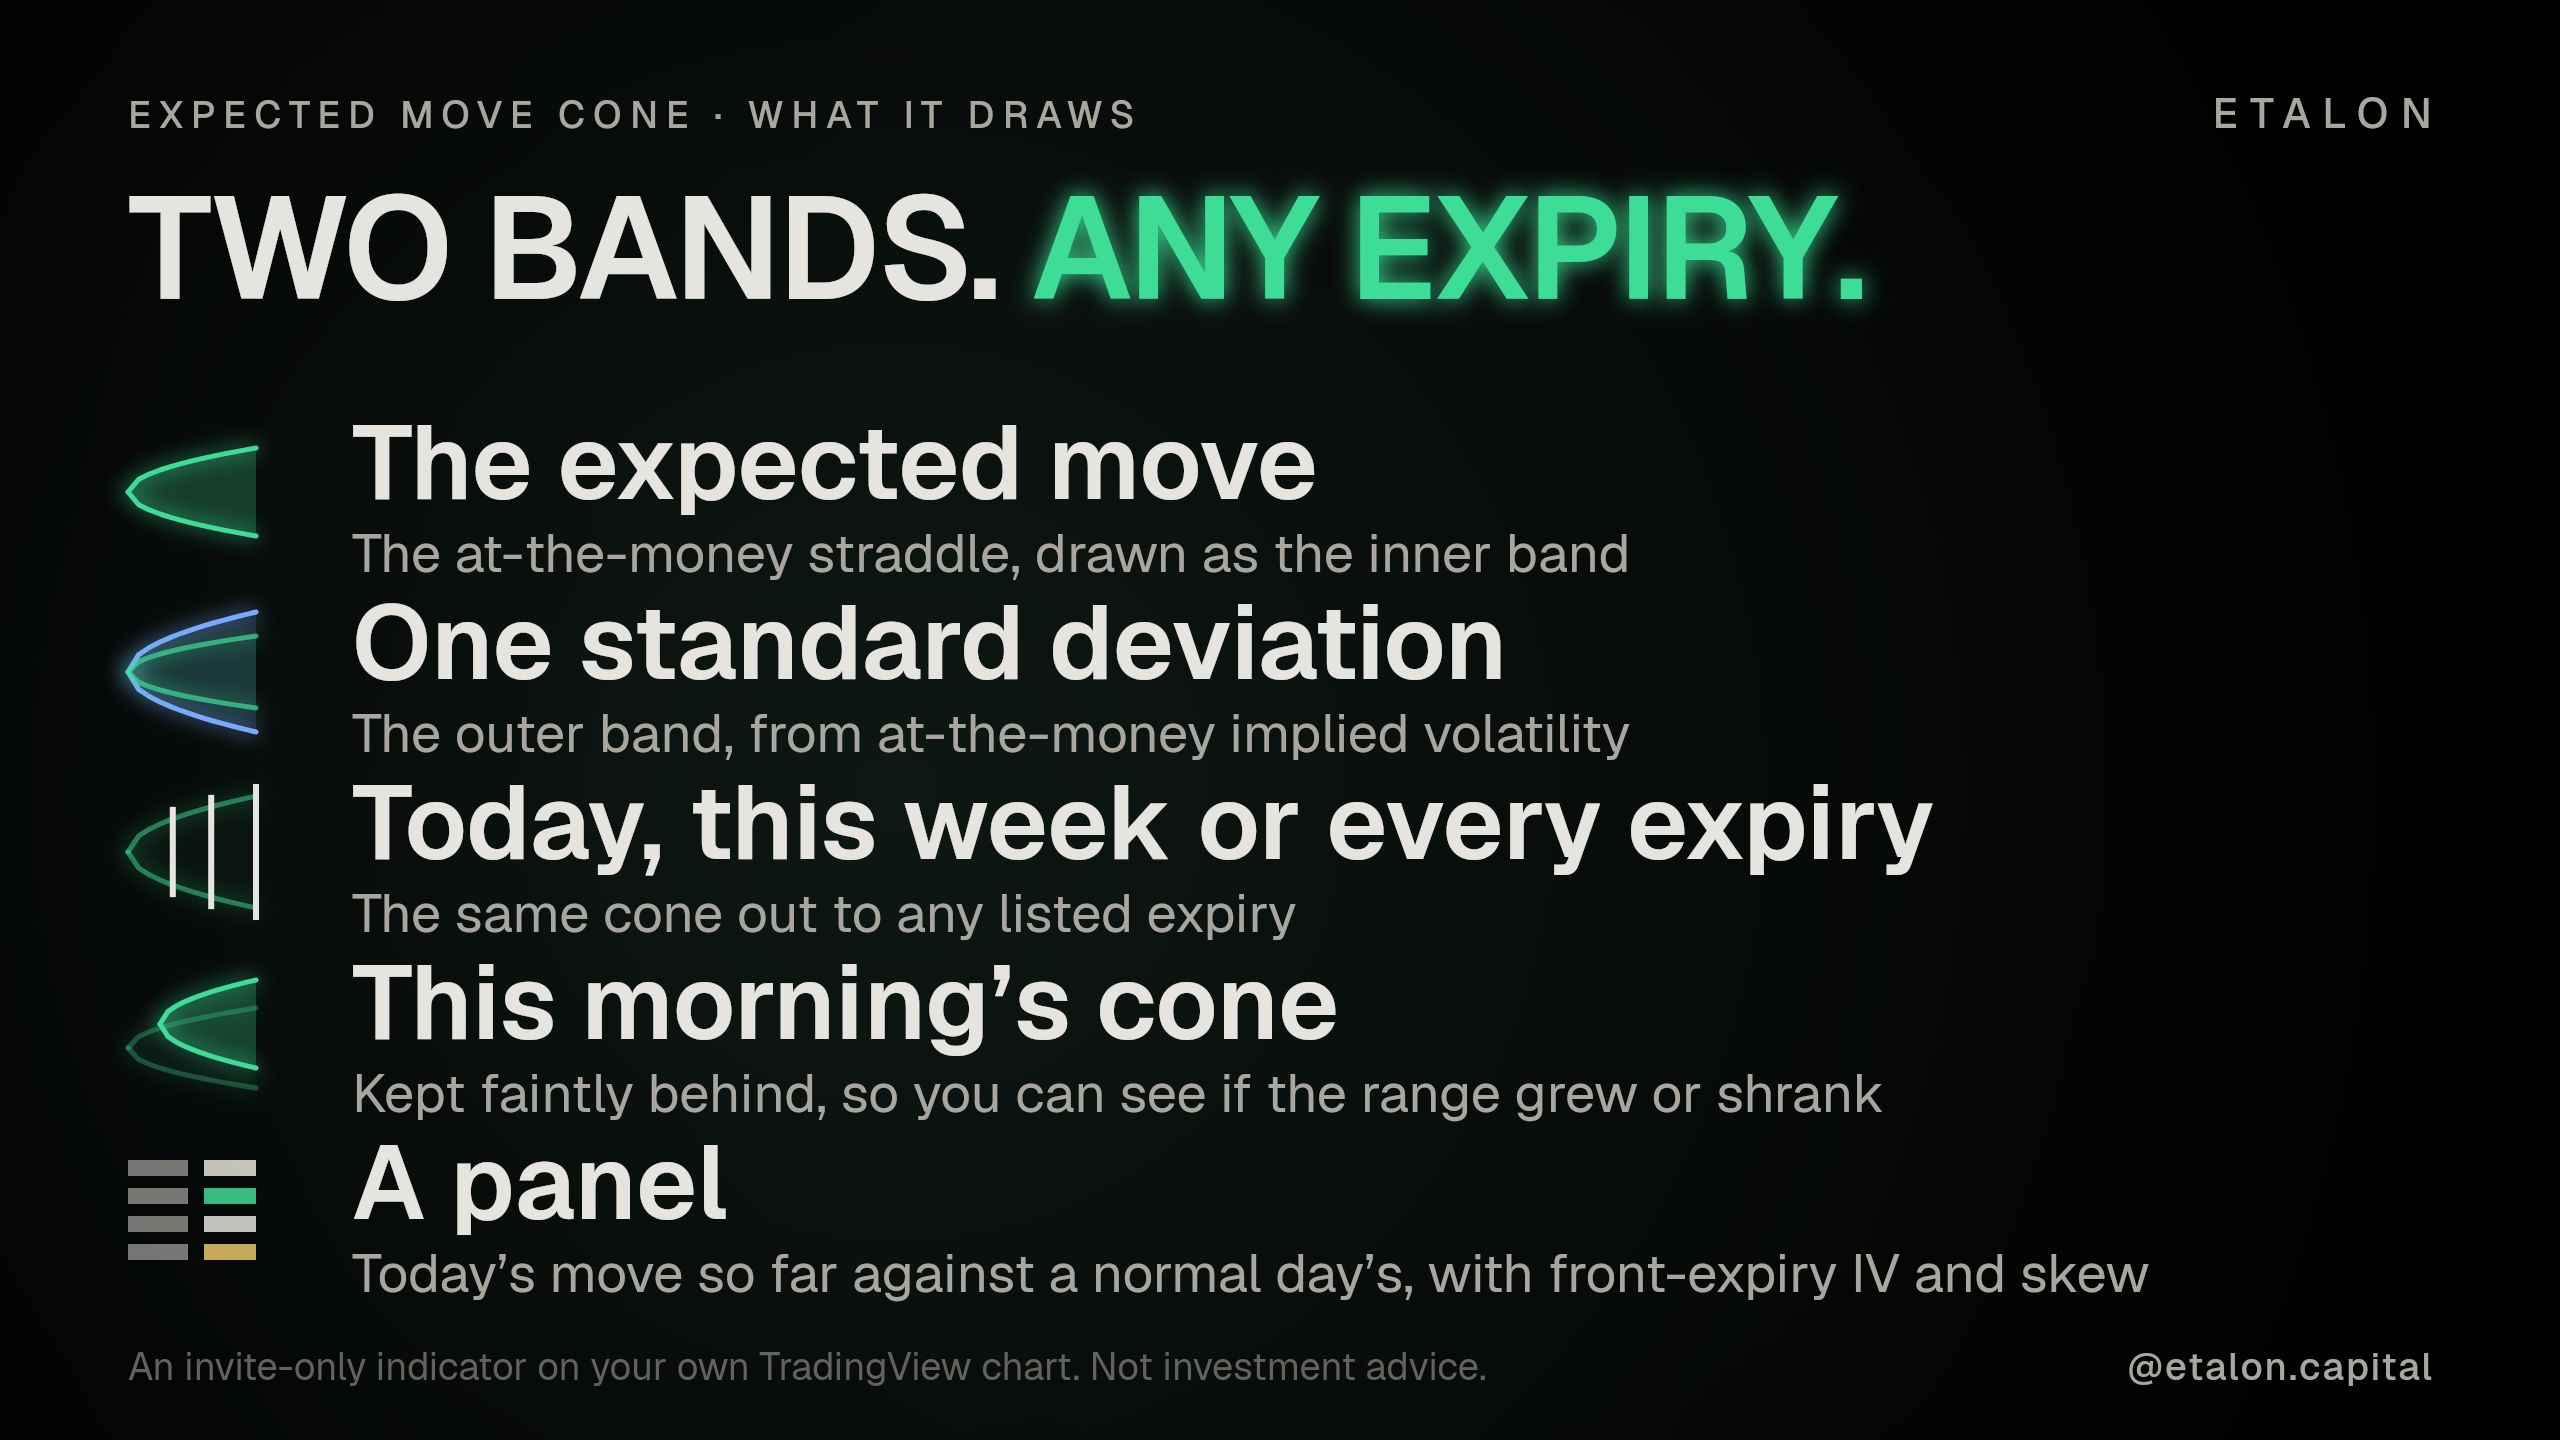
- Two bands: the expected move from the at-the-money straddle (inner) and one standard deviation from implied volatility (outer).
- Today (0DTE), this week, or every listed expiry.
- The 16- and 25-delta strikes for each expiry.
- This morning’s cone, kept faintly behind the current one, so you can see if the range has grown or shrunk since the open.
- A panel with today’s move so far against a normal day’s, plus front-expiry IV and skew.
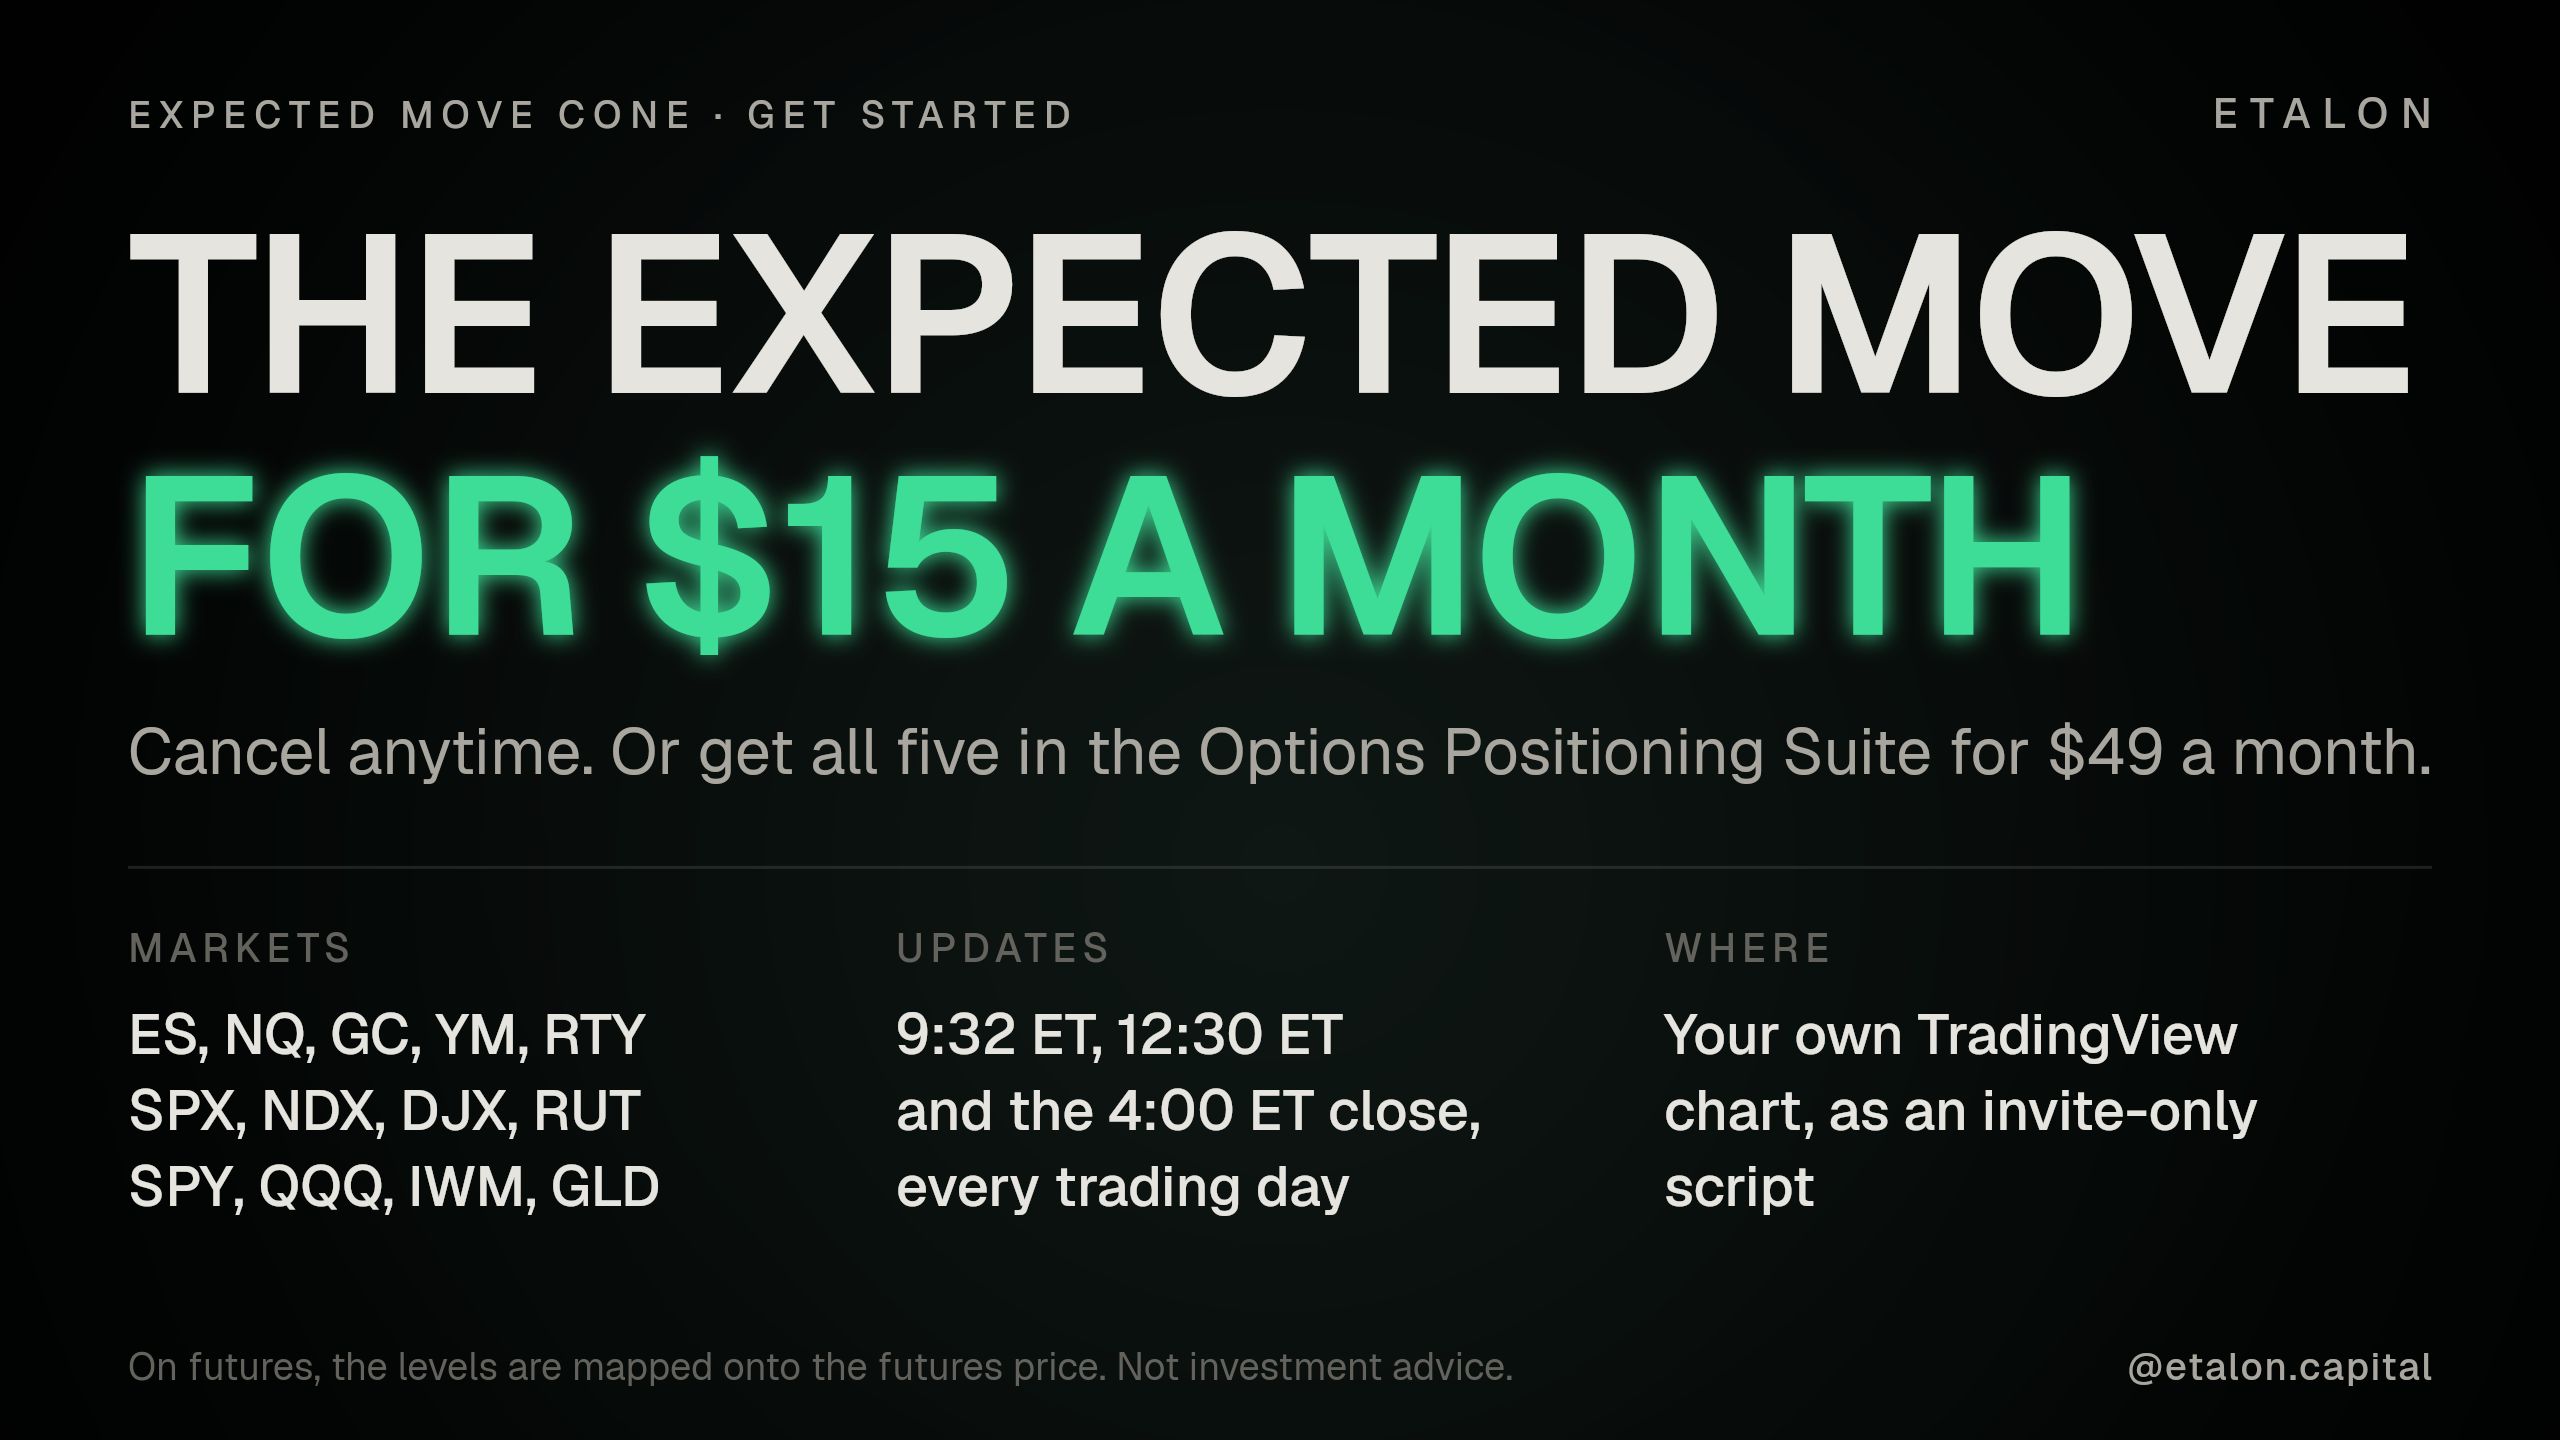
SPX, NDX, RUT, DJX, SPY, QQQ, IWM and GLD, plus ES, NQ, RTY, YM and GC futures (levels mapped onto the futures price). Updated at 9:32 ET, 12:30 ET and the 4:00 ET close every trading day. Not a live feed: every panel shows when it last updated.
$15 a month. Cancel anytime.
Want all five? The Options Positioning Suite adds GEX Levels, the Options Positioning Screener, IV Term Structure and Skew and Options Positioning History for $49 a month, with a 3-day free trial.
After you join, add your TradingView username in the TradingView app on our Whop.
Not investment advice.
- 18 days agoHonestly one of the better trading tools I’ve used. The GEX levels have been extremely helpful for trading NQ/ES and give me a much clearer picture of where price is likely to react, reject, or get pinned. Having the dealer positioning, expected moves, and GEX levels right on TradingView saves a ton...Written 1 day after purchase