
Trader's Compounding Tracker
Stop giving back your green days.
A daily goal and a hard -3R stop: a set point to stop on good days and bad ones.
Most traders don’t blow up in one trade. They give back a winning day, then press to get it back, and the account bleeds out over weeks.
The green day turns red because you kept trading. Or a loss stings, you size up to win it back, and one red day becomes three. What’s missing is a line you agreed to stop at before you started.
How it works
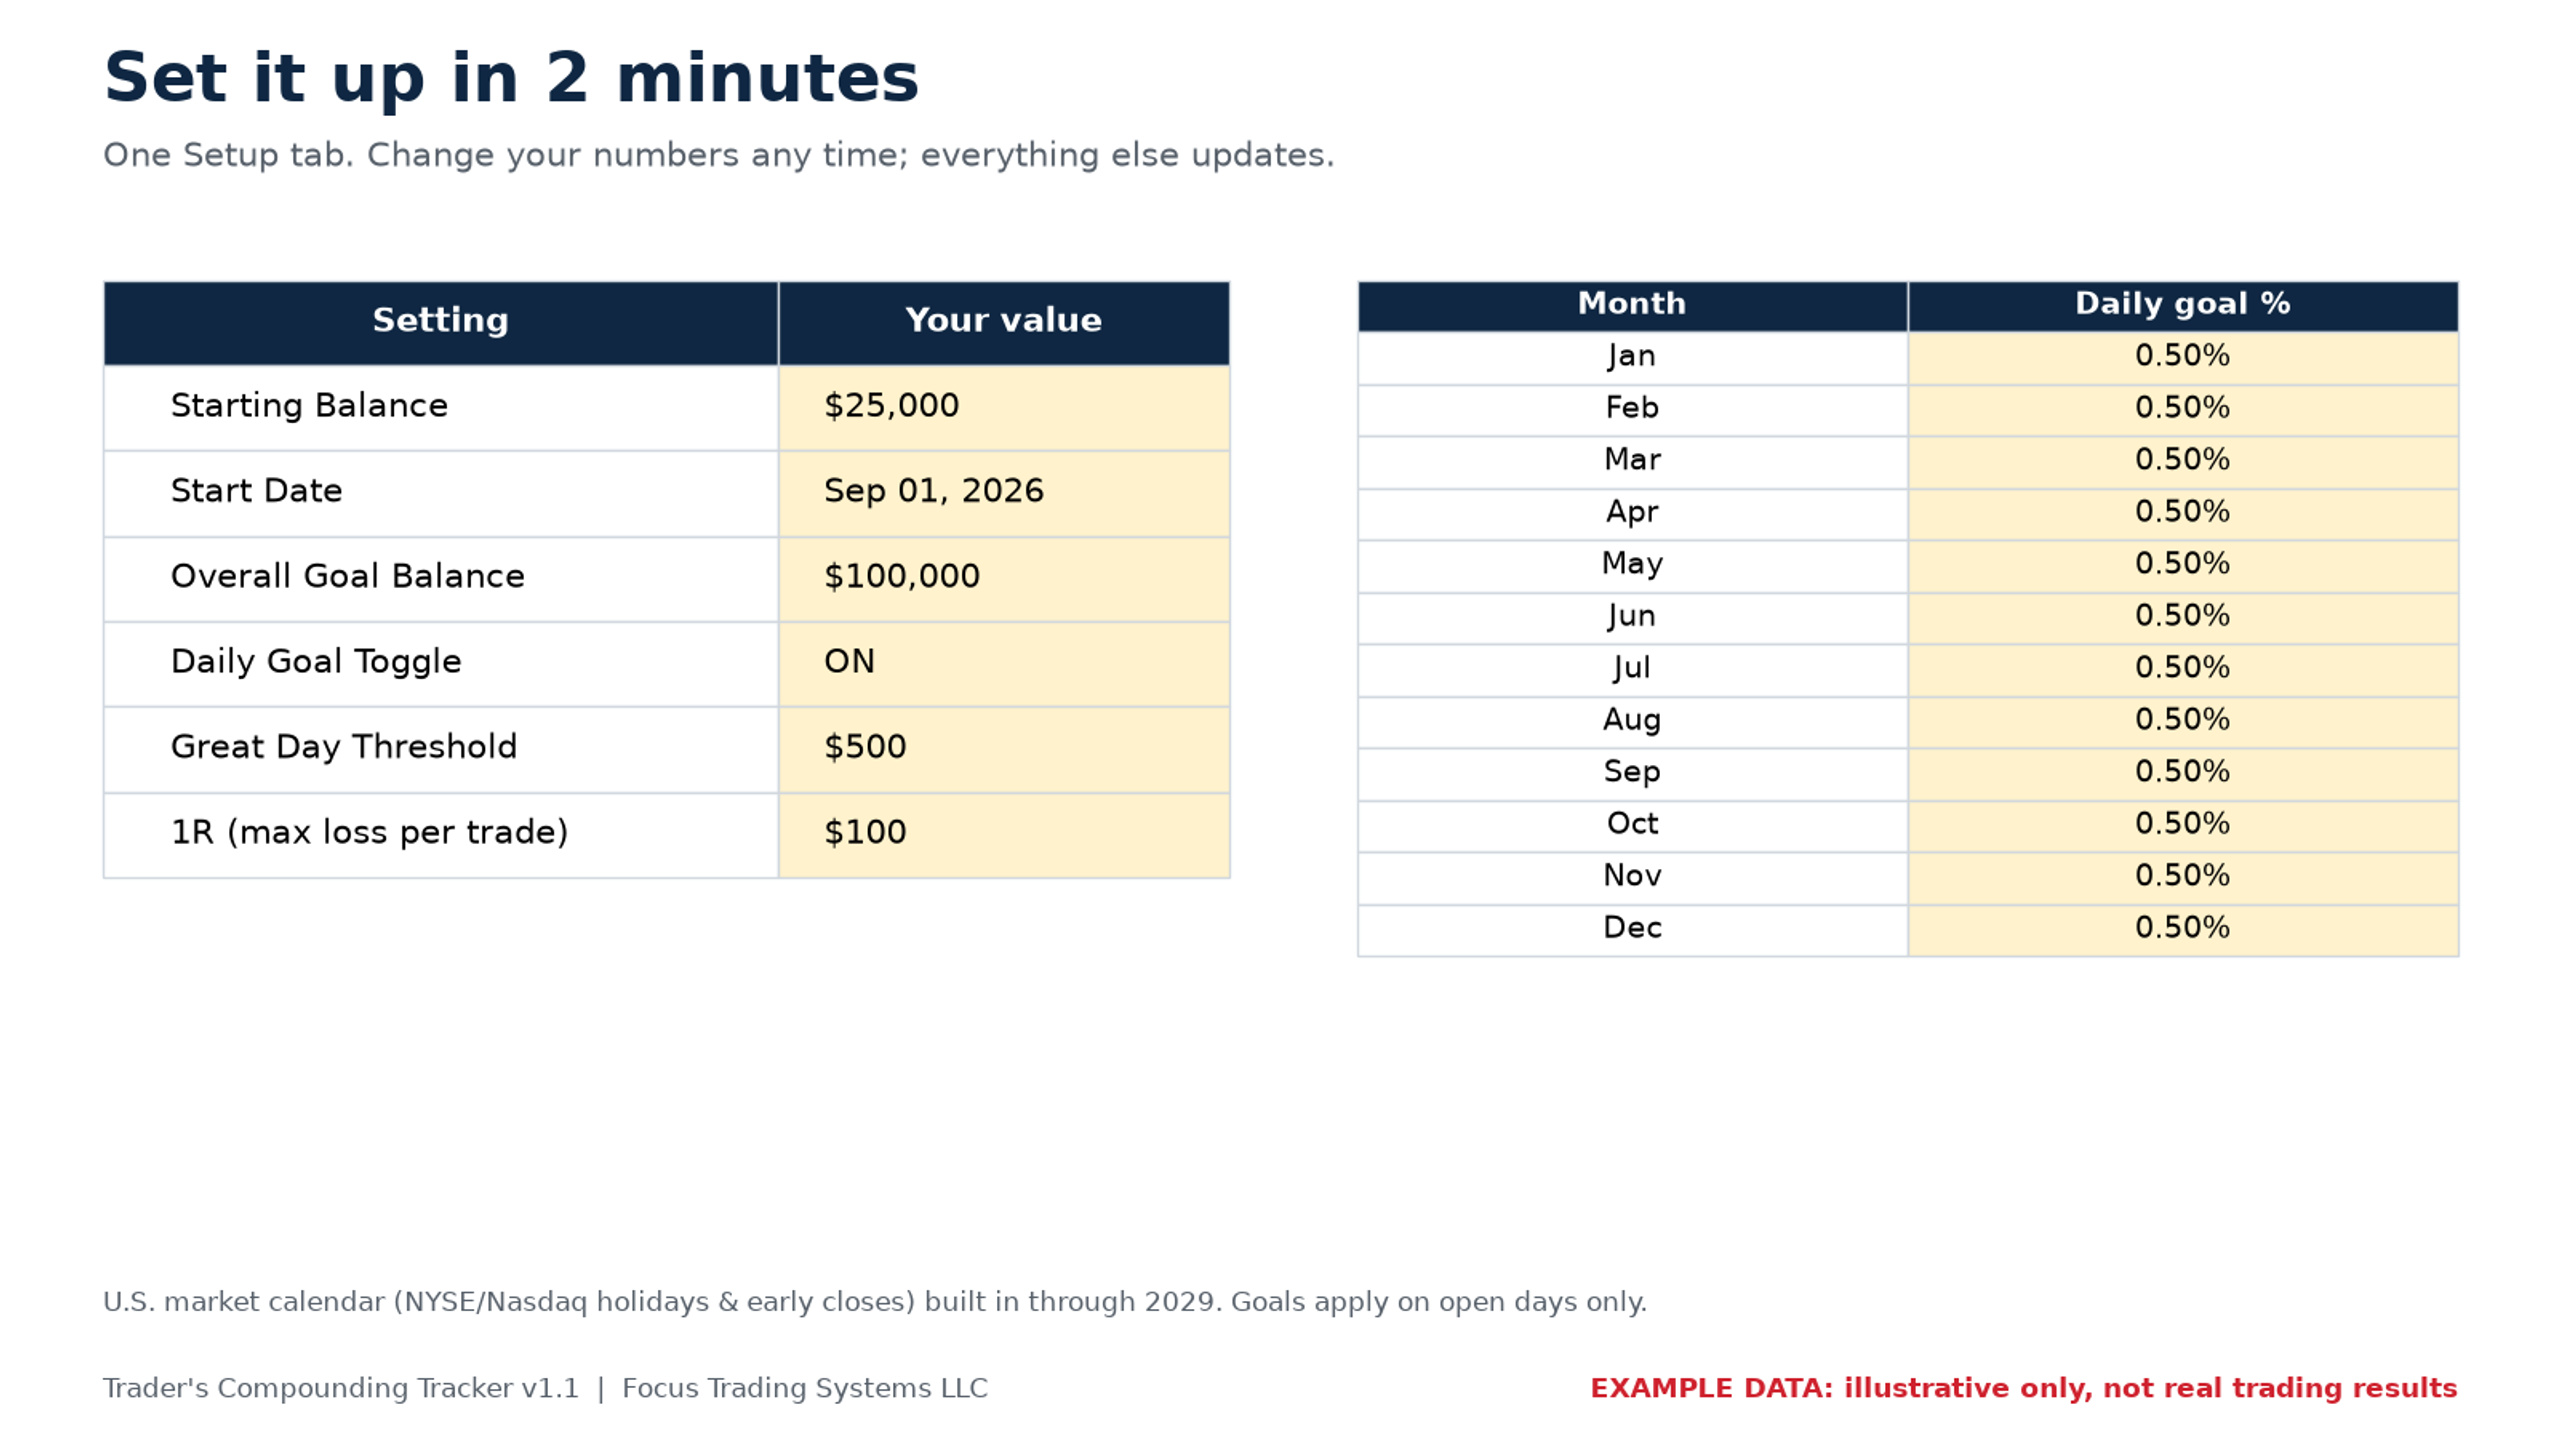
- Set your daily goal % and your 1R once.
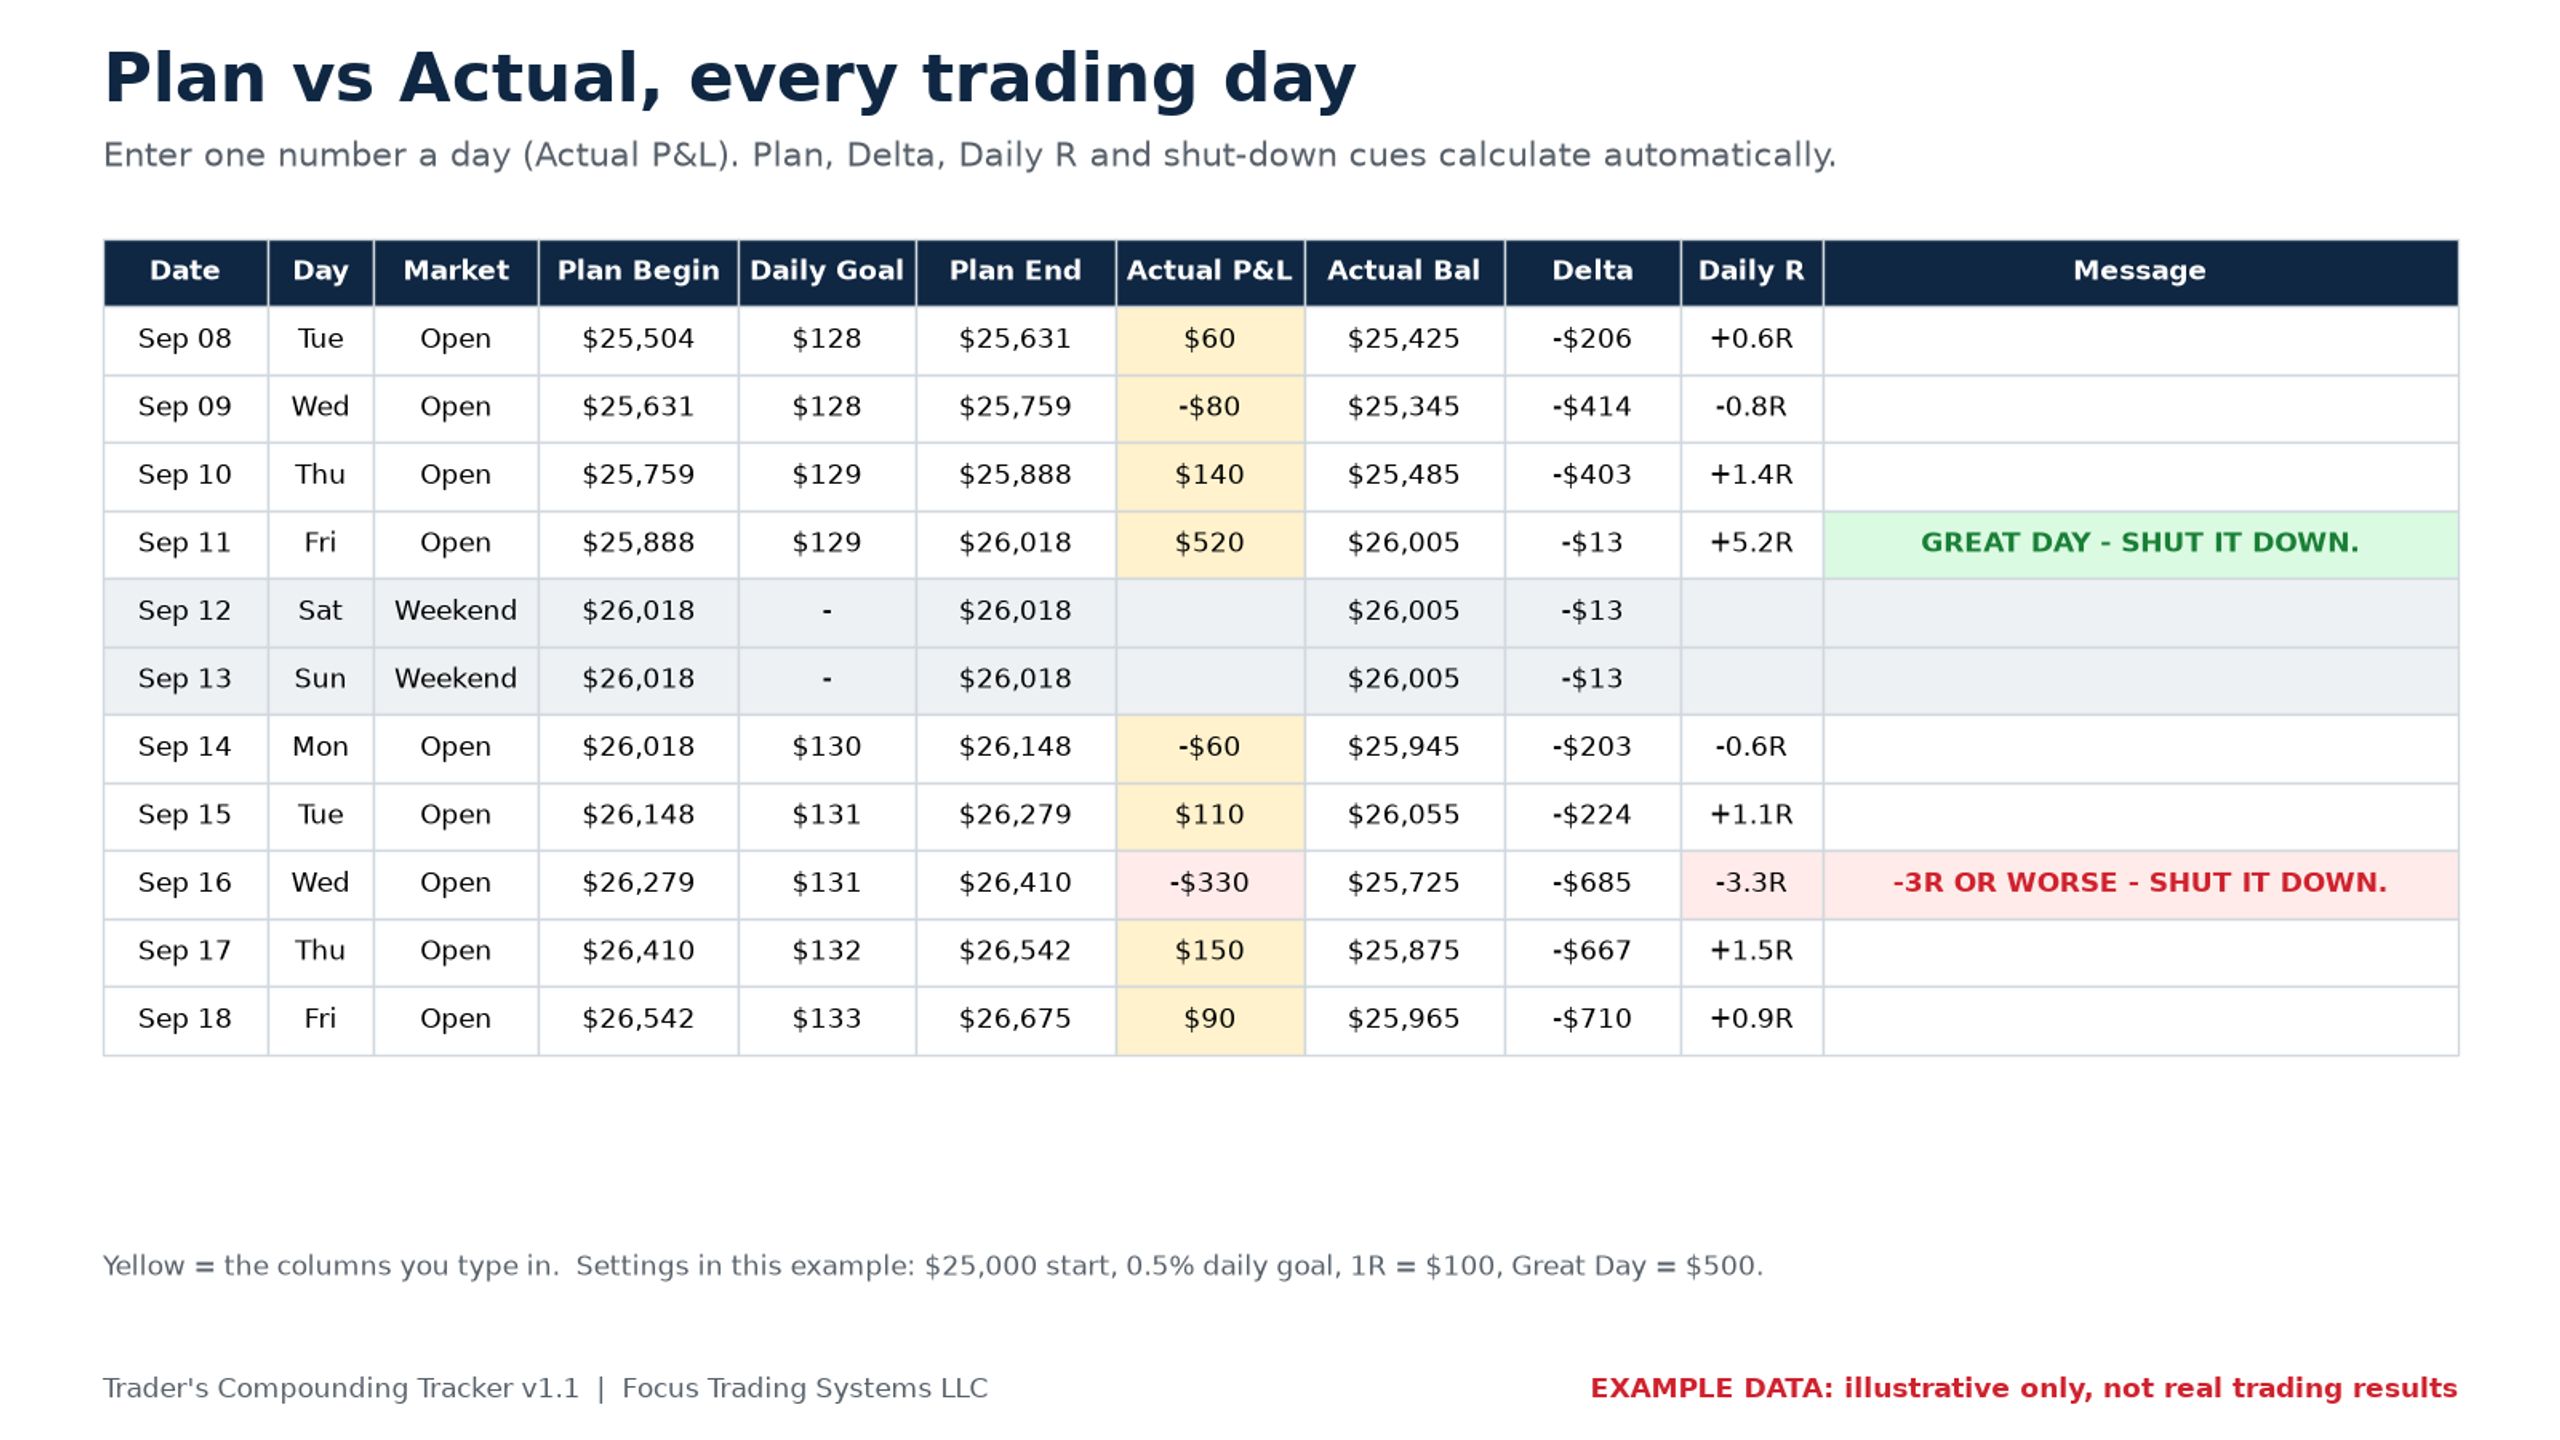
- Enter one number a day: your P&L. Update it during the day if you like.
- The sheet records Plan vs Actual and shows a shut-down cue at -3R or on a Great Day. When you see it, you’re done for the day.
What’s inside
• Plan vs Actual balance and daily R
• Red-day highlight at the daily loss % you choose
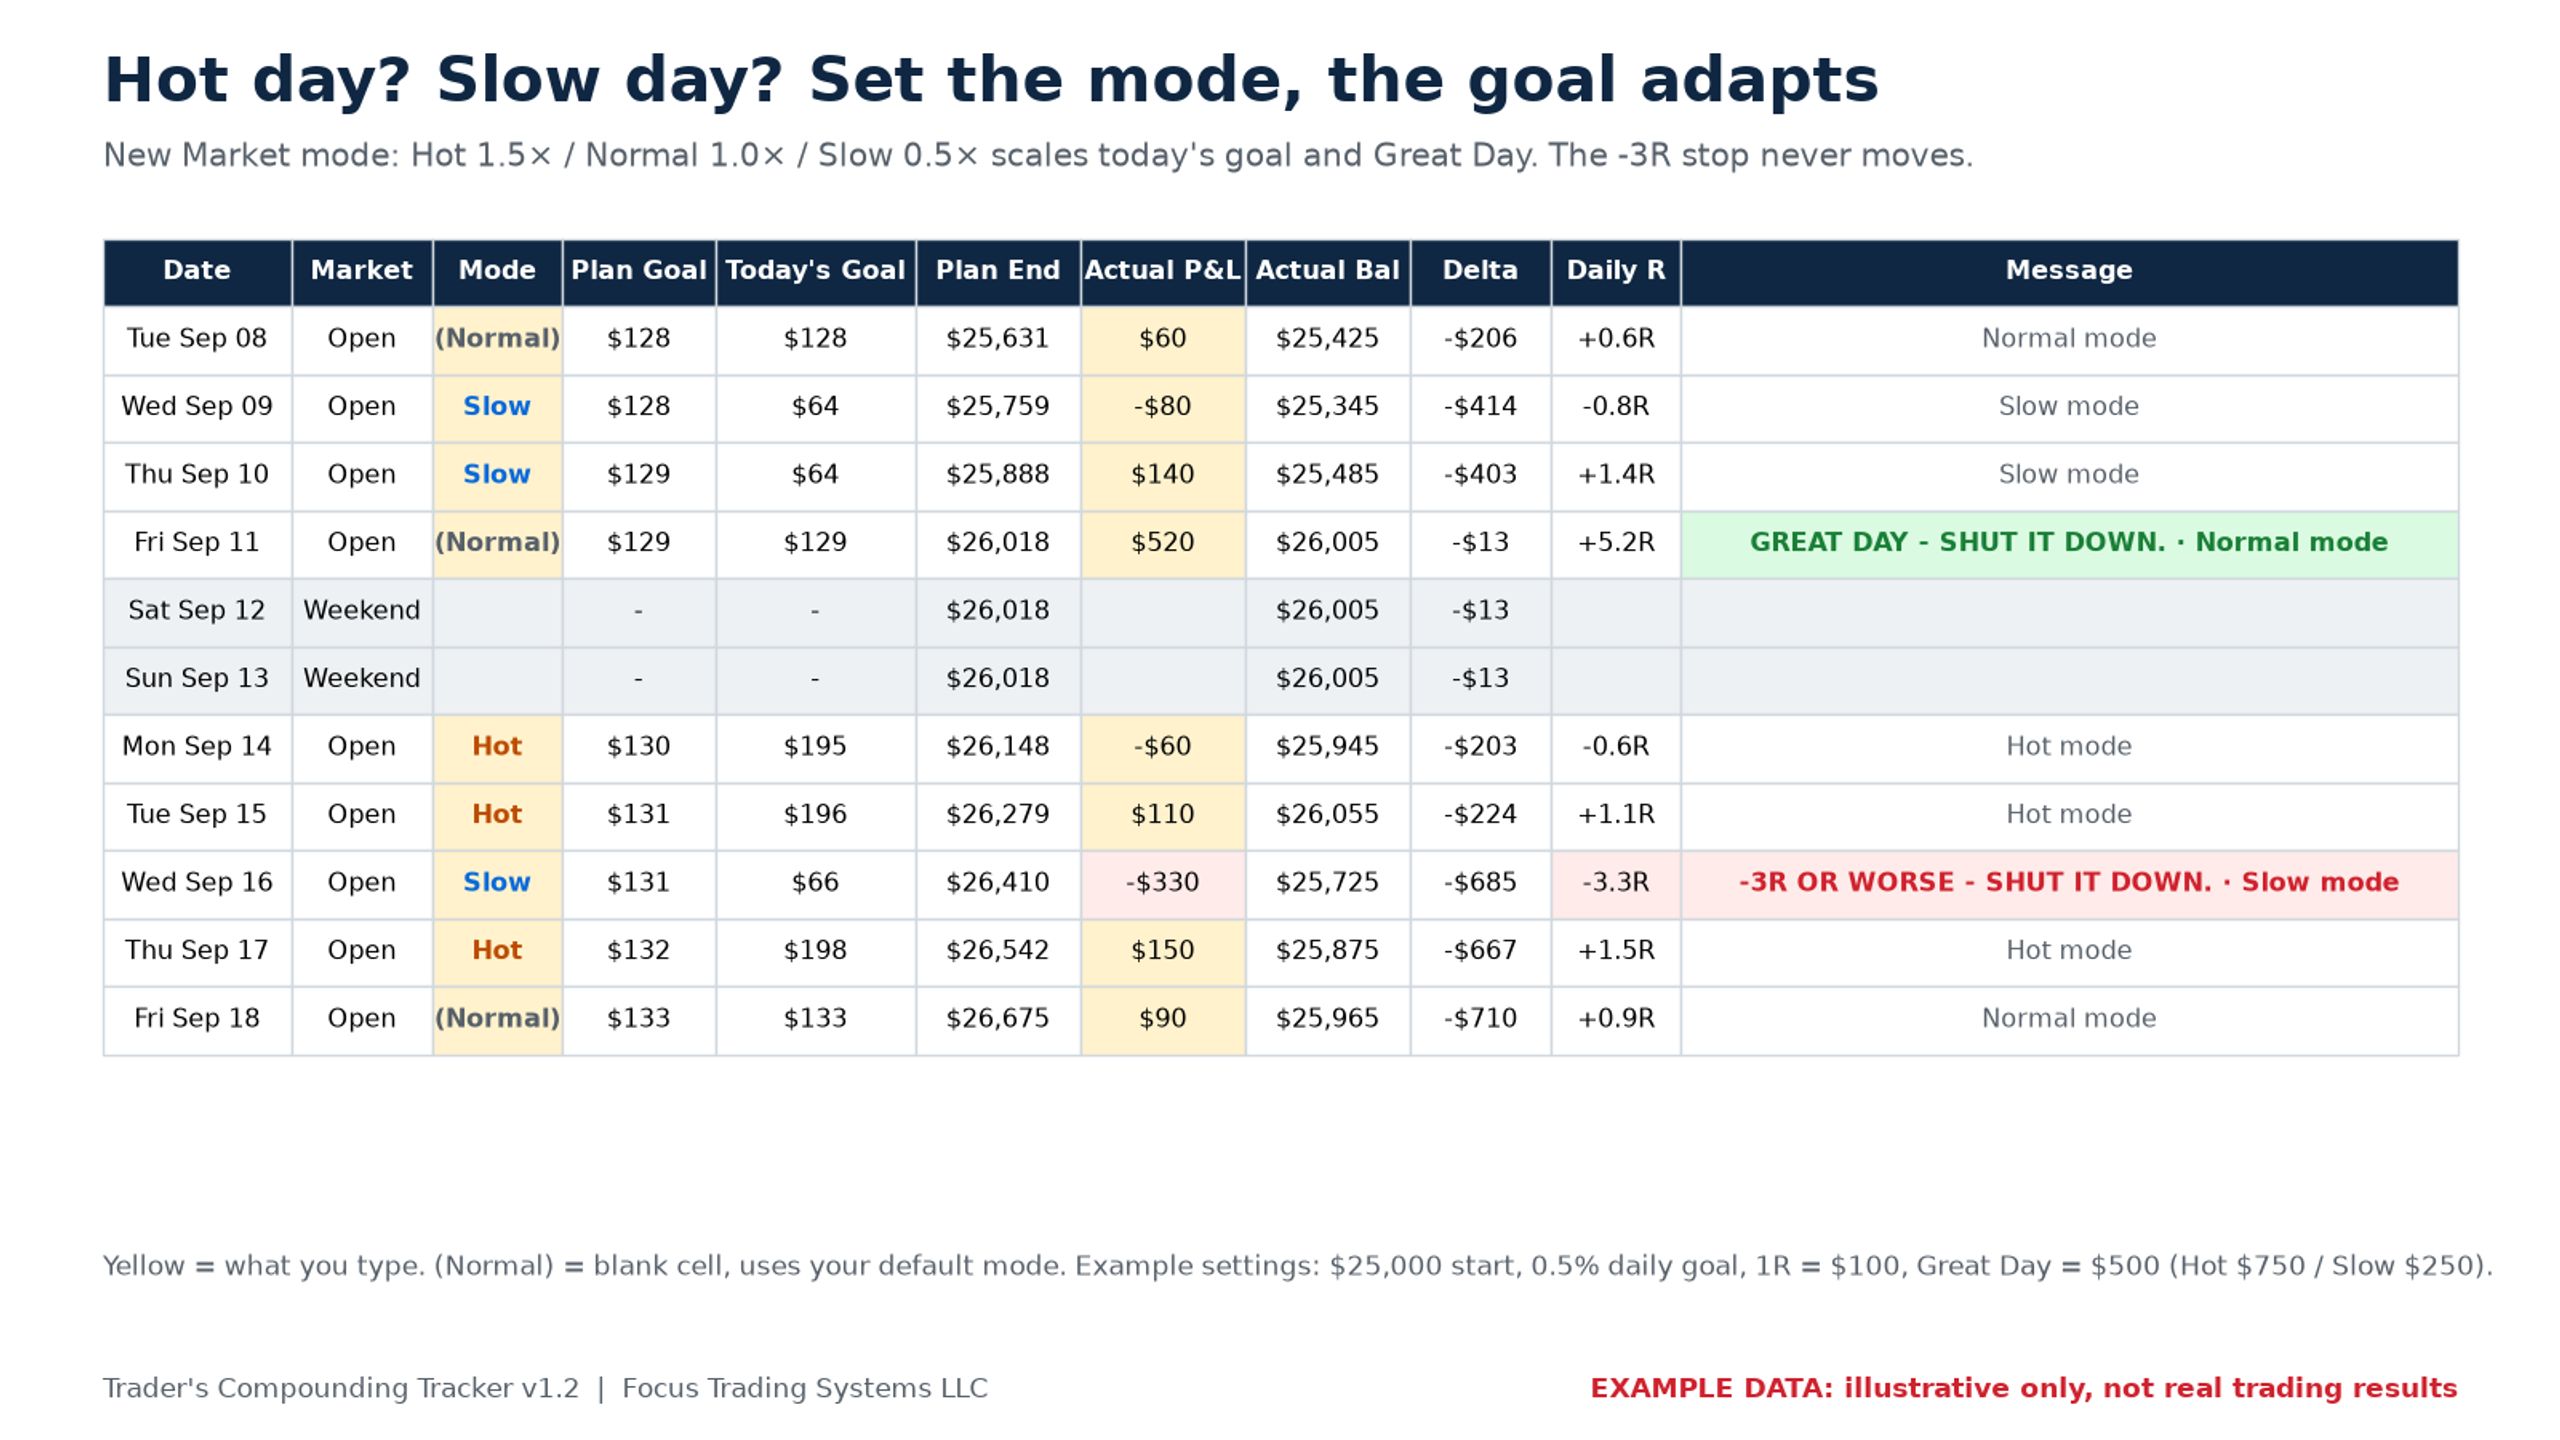
• Market mode: Hot, Normal or Slow scales today’s goal. Your -3R stop never moves.
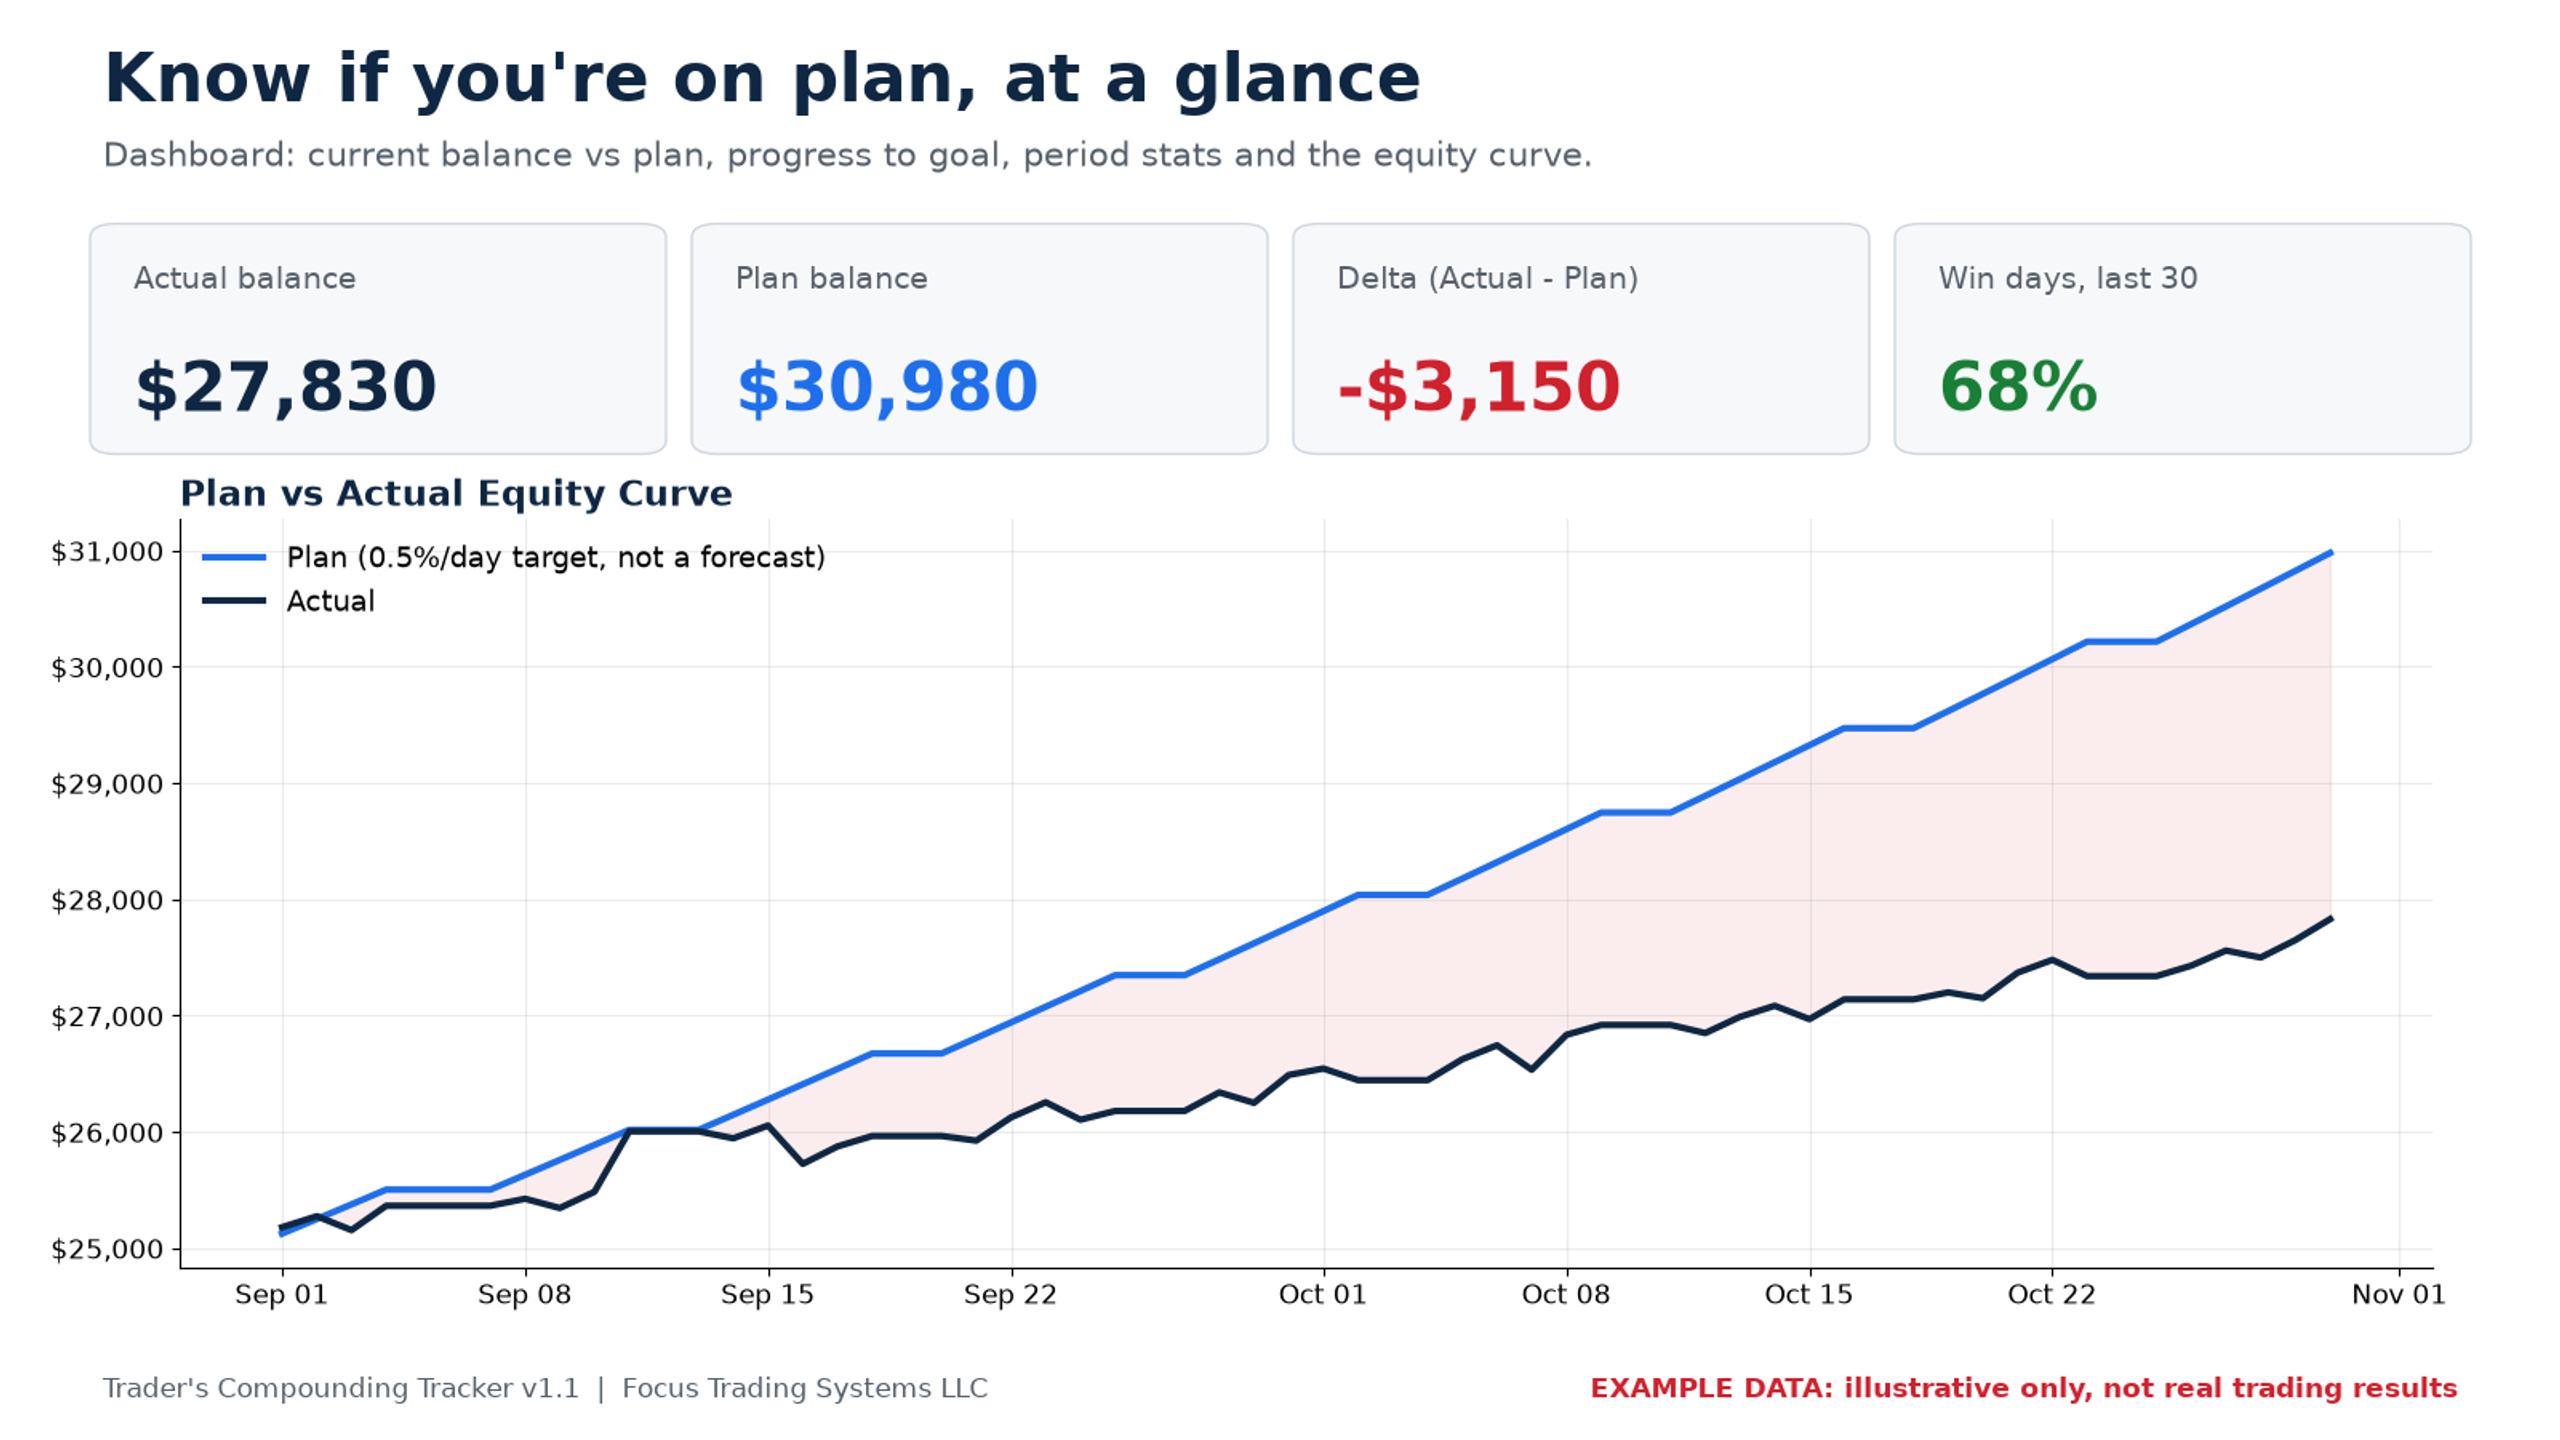
• Dashboard: 30, 60, 90-day stats, win-day %, monthly summary, equity curve
• U.S. market holidays built in, 2026 to 2029
What you get
One Google Sheet. After purchase, a link makes your own private copy in Google Drive. One-time $29, no subscription, no broker connection. Not a trading journal: one number a day.
All sales final: digital product with instant access, so no refunds, except where required by law or Whop’s Buyer Terms.
Educational, not advice. Screenshots use example data, not real results. Past performance does not guarantee future results. Trading involves substantial risk of loss.