Digital Acquisitions

5.0 (1 Review)
Learn how to broker digital business deals without buying the businesses yourself. Digital Acquisitions teaches the £0 capital brokering mo...
Location hidden
Created byProfile pictureSilkSurfers
2 joined
Profile picture
SilkSurfersProfile picture@silksurfers·Mar 9

I Analyzed 200 Flippa Listings Last Month — Here's What Actually Sells

Ran the numbers on every listing that closed on Flippa in February. Some patterns worth knowing if you're buying.


What sold fastest (under 14 days):

  • SaaS with $1K-5K MRR, priced under 36x monthly

  • Content sites with programmatic SEO + display ad revenue

  • Shopify stores with established supplier relationships


What sat for 60+ days or didn't sell:

  • "AI-powered" tools with no moat and declining traffic

  • Affiliate sites in YMYL niches post-HCU

  • Any listing where the seller's "reason for selling" was vague


Price brackets that moved:

  • Under $25K: highest velocity, most competitive, worst due diligence from buyers

  • $25K-100K: sweet spot for solo operators. Less competition, still manageable risk

  • $100K+: slower but deals here tend to be better priced (sellers are more sophisticated)


The biggest red flag nobody talks about: listings where the monthly revenue increased right before listing. Sellers know what buyers look for. A suspicious revenue spike in the last 60 days before listing is often manufactured (paid ads, one-time contracts, seasonal bump marketed as growth).


Our scanner catches this — the revenue quality score penalizes listings with anomalous recent growth that doesn't match the trailing 12-month trend.


Bottom line: the marketplace is flooded. Most listings aren't worth your time. The edge isn't finding listings — it's filtering them fast and knowing which numbers to trust.


That's what the Scanner Report does. Twice daily. 40+ scored deals with the math already done.

Profile picture
SilkSurfersProfile picture@silksurfers·Mar 9

How the AI Scoring Model Works (And Why Most Listings Score Under 40)

I get asked this a lot, so here's the breakdown.


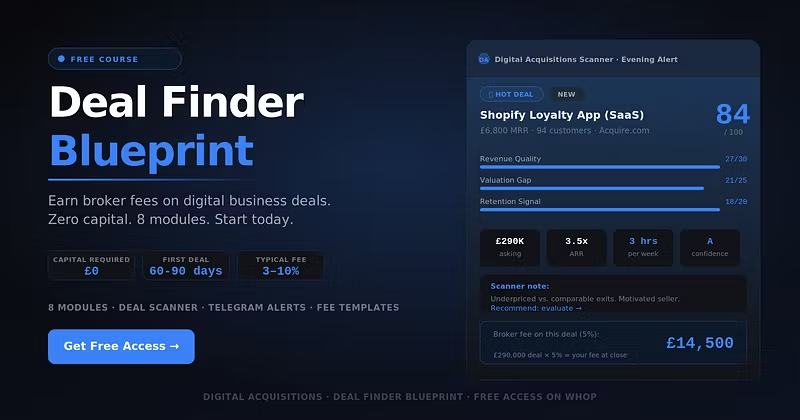
The scanner pulls every new listing from Flippa, Acquire.com, Empire Flippers, and MicroExits twice a day. Then it runs each one through a weighted scoring model across five dimensions:


Revenue Quality (25%) — Is the revenue recurring? How diversified are the traffic sources? Is there customer concentration risk? A SaaS with 200 paying customers scores higher than an affiliate site with one traffic channel.


Valuation Gap (25%) — Is the asking price below where comparable businesses trade? We benchmark against industry multiples for the business type, revenue, and growth rate. If a 3x multiple business is listed at 1.8x, that's a gap.


Retention Signals (20%) — Monthly churn, customer LTV, repeat purchase rate. A business with 3% monthly churn scores differently than one with 15%.


AI Resistance (15%) — How exposed is this business to AI disruption? Content sites are high risk. B2B SaaS with workflow lock-in is lower risk. This is the filter most buyers skip entirely.


Operator Effort (15%) — How many hours per week does this actually take to run? "Passive income" listings that require 30hrs/week get penalized. We cross-reference seller claims against the business model.


Each dimension scores 0-20, totaling 0-100.


The reality: about 70% of listings score under 40. That's not a bug — most marketplace listings are overpriced, have declining revenue, or have a structural problem the seller isn't highlighting.


The Scanner Report surfaces everything scoring 40+. The daily Deal of the Day is the single highest scorer.


If you're manually scanning marketplaces, you're spending 2-3 hours doing what the model does in seconds. And you're probably missing the valuation gap math entirely.


Free members get the Deal of the Day — sign up takes 10 seconds.