Nasdaq GEX Levels
NQ Gamma Exposure Levels — Updated Every Day
See what market makers are up to before you take the trade.
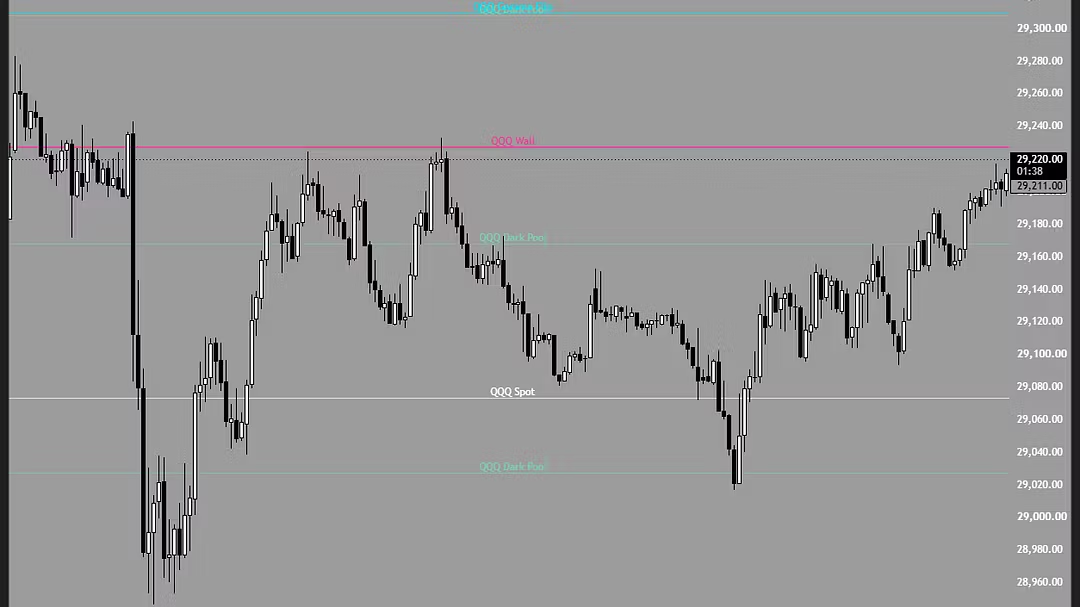
Every day, market makers or dealers positioning builds up at specific prices on NDX. Those levels influence where price can bounce off, accelerate, and pin. Most retail traders never see them.
This puts them on your TradingView chart, updated every trading day.
What you get:
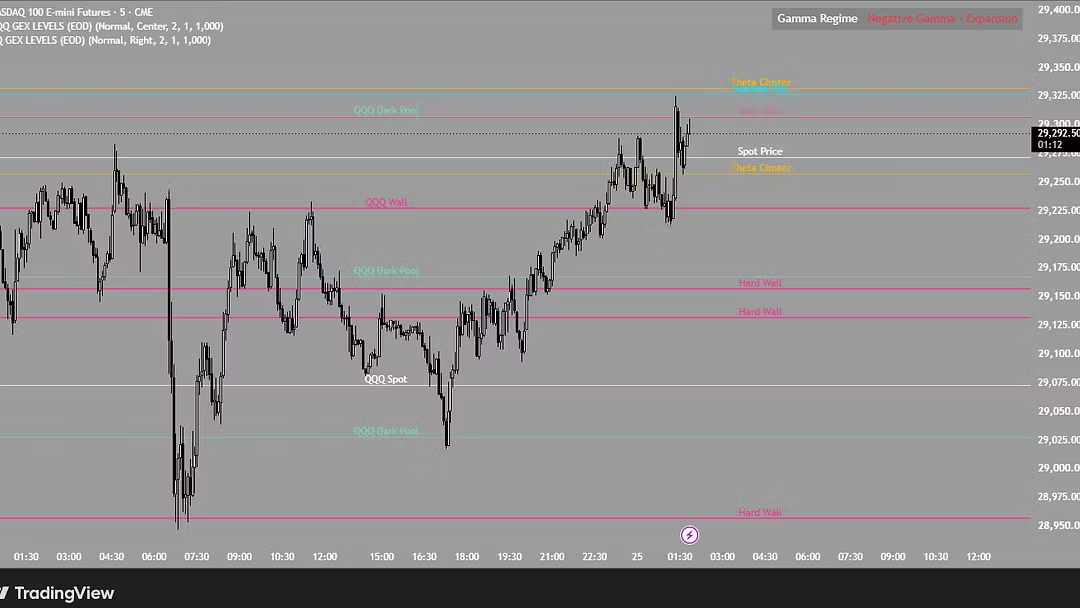
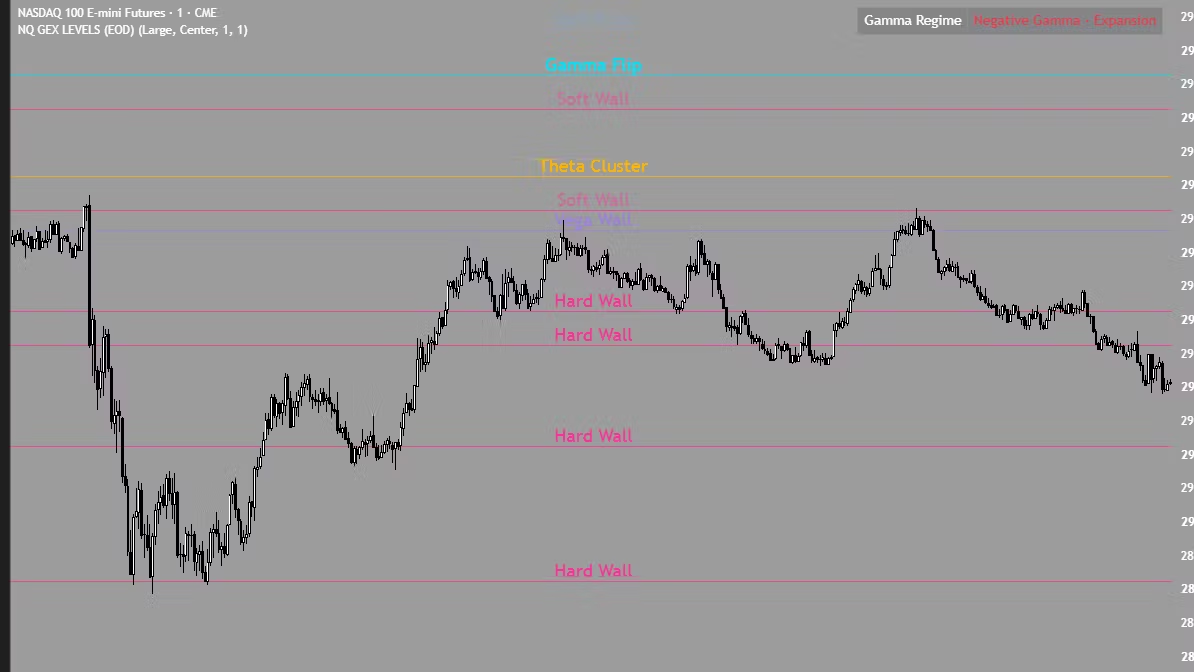
Hard Walls and Soft Walls: Strike concentrations where dealer hedging flow is densest, and weighted by size.
Gamma Flip: Where net dealer gamma exposure flips signs, either positive or negative.
Theta Clusters and Vega Walls: Secondary decay and vol concentrations.
Max Pain and Spot Price
Gamma Regime Table: Shows at a glance whether price is trading in a positive gamma regime or negative regime.
Calculated from NDX options data and converted to NQ pricing, then pushed straight onto your chart. No manual entries or spreadsheets, your chart updates automatically.
How to access: After checkout, enter your TradingView username. Access granted within 4 hours on market days. Works on any TradingView account, including free plans.
Not financial advice. This tool plots options-derived reference levels for analysis. It does not generate buy or sell signals and does not predict price direction. Positioning shifts continuously during the session, end-of-day levels reflect the snapshot at time of calculation. You are solely responsible for your own trading decisions and assume all risk.