
PT Indicator
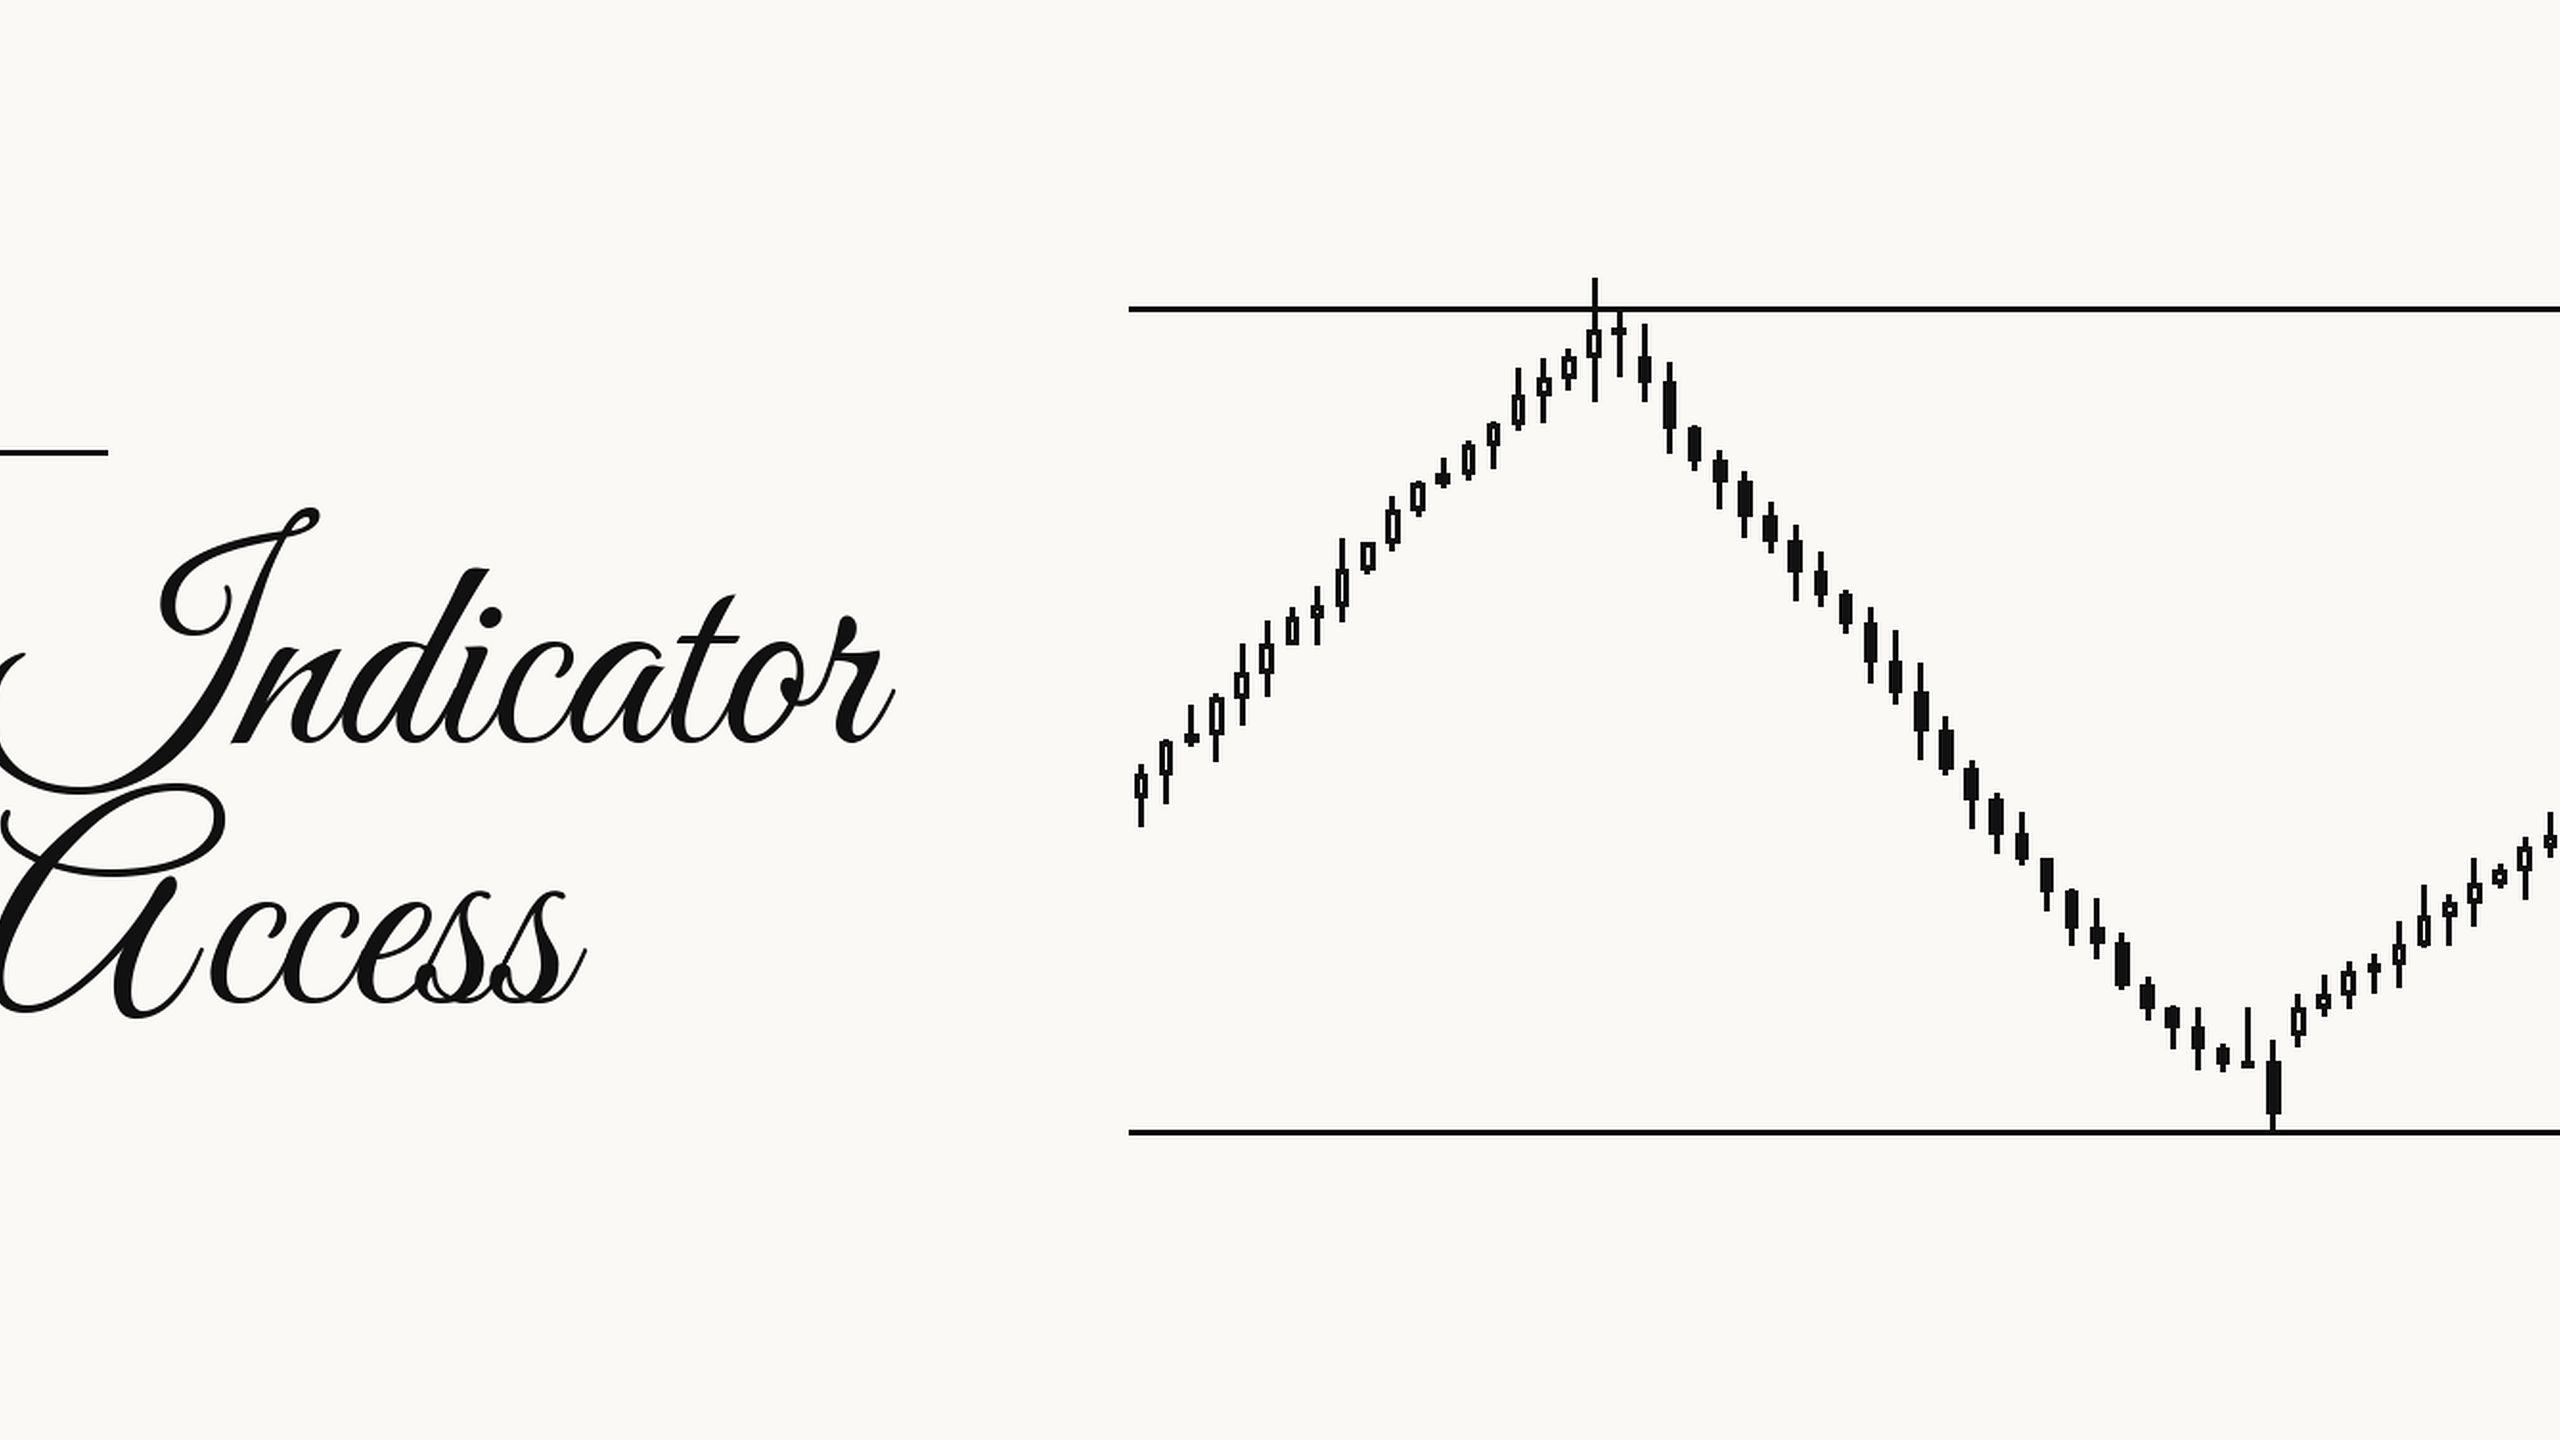
PT Levels draws where a normal NQ session is likely to reach, before the day happens.
At the regular session open it projects three tiers above and below, sized to how volatile the day is expected to be. Each tier is drawn twice: once from what the market has been doing, once from what the options market is pricing. Where the two disagree you get a zone instead of a line.
The levels are set at the open and held to the close. They never move and never repaint, and they stay on the chart for review. A compact table shows both readings, the size of a full move in points, and where price sits in the range right now.
What it gives you
Targets and stops that come from the market, not a round number
An early warning when a session has stopped being normal
The same levels on every timeframe, to the tick
What it isn’t
It won’t tell you when to buy or sell, and it doesn’t predict direction. It tells you the size of the day. What you do at a level is your decision.
Included
PT Levels on TradingView, invite-only
All updates to the script
Setup guide and method note
Support channel in the Perpetual Trades Discord
Needs a TradingView plan with real-time CME futures data for NQ or MNQ. Nothing external to connect.
After subscribing, send your TradingView username. Access granted within 24 hours, usually sooner.
Futures trading carries substantial risk of loss. PT Levels is an analytical tool for educational purposes only, not financial advice.
- 1 month agoabosulutely worth it. the course has so much content at he just keeps updating it. u can ask him so much questions and he answers every single one and makes sure ur understanding it right. he keeps putting in the content the students are asking for. the community is also rlly goated. can only recomm...Written 8 days after purchase
- 1 month agoWorth youre money wether u are a beginner trader or experienced His products and discord server are worth it with allot of Info and help tap inWritten 4 days after purchase
- 1 month agoDefinitely worth the money you everything u need and more, this guy goes so in depth its crazyWritten 6 days after purchase
- 2 months agoBeen with him for a month and have nothing but positive things to say about his strategy and teaching methods. Only mentor I know that actually trades live everyday with his students. Highly recommend.Written 1 month after purchase