Bitcoin Halving Cycle Heatmap
Visualize Time-Based Risk & Halving Events
Master the macro view of Bitcoin with the Halving Cycle Heatmap. The 4-year Halving cycle is the heartbeat of the crypto market, and this tool ensures you always know exactly where price action sits within that timeline.
Key Features:
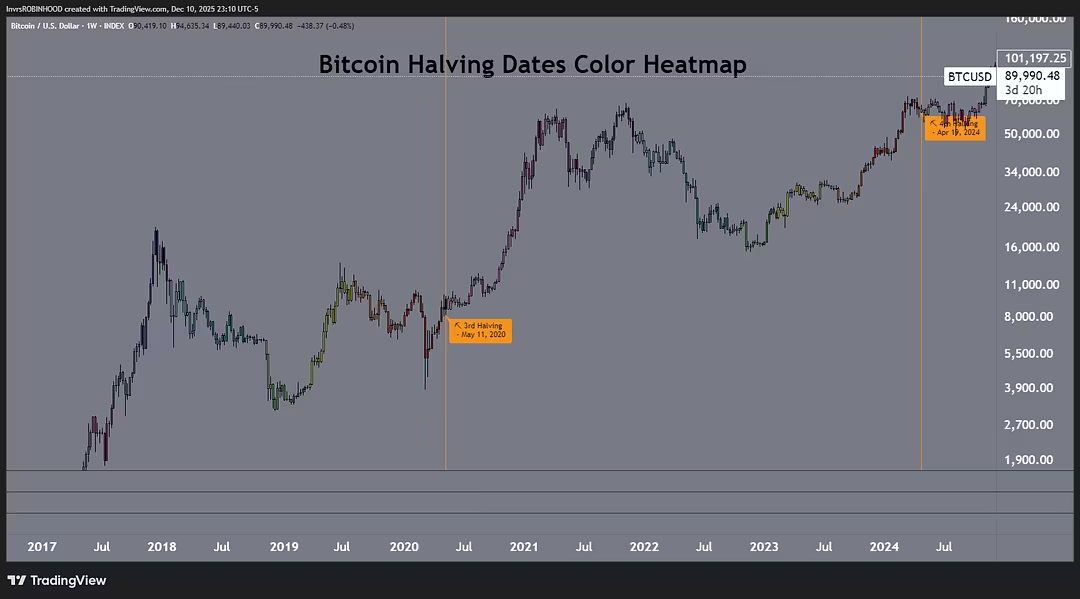
Automated Halving Markers: Automatically plots vertical lines for all historical and future Bitcoin Halving events (2012, 2016, 2020, 2024, 2028). No manual configuration is required to see the "eras" of Bitcoin's history.
Time-Based Risk Heatmap: The indicator colors your candle bars based on a "Time Risk" model. By calculating the time remaining until the next Halving, it applies a gradient color scheme to price action.
Cycle Visualization: Quickly identify if the market is in an "Early Cycle" (typically accumulation) or "Late Cycle" phase simply by looking at the color of the candles.
Clean Overlay: Designed to work seamlessly alongside your technical indicators without cluttering the chart, providing a high-level fundamental backdrop to your technical analysis.
Stop guessing where we are in the "grand scheme." This tool quantifies the 4-year cycle into a simple, visual color code.
Features
- Identify macro accumulation zones by visualizing exactly where you are in the 4-year cycle.
About the creator

Affiliates

Earn money by bringing customers to InvrsROBINHOOD Indicators. Every time a customer purchases using your link, you'll earn a commission.