
ICT HTF MS
$12.5$10 / monthSave 20%
+1 option
$10 / month
ICT HTF MS
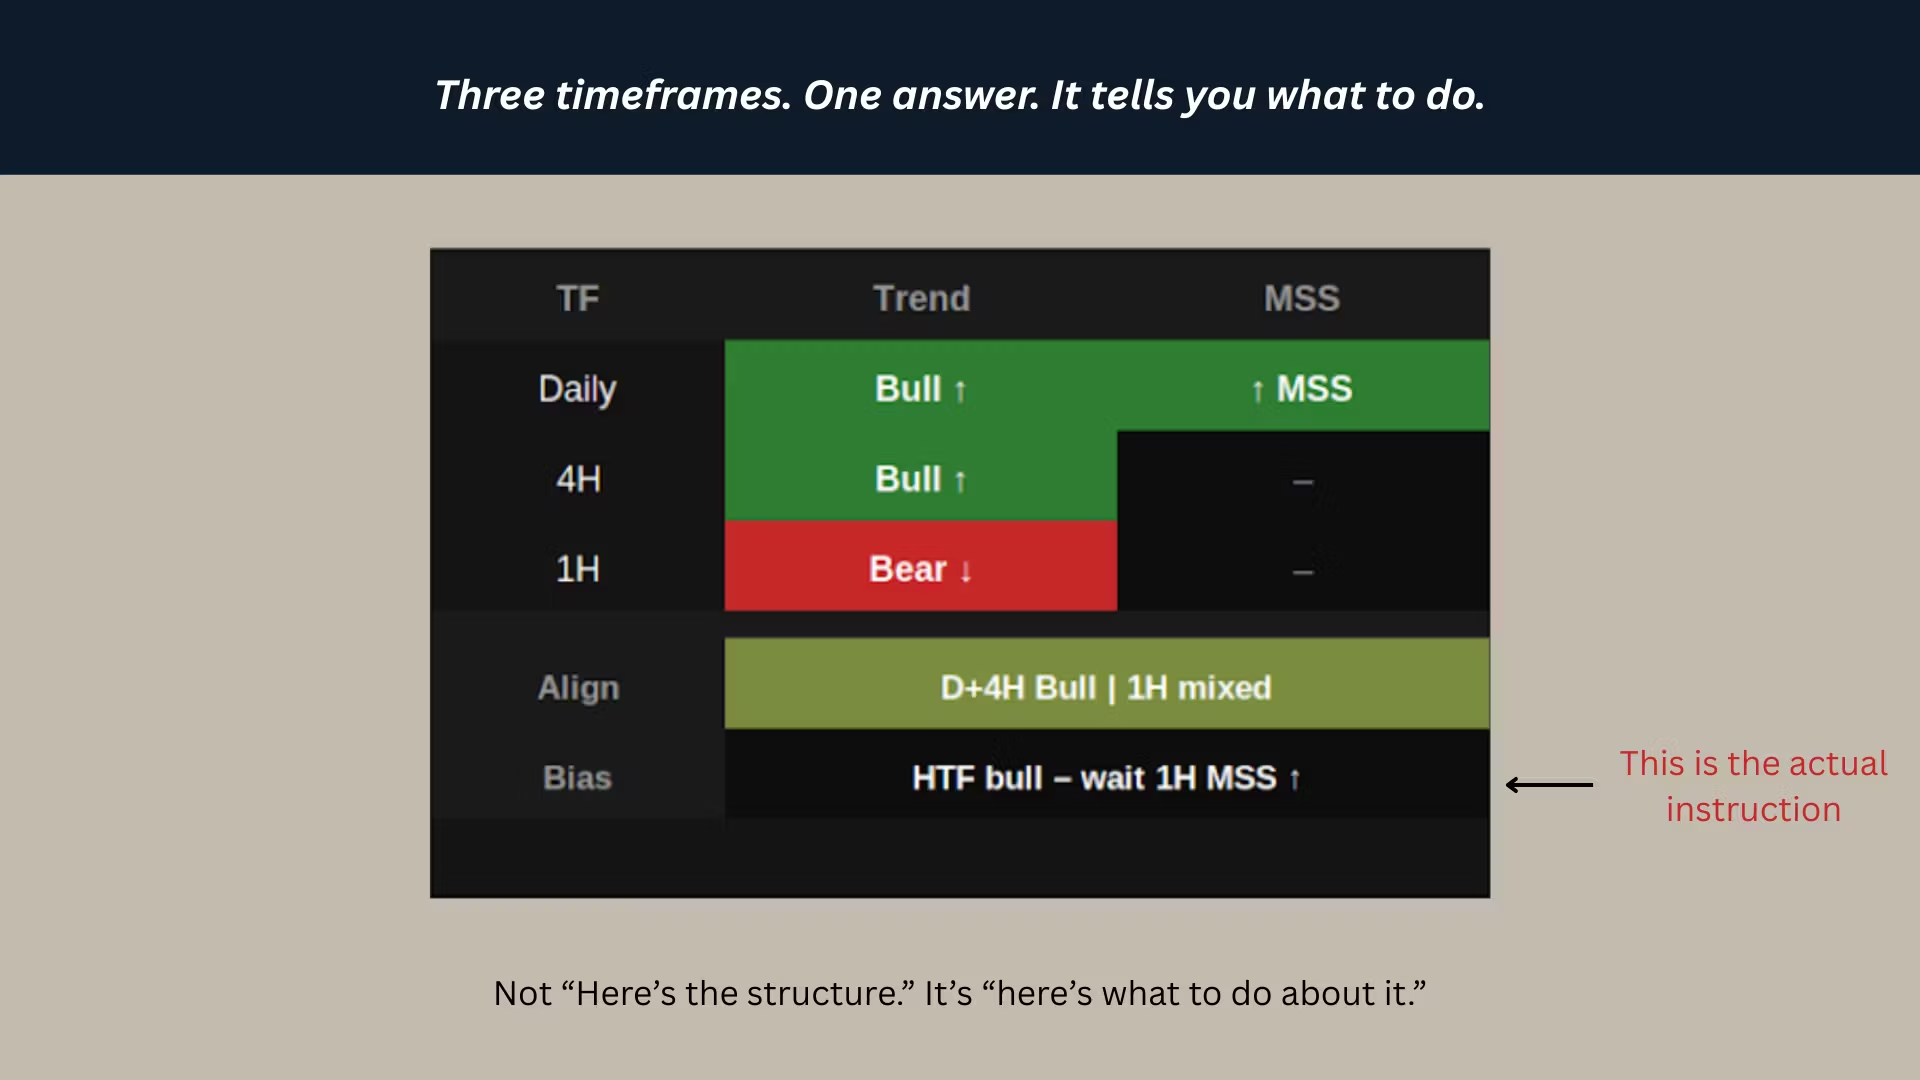
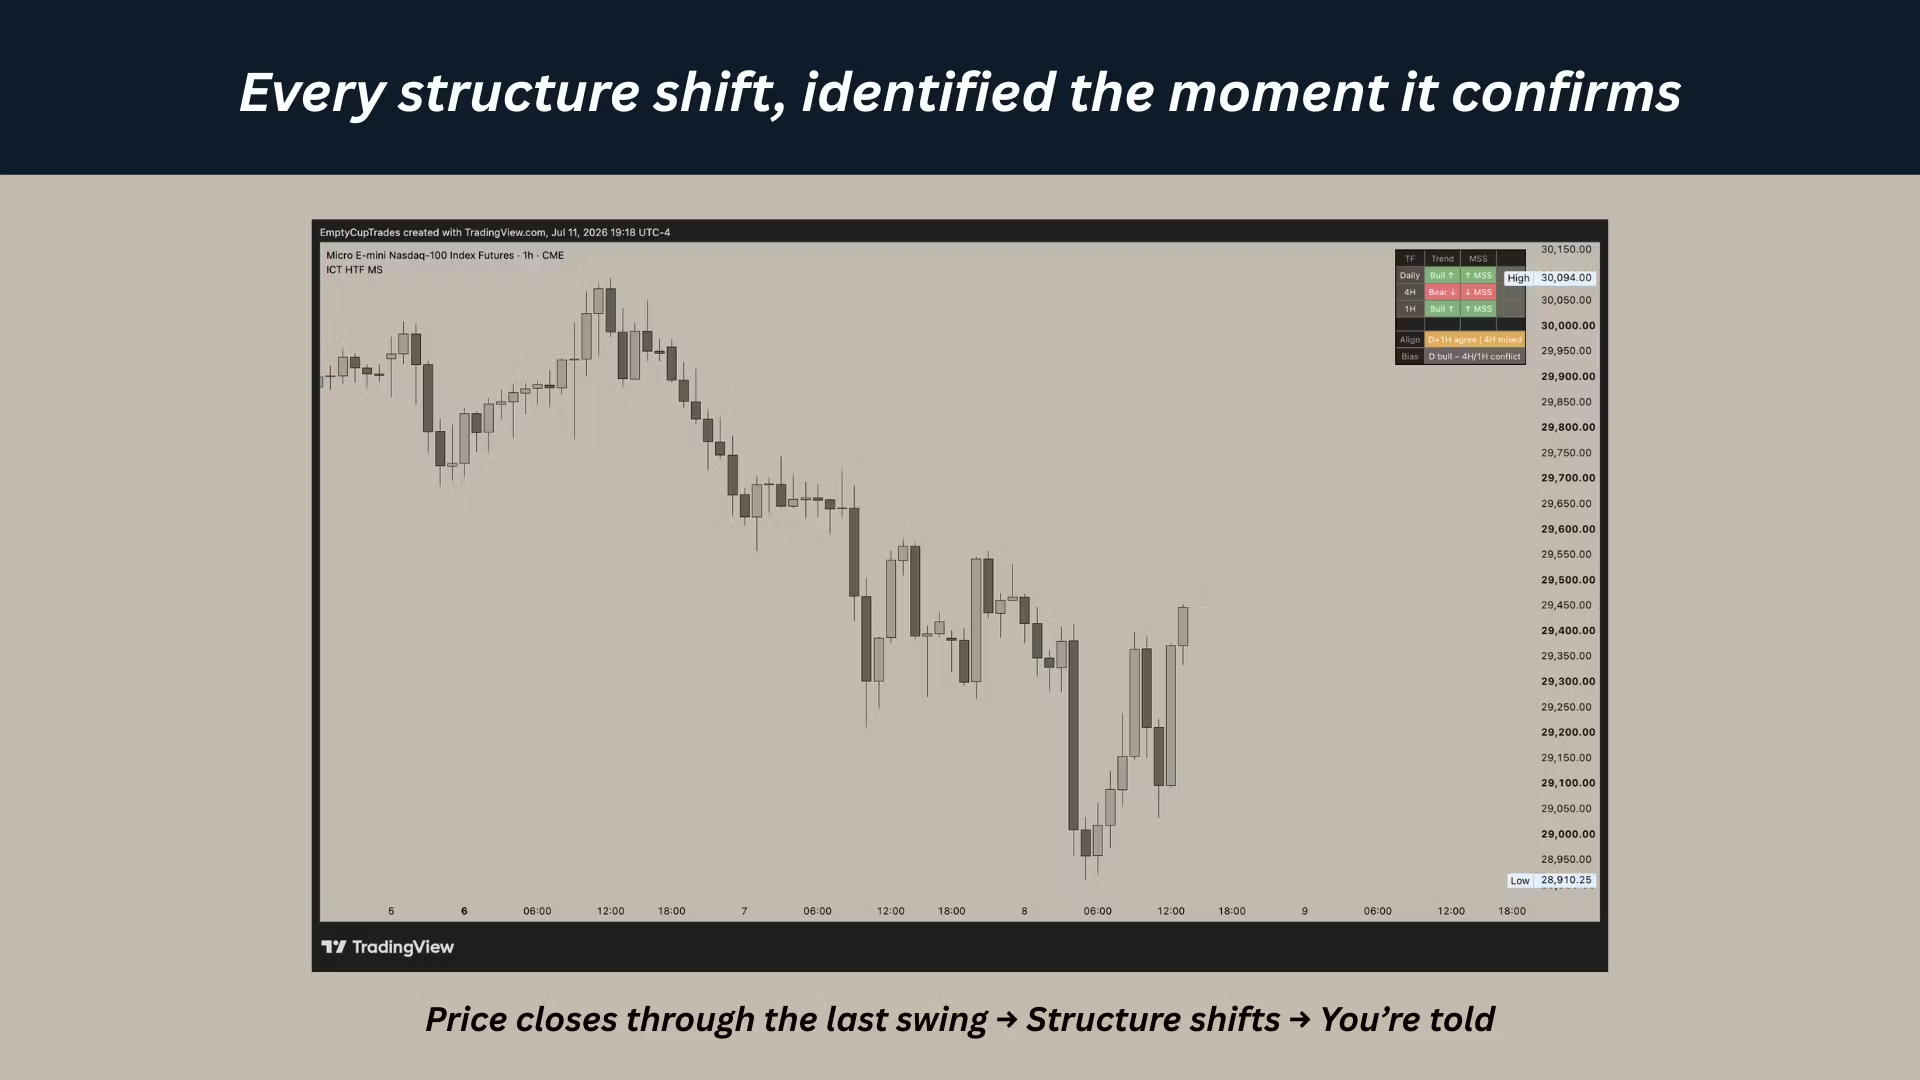
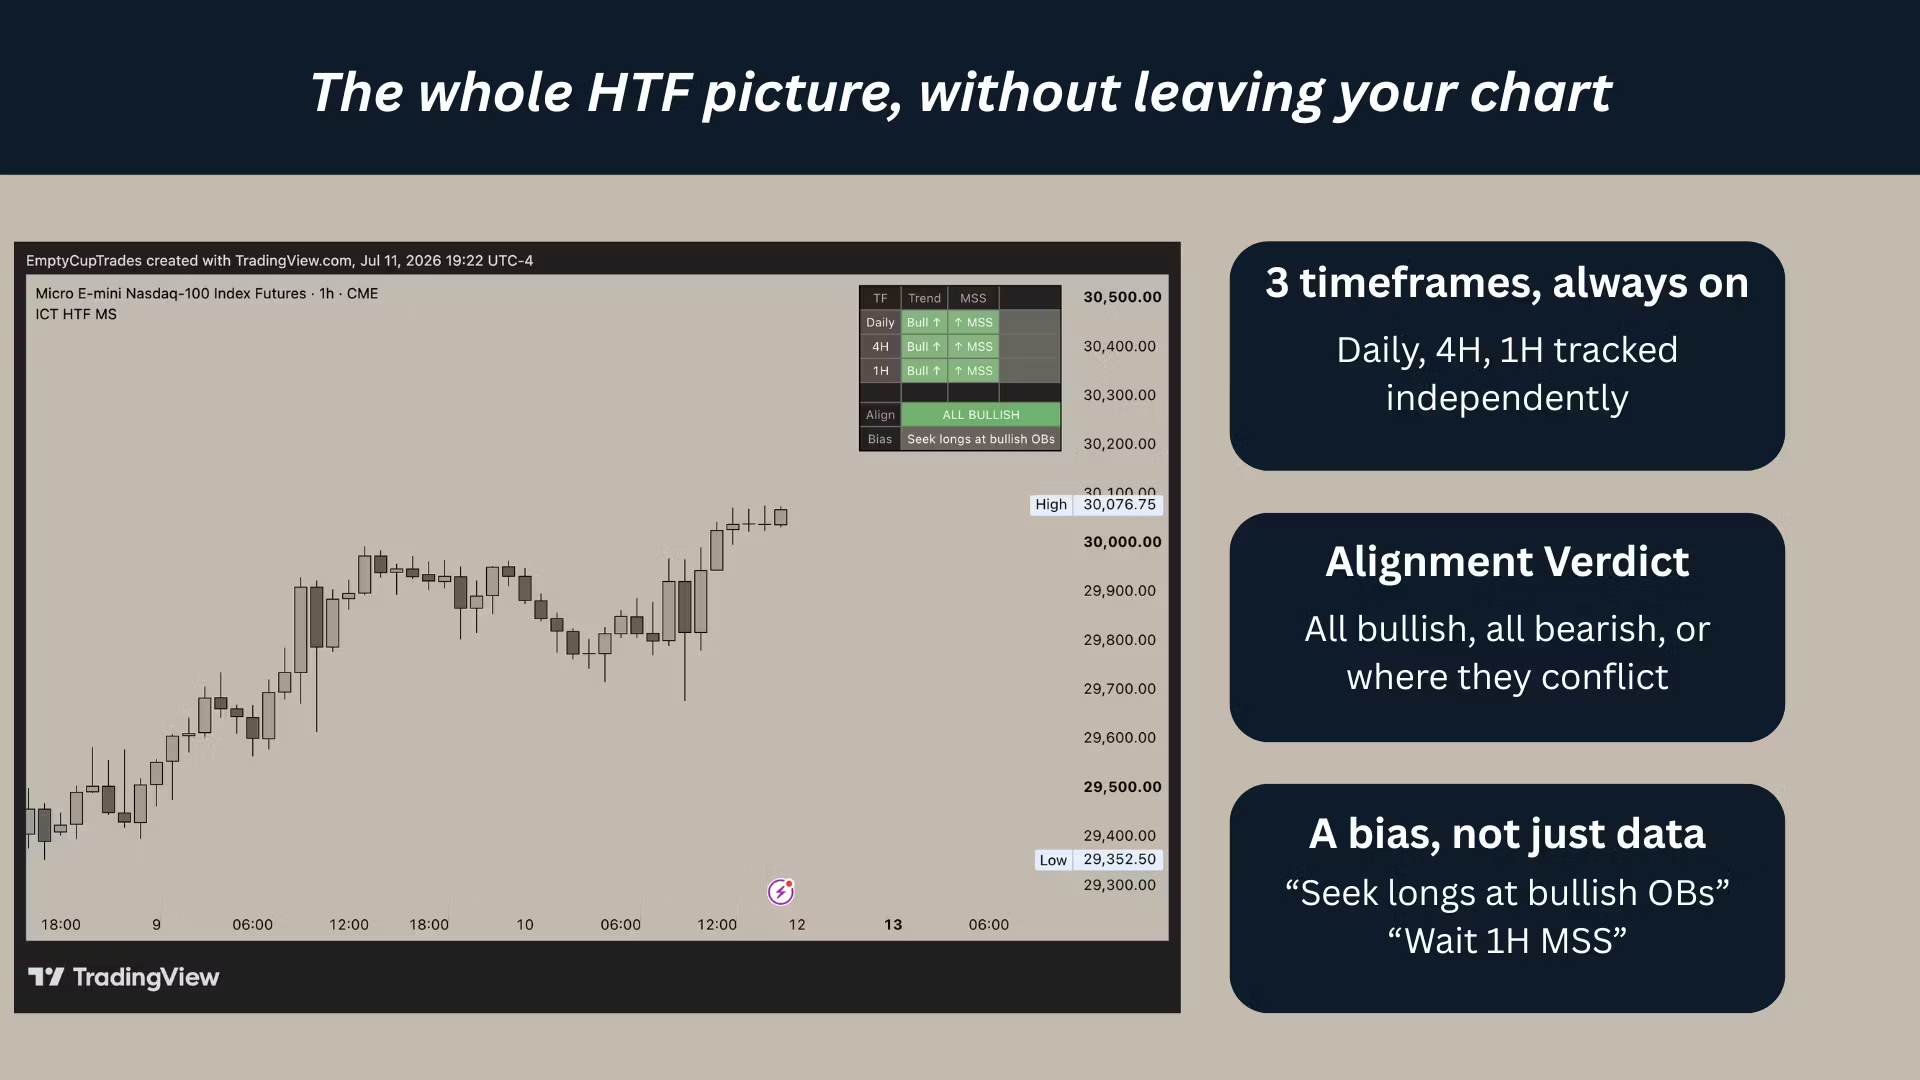
Tracks trend direction and market structure shifts across the Daily, 4-hour, and 1-hour timeframes simultaneously, displayed in a clean real-time dashboard in the top right corner of your chart.
Trend is determined by comparing the most recently confirmed swing high versus swing low on each timeframe. MSS updates automatically when price closes beyond the opposing swing level. The dashboard shows trend and MSS state for all three timeframes with color coding — green for bullish, red for bearish. An alignment row outputs a plain-language result — ALL BULLISH, D+4H Bull with 1H mixed, or No alignment. A bias row gives a direct instruction.
If all three timeframes are aligned you have your highest conviction bias. If mixed you know to reduce size or wait. Bias first, entry second — always.
Full setup guide and exact settings: https://youtu.be/6yeSQxhyUyw
Customer reviews
5.01 ratings
Top reviews
- 14 days ago