Seasonality Graph + Evaluation
€31.24€24.99 / monthSave 20%
+1 option
€24.99 / month
Analyze and validate seasonal market behavior
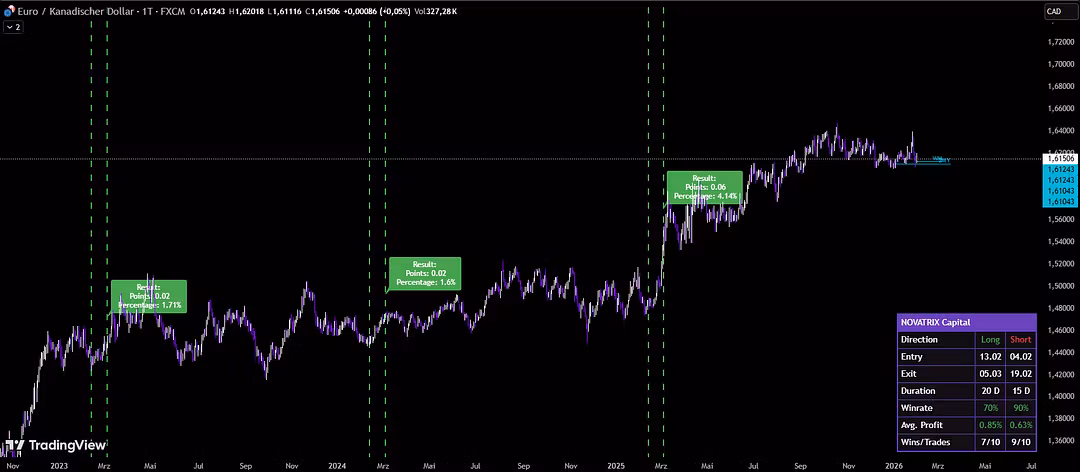
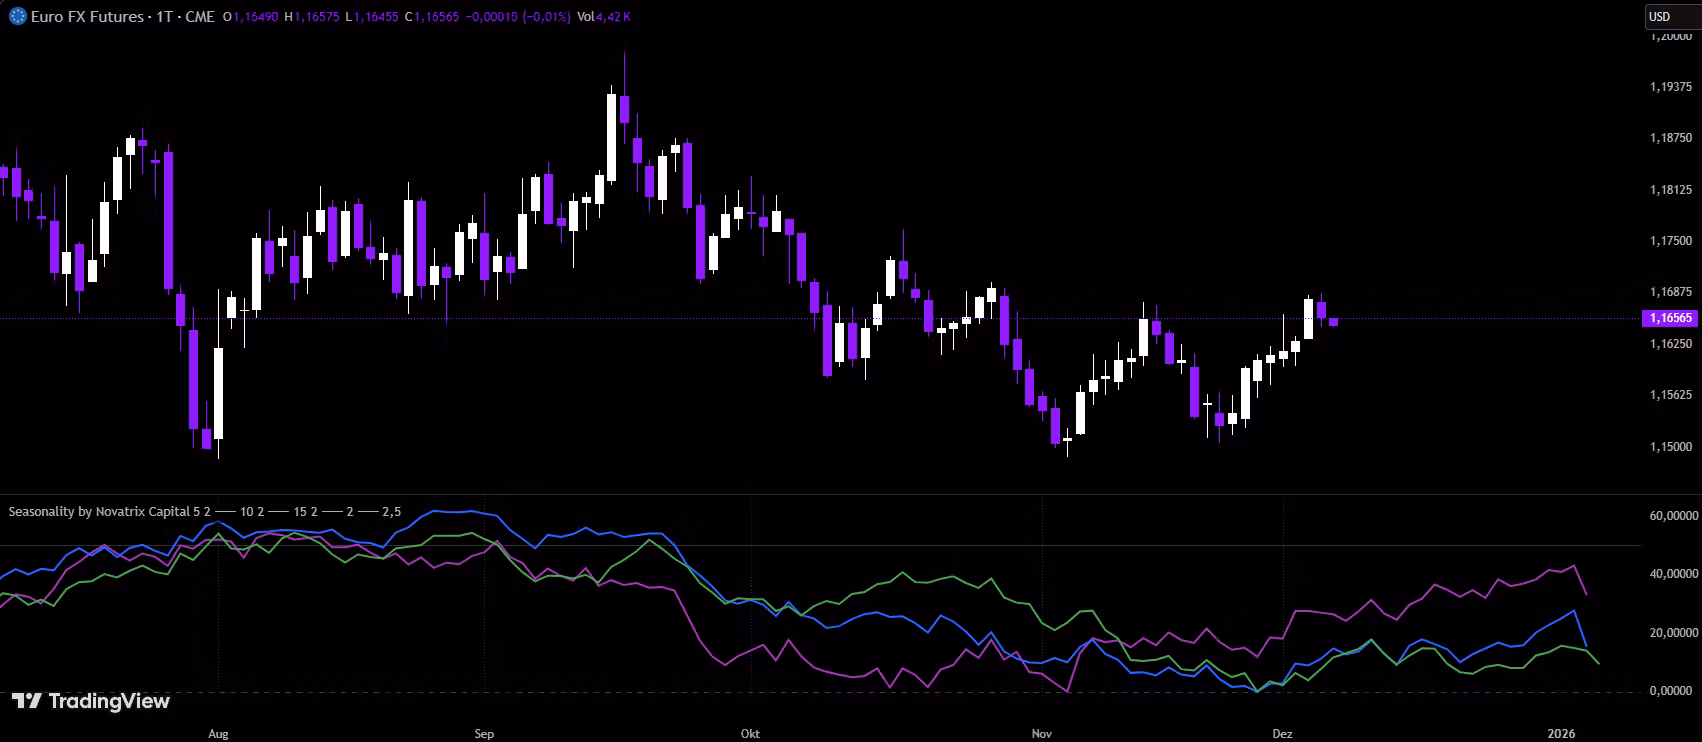
MAXIMIZE VISUALIZATION OF YOUR STATISTICAL EDGE. The Seasonality Graph overlays 5, 10, 15 and 20-year historical averages directly onto your live chart. Evaluate pattern strength in real-time.
After purchase, you will receive:
Full Access to the Graph + Evaluation Tool (TradingView).
Discord Access: Expert support & community.
Free Updates included.
Important: Enter TV username correctly! Activation happens on TradingView.
Note: Digital content: By purchasing, you agree to immediate execution; right of withdrawal expires prematurely.