Get 10% off your purchase.
Offer ends soon
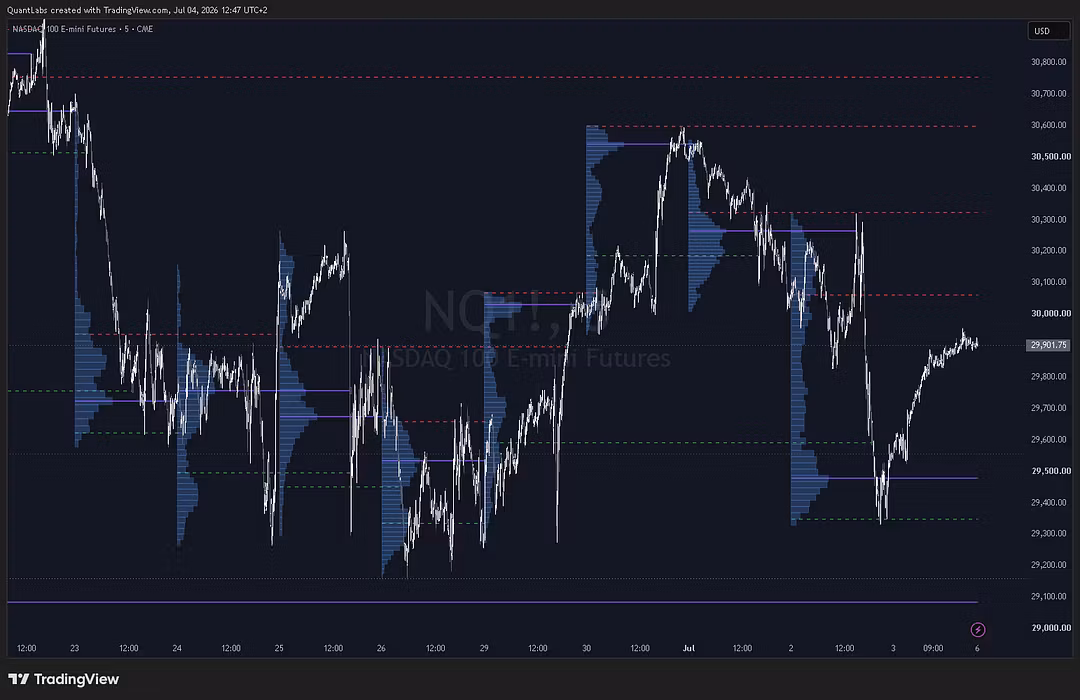
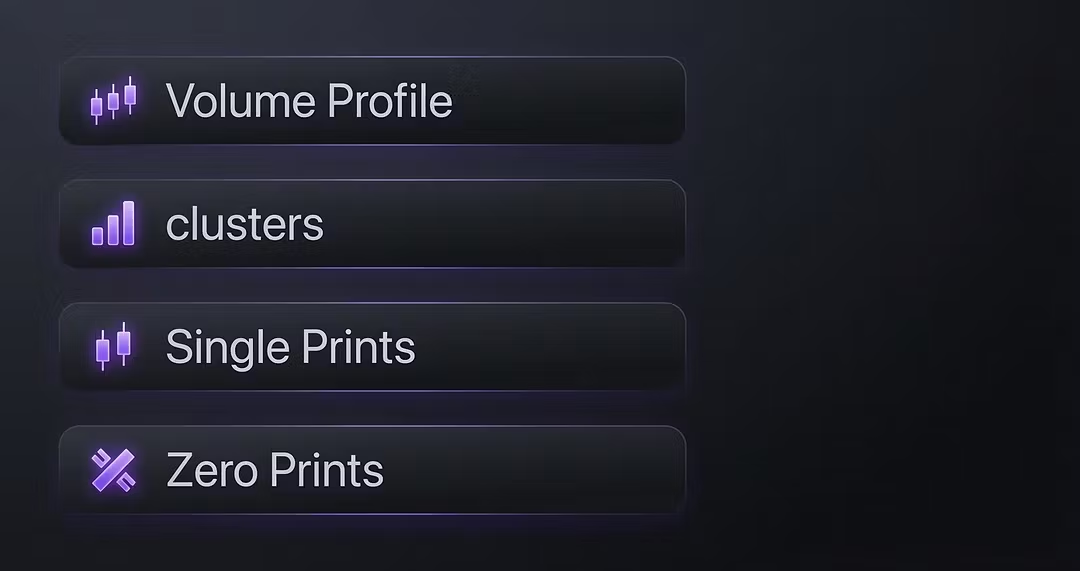
Clusters (need tv-premium)
$55.56$50Save 10%
$50
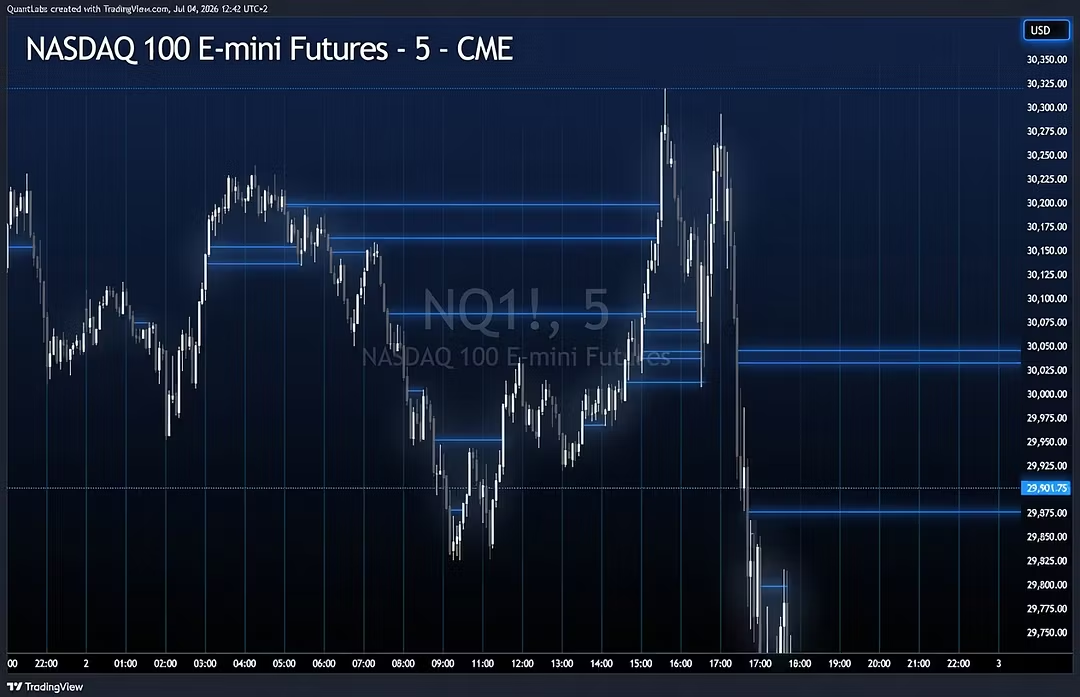
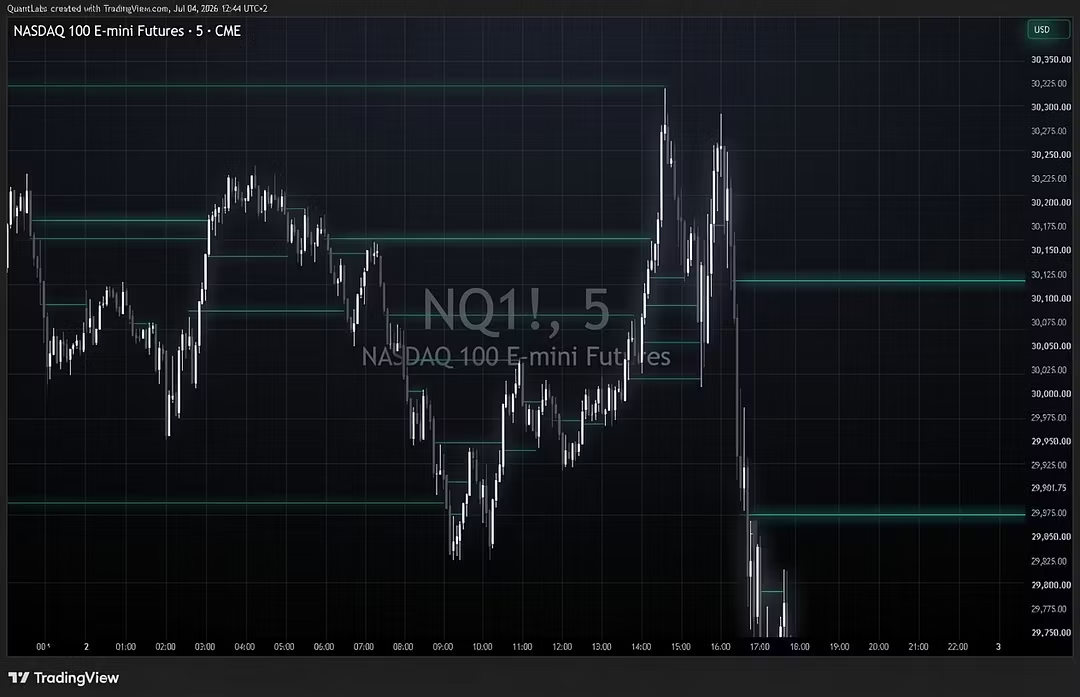
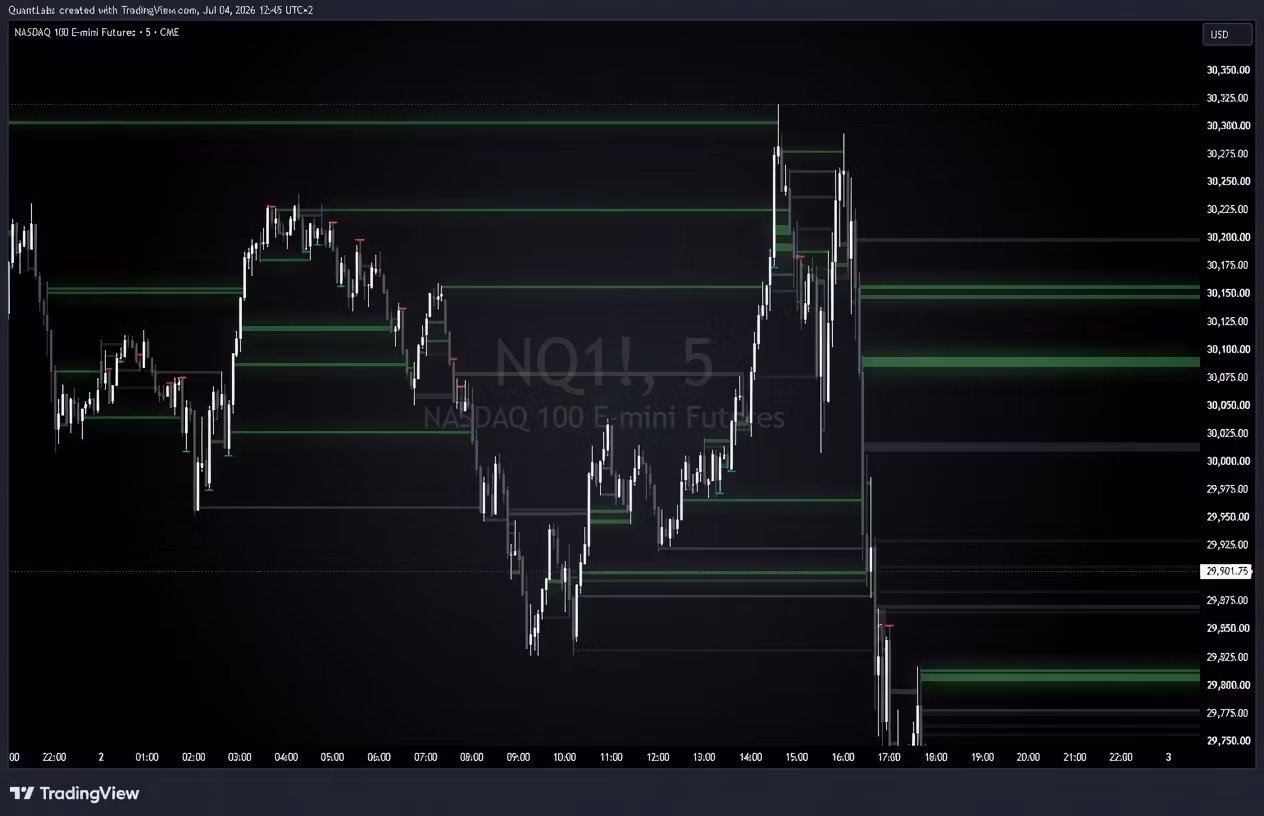
Key levels on the chart with strong onesided auction
Clusters, are an order-flow concept — they're built from footprint data, so they need the exact bid/ask volume at each price, which is why those files require TradingView Premium/Ultimate.
A cluster is a stack of consecutive price rows that all show the same-side imbalance — a run of levels where, say, buy (ask) volume dominates sell (bid) volume by a set ratio, printed on top of each other. One imbalanced row is noise; several stacked in a row is a footprint cluster, and it marks a zone of aggressive one-sided participation. Those zones tend to act as support/resistance because that's where committed buyers or sellers stepped in