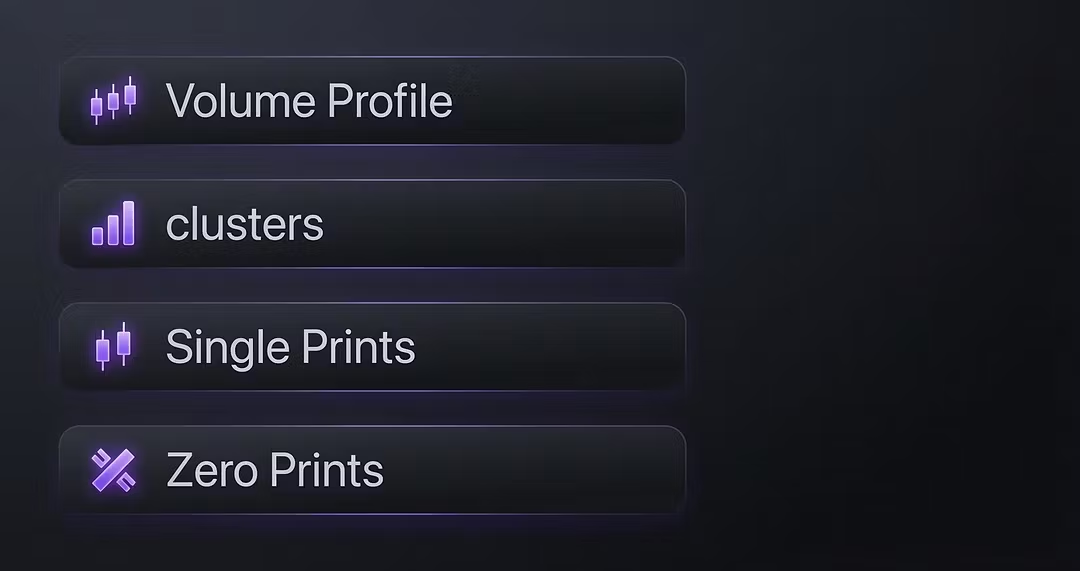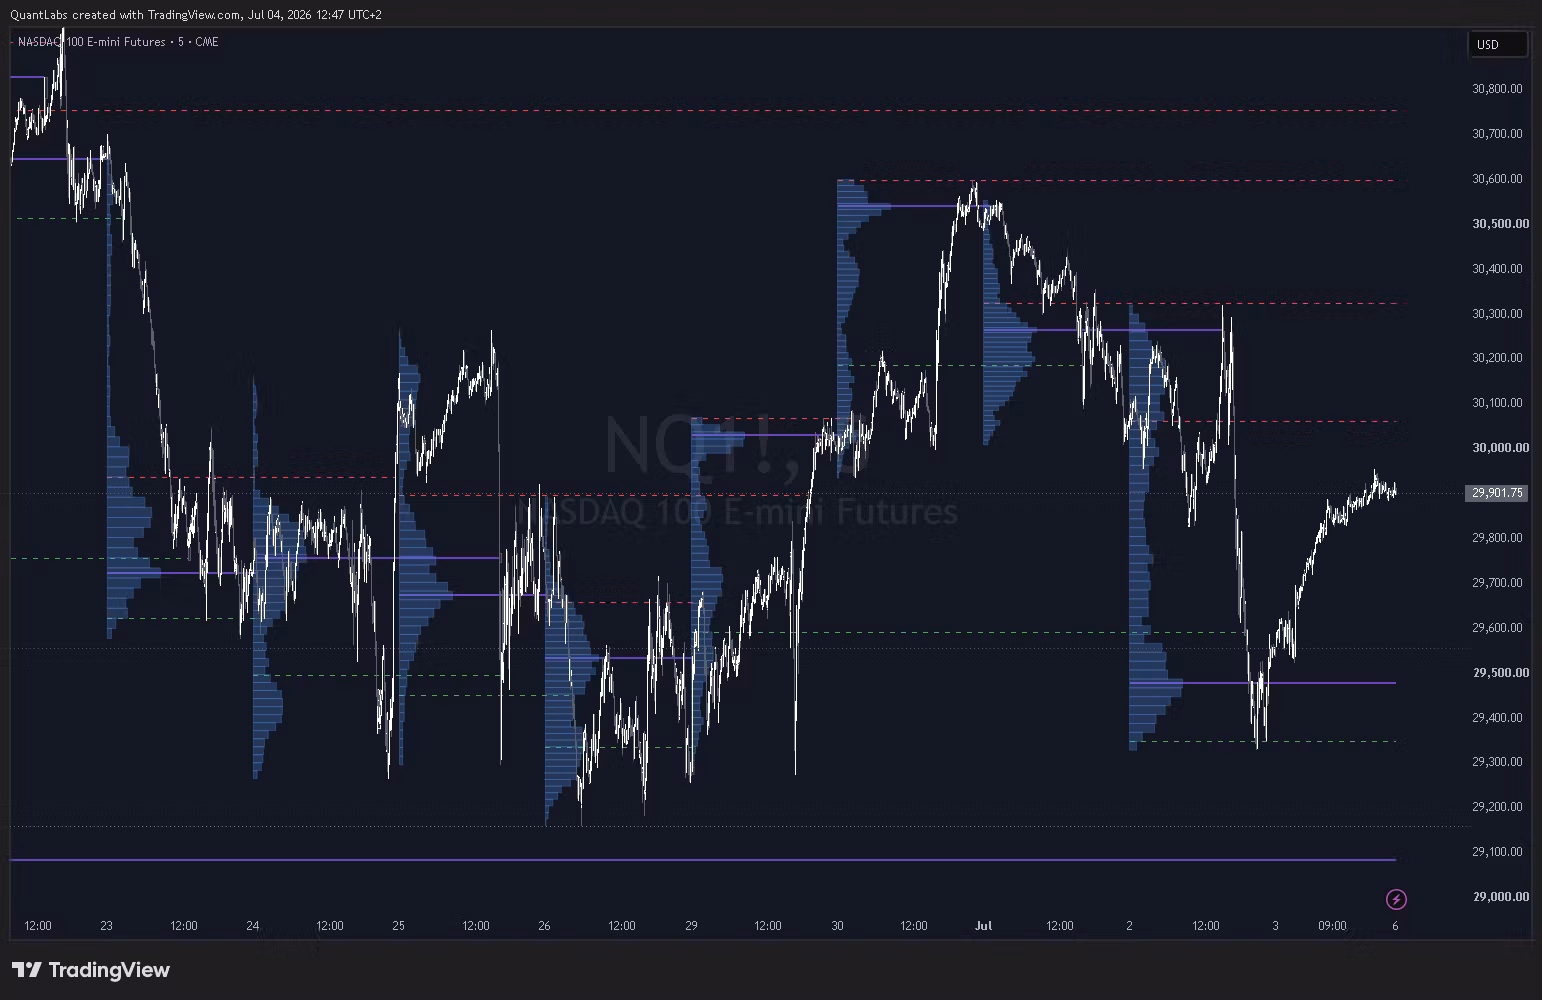
Volume Profile
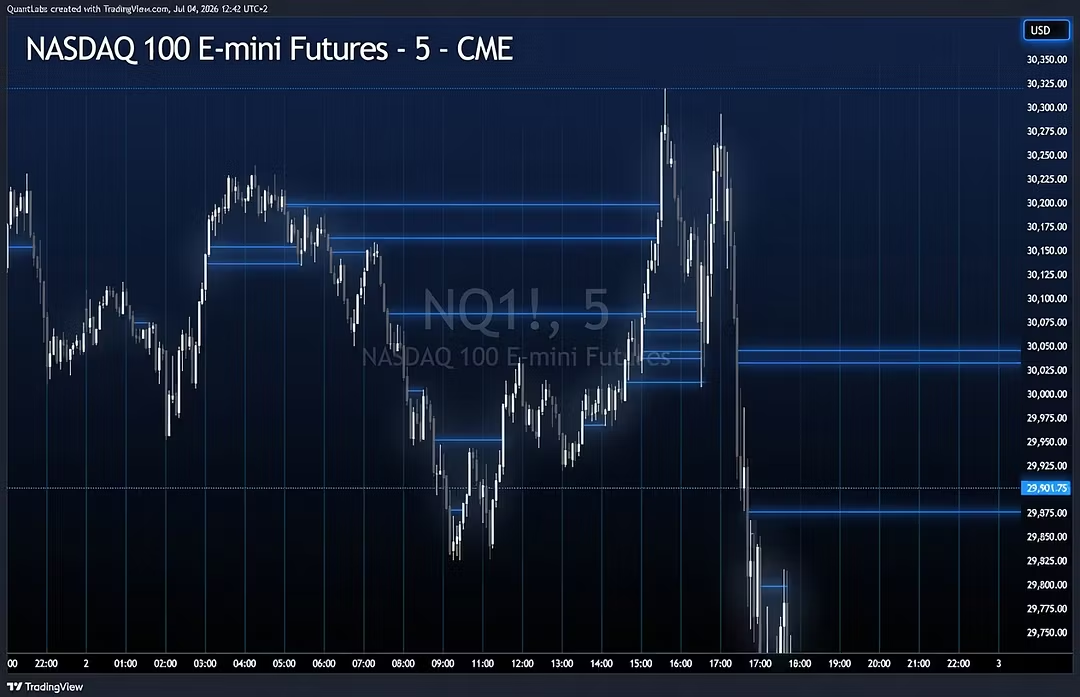
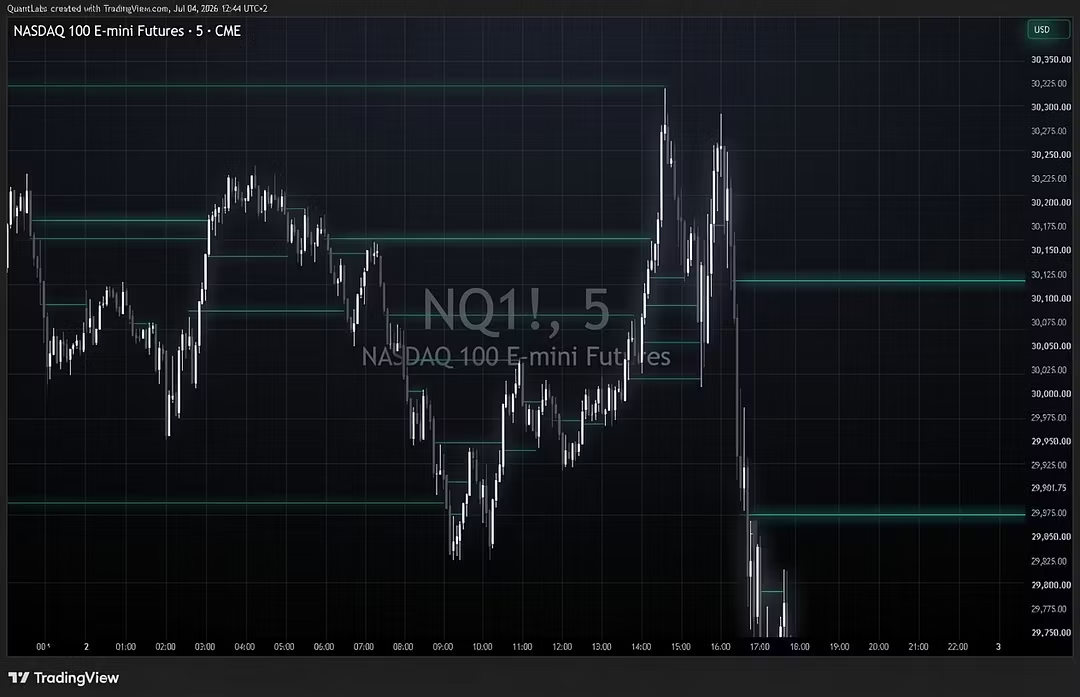
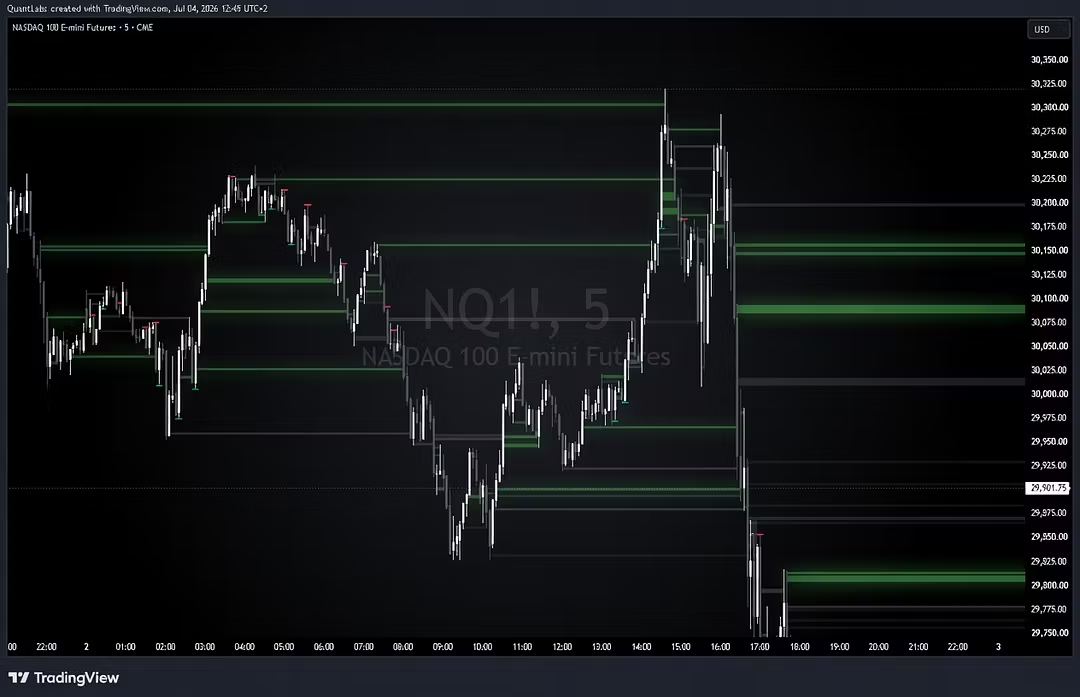
Key levels on the chart
POC (Point of Control) — the price row with the most volume/TPO activity in the profile: the single most-accepted, most-traded level. It's the profile's center of gravity and acts as a magnet — price tends to gravitate back to it.
VAH / VAL (Value Area High / Low) — the top and bottom of the value area, the price band containing ~70% of the session's volume/TPO (one standard deviation). Inside VAH–VAL is "accepted" value; outside is where the market spent little time. VAH and VAL act as the edges of balance — support/resistance that price rejects from or breaks to signal expansion.
"Naked" is the important qualifier: a naked level is one that has not yet been revisited/retested since it formed — a prior session's POC/VAH/VAL that price hasn't traded back to. Once price returns and tags it, it's "filled" and no longer naked. Naked levels carry weight precisely because they're unfinished business — untouched liquidity that tends to draw price back, so they're used as targets and reaction zones.