For enterpriseAPI
HomeDiscoverStart a business
Resources
AffiliatesBlogAbout
Get 20% off your purchase.
Offer ends soon
TProfile picture

Tradebrary

product image

3 Timeframe Trend

$62.5$50Save 20%
$50

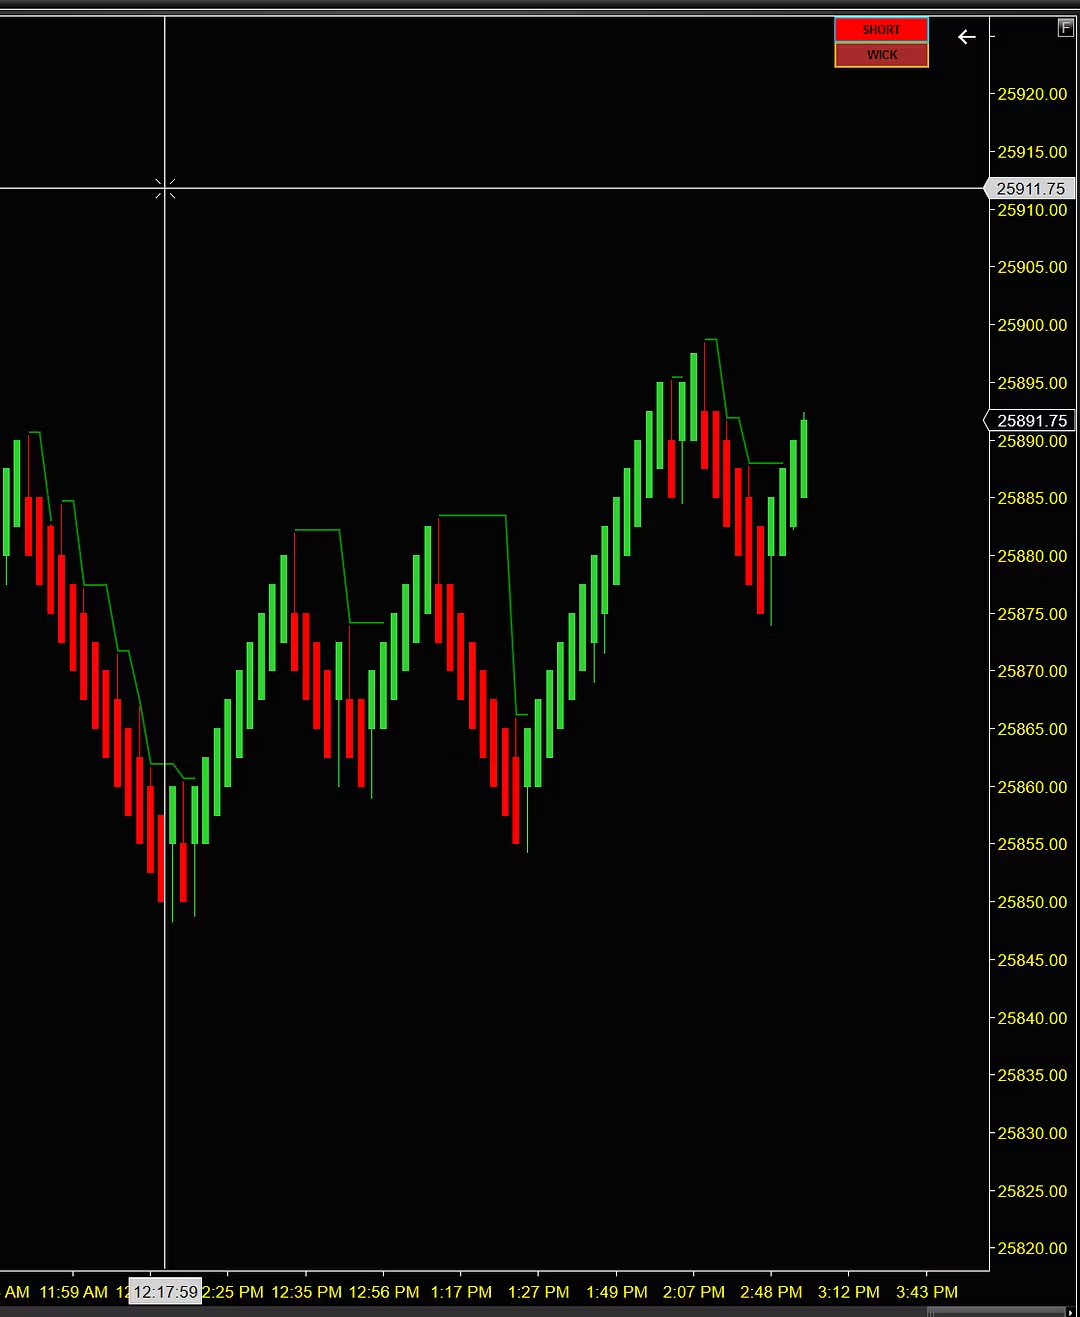
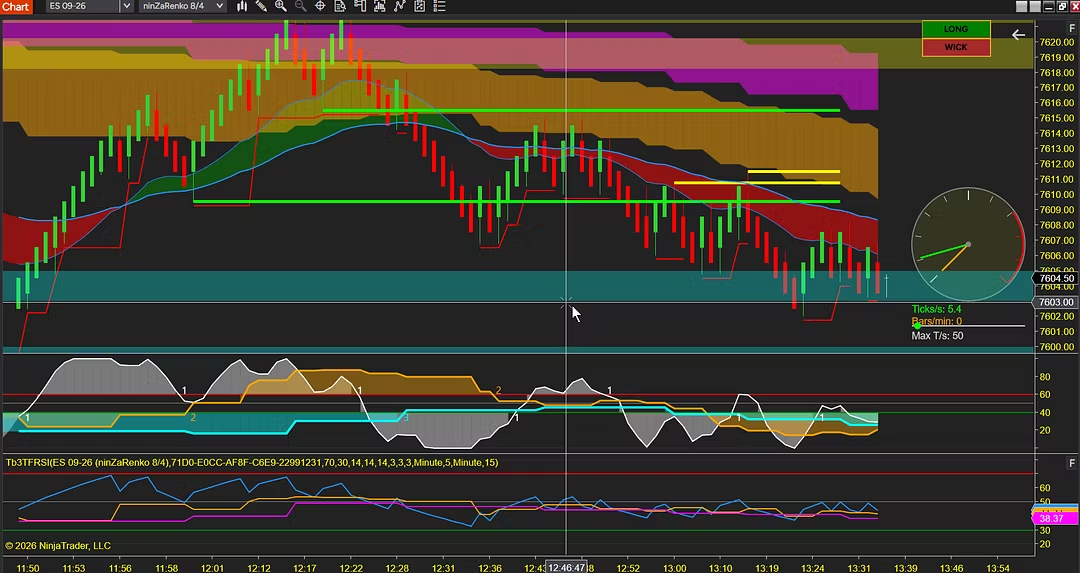
Visualize the trend using data from up to 3 timeframes

This indicator displays moving averages from three different timeframes simultaneously on your chart. Each timeframe shows a fast and slow moving average pair, with a colored region drawn between them to visualize the trend spread.

Tradebrary

3 Timeframe Trend

$62.5$50Save 20%
Powered by Whop
More from Tradebrary
product image
Free trial
TProfile picture
SPX-XSP Risk Graph VisualizerSee your SPX/XSP risk before you trade
$24.99$19.99 / monthSave 20%
product image
TProfile picture
3 Timeframe RSI for Ninjatrader 8RSI plotted using data from up to 3 timeframes
$62.5$50Save 20%
product image
TProfile picture
3 Timeframe Stochastics for Ninjatrader 8Stochastics plotted using data from up to 3 timeframes
$62.5$50Save 20%
product image
TProfile picture
Speedometer Indicator for Ninjatrader 8Speedometer Indicator
$62.5$50Save 20%
product image
TProfile picture
Support & Resistance Indicator for NinjaTrader 8Support & Resistance Indicator
$62.5$50Save 20%
product image
TProfile picture
Trailer Indicator for Ninjatrader 8Dynamic trailing stop tool
$87.5$70Save 20%
product image
TProfile picture
Support & Resistance -- Secondary Timeframe - for NinjaTrader 8Support & Resistance in a Secondary Timeframe
$87.5$70Save 20%
product image
TProfile picture
SuperDuperBundleSuperDuperBundle of Indicators for NinjaTrader 8
$386.67$290Save 25%