Get 20% off your purchase.
Offer ends soon
Support & Resistance -- Secondary Timeframe - for NinjaTrader 8
$87.5$70Save 20%
$70
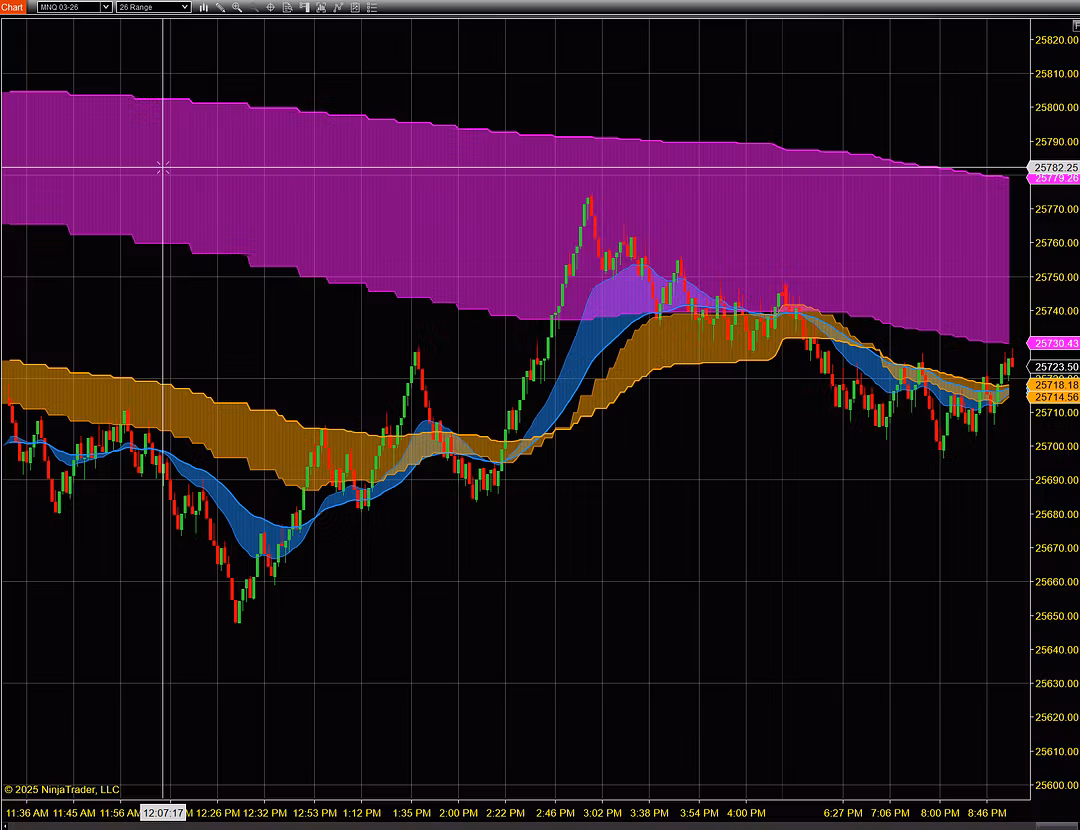
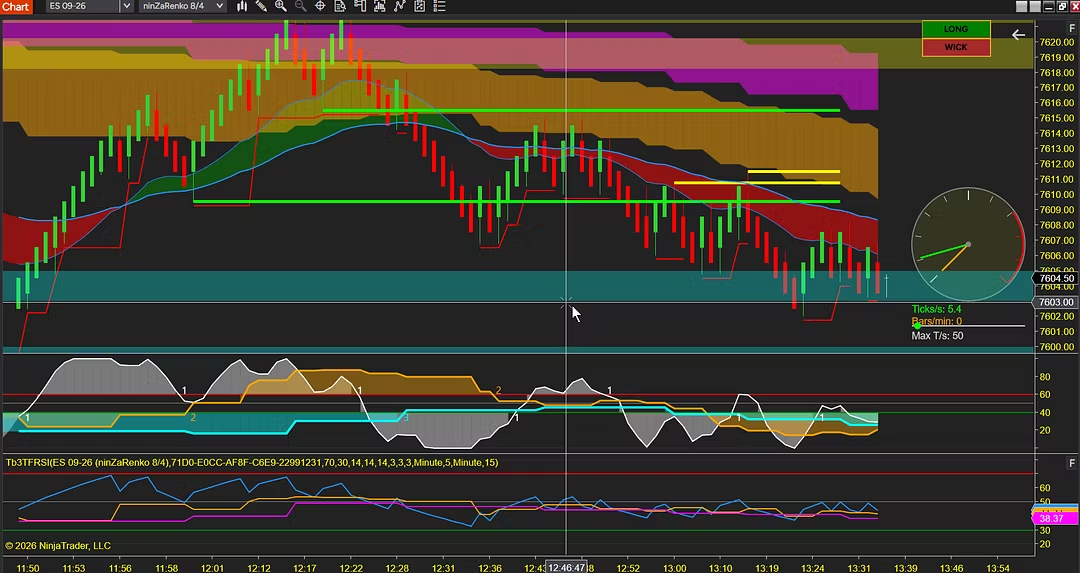
Support & Resistance in a Secondary Timeframe
This indicator finds significant price swings on a higher (secondary) timeframe that you choose, then draws those support and resistance levels right on your current chart. Trade a fast chart while seeing the levels that matter on, say, the 15-or 30-minute — without opening a second chart. Swing lows become support and swing highs become
resistance, drawn as clean lines or shaded zones.
.