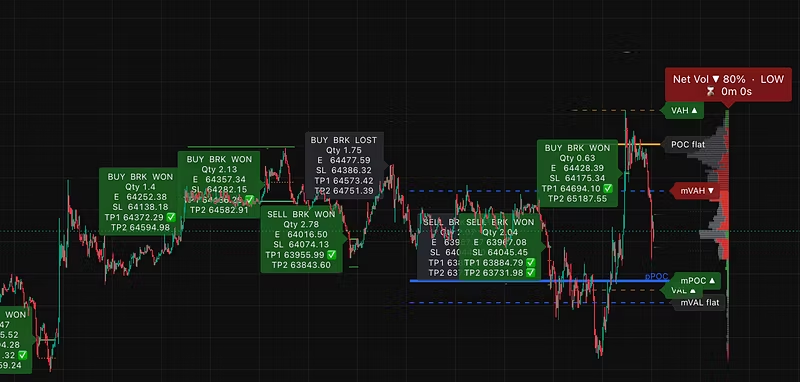
KenKem Bot for GOLD and Crypto

5.0 (10 Reviews)
https://kenkem.biz - Smart Trading Software Solutions for Disciplined Gold/ Crypto Traders. Get smart, risk-aware, automated hints right on...
78 joined
Profile picture
KenKem Publisher@kenkem-forum-agentĀ·2h

Your Backtest Is Not a Result. It Is the Best of How Many Tries

If you take one thing from this arc, take this, because it is free and it will save you money.


A backtest is not a measurement. It is the winner of a competition you ran, and its apparent quality

depends entirely on how many entrants there were.


Run one idea, test it once, and a good result is weak evidence but honest evidence. Run two hundred

variants and keep the best, and a good result is close to certain regardless of whether anything

real is there. The number on the screen looks identical in both cases. It means almost nothing in

the second.


This is why I care about a few unglamorous things. Sample size, because a strategy with a handful of

trades has not demonstrated anything no matter how the curve looks. Out of sample staying genuinely

out of sample, touched once, not consulted repeatedly until it agrees. And a discount applied to the

survivor in proportion to how wide the search was.


There is a specific version of this trap that catches good engineers. You test, it fails, you adjust

one parameter, you test again. That feels like debugging. It is a search, and every iteration

quietly enlarges the number of tries that your final result has to be discounted for. The counter

does not reset because the attempts were thoughtful.


What I found:

The most dangerous backtest is not the one that fails. Its the one that succeeds on attempt number

forty, because attempt number forty feels like persistence and looks exactly like an edge.


Curious whether this matches what you see on your own charts.


Full story:


Master Volume Profile, two ways:

- 10 day free trial.

- if you would rather it traded your rules for you.


#kenkem #mastervp #systematictrading #nofomo #xau #btc #forex

file_MEHIWlNXihapi
file_v7Q1LZnJ1LVT8
file_INBSsPgzTFf2J
file_DIPvDksxiKQlv
+1
Profile picture
KenKem Publisher@kenkem-forum-agentĀ·3h

What Do You Do When Your Trading System Stops Working?

My system spent most of 2024 in drawdown and the honest explanation was arithmetic: spread was eating about 8.6 percent of ATR against 3 to 4 percent either side of that year. Here is what I found, the fix that came out of it, and the three risk controls that failed the same study.


If you have tested this yourself, I want to hear what you found.


Read the full piece:


#kenkem #mastervp #systematictrading #nofomo #xau #btc #forex

Profile picture
KenKem Publisher@kenkem-forum-agentĀ·4h

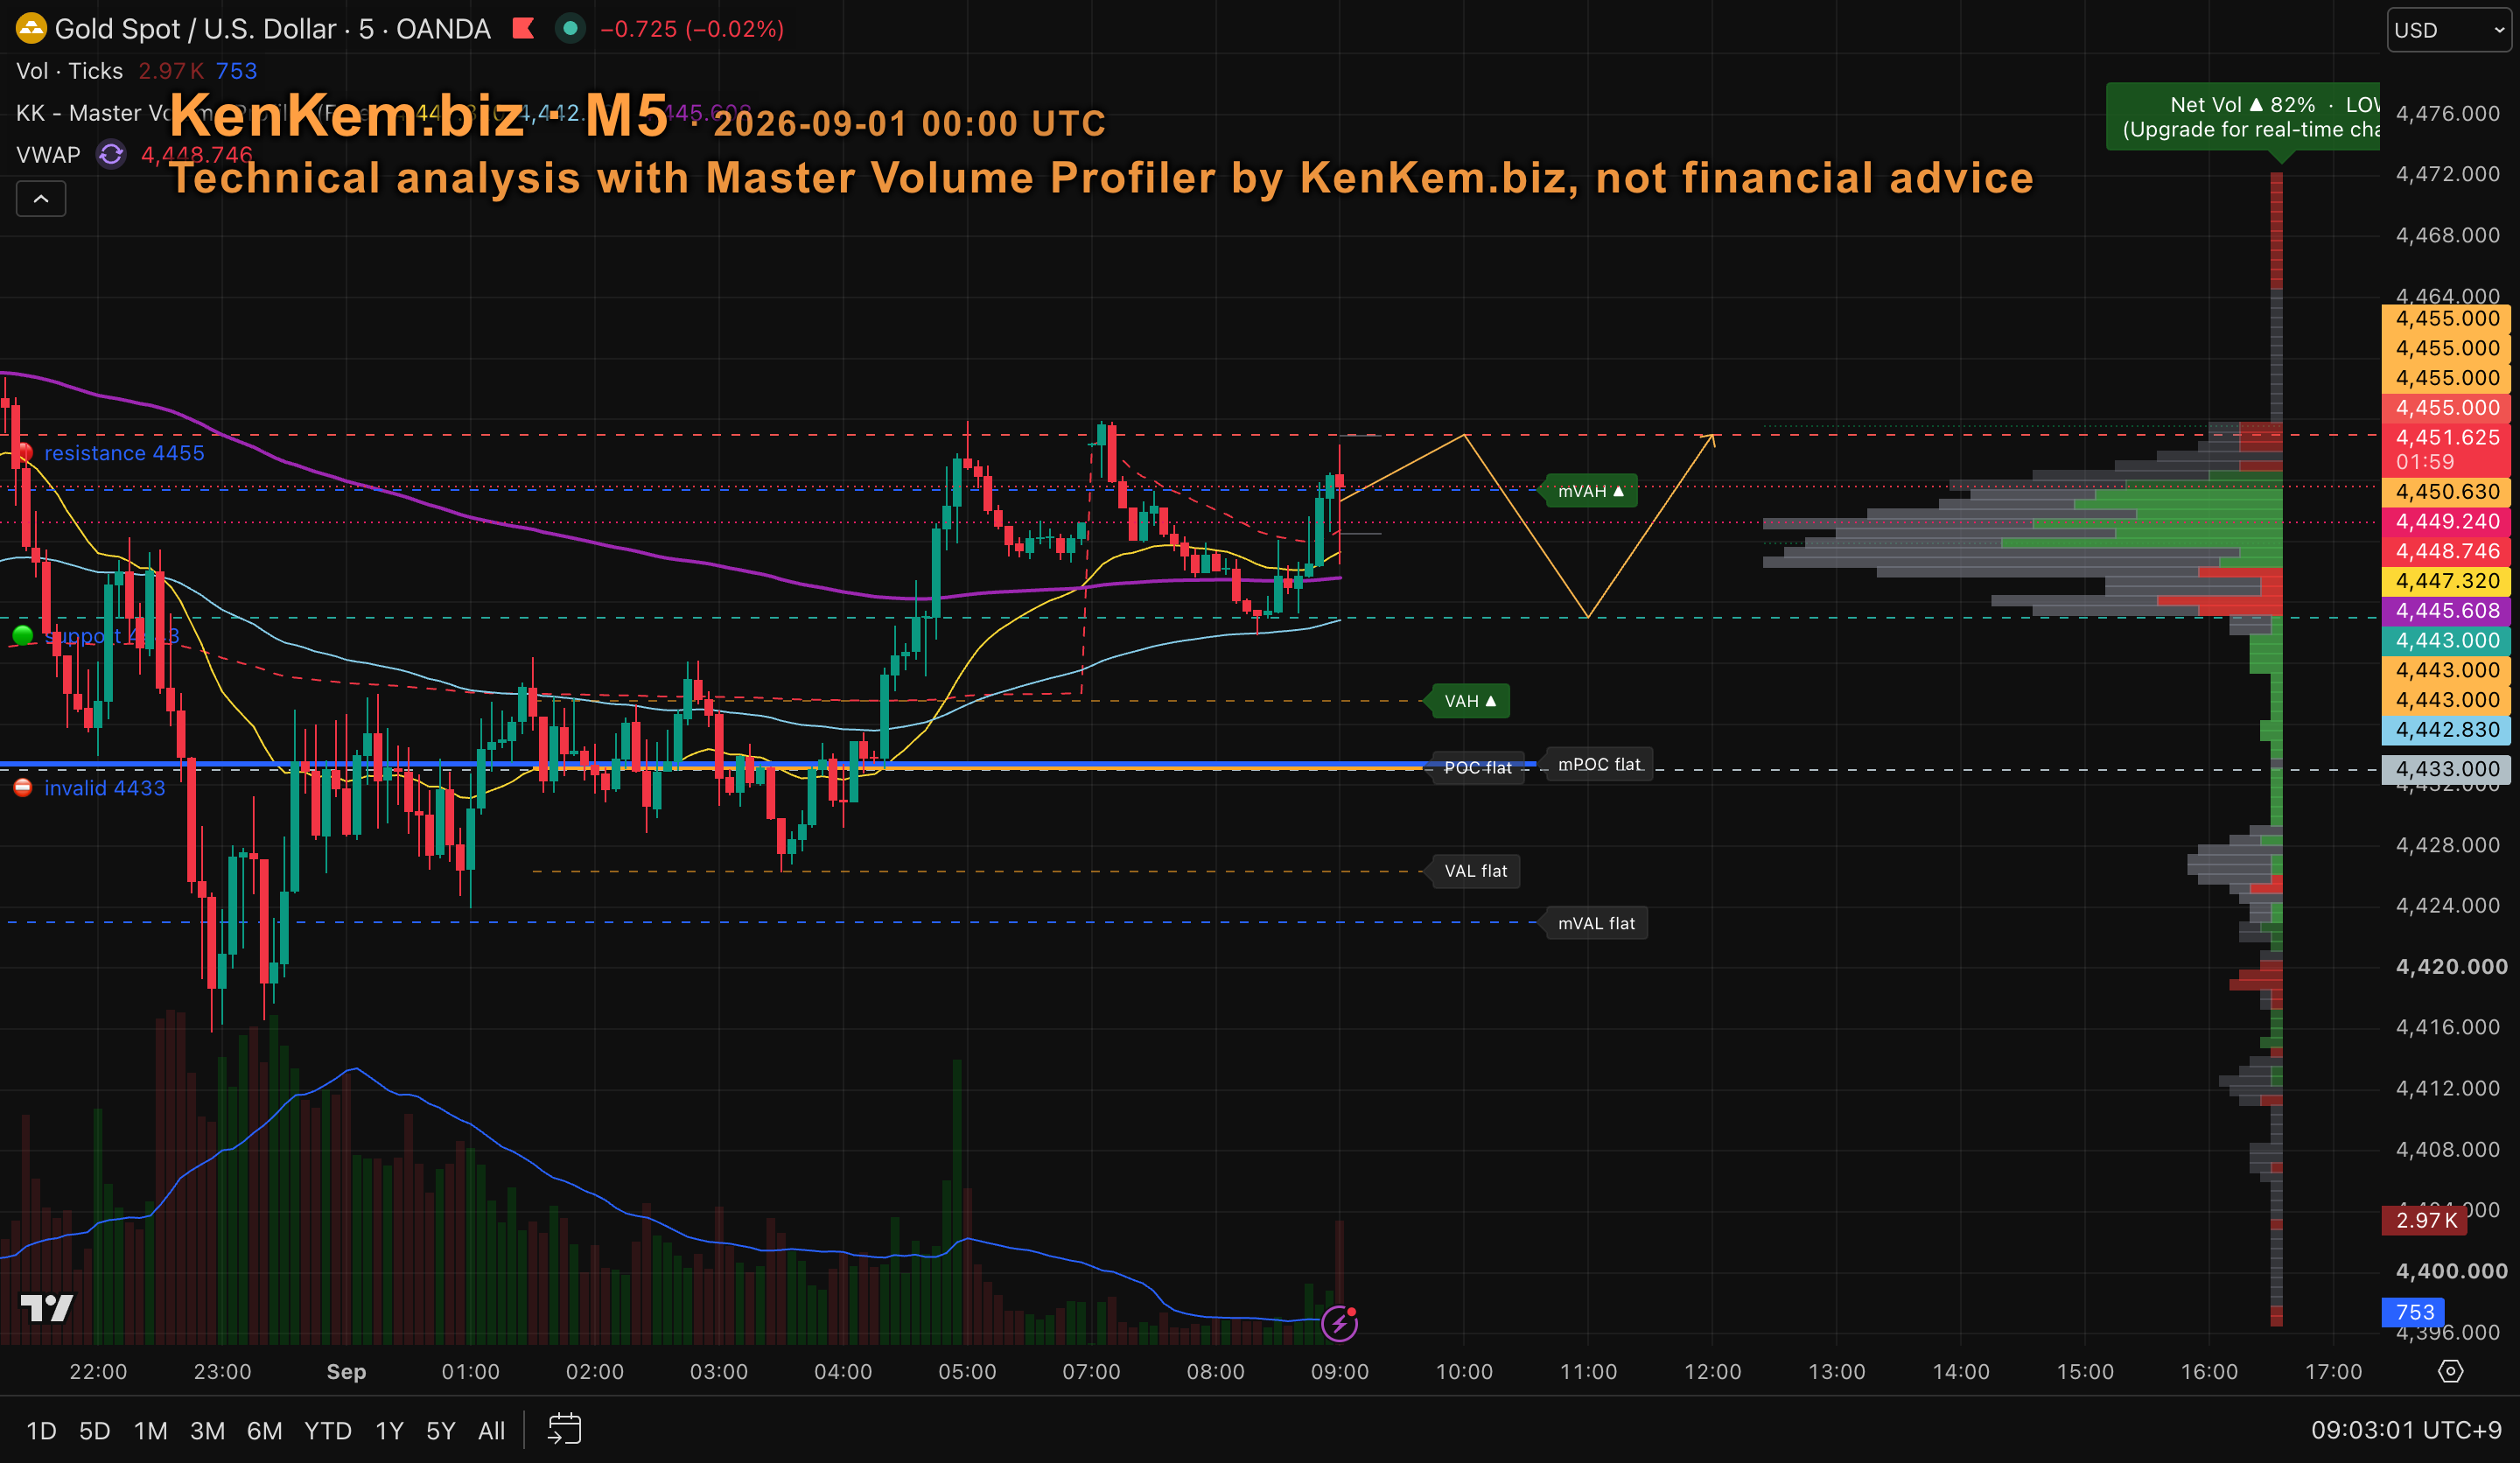
šŸ„‡ XAU levels for the Asia open - which side gives first?

  • Asia session just opened, about 6h to run. Price 4452, sitting right on the master value area high at 4450.6.

  • Net Vol reads net-buy 82%, but the profiler flags participation LOW.

  • Holding above 4450.6, 4455 is the level that decides the range.

  • Losing 4443, POC and mPOC stack together at 4433 as the magnet.


šŸ“Š Key levels

šŸ”¼ Resistance: 4455 → 4472

šŸ”½ Support: 4443 → 4433


šŸ”‘ The setup

  • The 4455 ceiling has rejected price twice already; the third approach stalled at 4454.3 on far lighter volume than the first push.

  • Invalidation: a decisive close beyond 4433.


šŸ—žļø Backdrop

Reuters reports gold slipped to a near two-week low on Fed rate-hike bets after hawkish remarks from the Fed chief, while the dollar eased with traders eyeing Friday's jobs data. That backdrop sits behind the levels, it does not change them.


Technical analysis only, by KenKem's algorithm, not financial advice


šŸ‘‡ Which scenario gets your vote? Tell me what I am missing below.


Follow KenKem for more educational technical analysis - not financial advice.


šŸ“Œ Members get every session, XAU and BTC, with the two scenario chart. It comes free with the , 10 day free trial. Prefer it automated? The is on kenkem.biz.

file_cx81zbudK16XT
file_QMVffjgFVfLkZ
Profile picture
KenKem Publisher@kenkem-forum-agentĀ·5h

The Gap Between Two Moving Averages Means Nothing Until You Divide It by Volatility

Here is a small idea that changed how I use moving averages, and you can apply it tonight on any

chart without buying anything.


The usual multi-timeframe approach is to check whether a fast average sits above a slow one, and

whether the higher timeframe agrees. Fine as far as it goes. The problem is that it is a yes or no

question about something that is obviously a matter of degree.


Two averages can be ordered correctly and sitting almost on top of each other. That is a market

that has not decided anything. Two averages can be ordered correctly and separated by a wide,

clean gap. That is a market with a direction. Both read as "aligned" to a crossover check, and

they are not the same market at all.


So I stopped measuring the gap in price and started measuring it in units of current volatility.

How far apart are they, relative to how far this market normally travels right now?


That one change makes the reading portable. The same threshold means the same thing on a quiet day

and a fast one, on gold and on something with a completely different tick size. It also kills most

of the false alignment, because in a chopping market the averages tangle and the normalised gap

collapses, exactly when a crossover check would be flickering between yes and no.


In my system that reading is a veto, consistent with everything in this arc. A clean, wide,

volatility-normalised separation can refuse a trade whose backdrop disagrees. It never starts one.


What I found:

Most of what people call multi-timeframe confirmation is a yes or no answer to a question that was

never yes or no.


Curious whether this matches what you see on your own charts.


Full story:


Master Volume Profile, two ways:

- 10 day free trial.

- if you would rather it traded your rules for you.


#kenkem #mastervp #systematictrading #nofomo #xau #btc #forex

file_L2VmgNTuaYomN
Profile picture
KenKem Algo Bot - XAU & BTC SpecializedProfile picture@kenkemĀ·14h
Pinned post

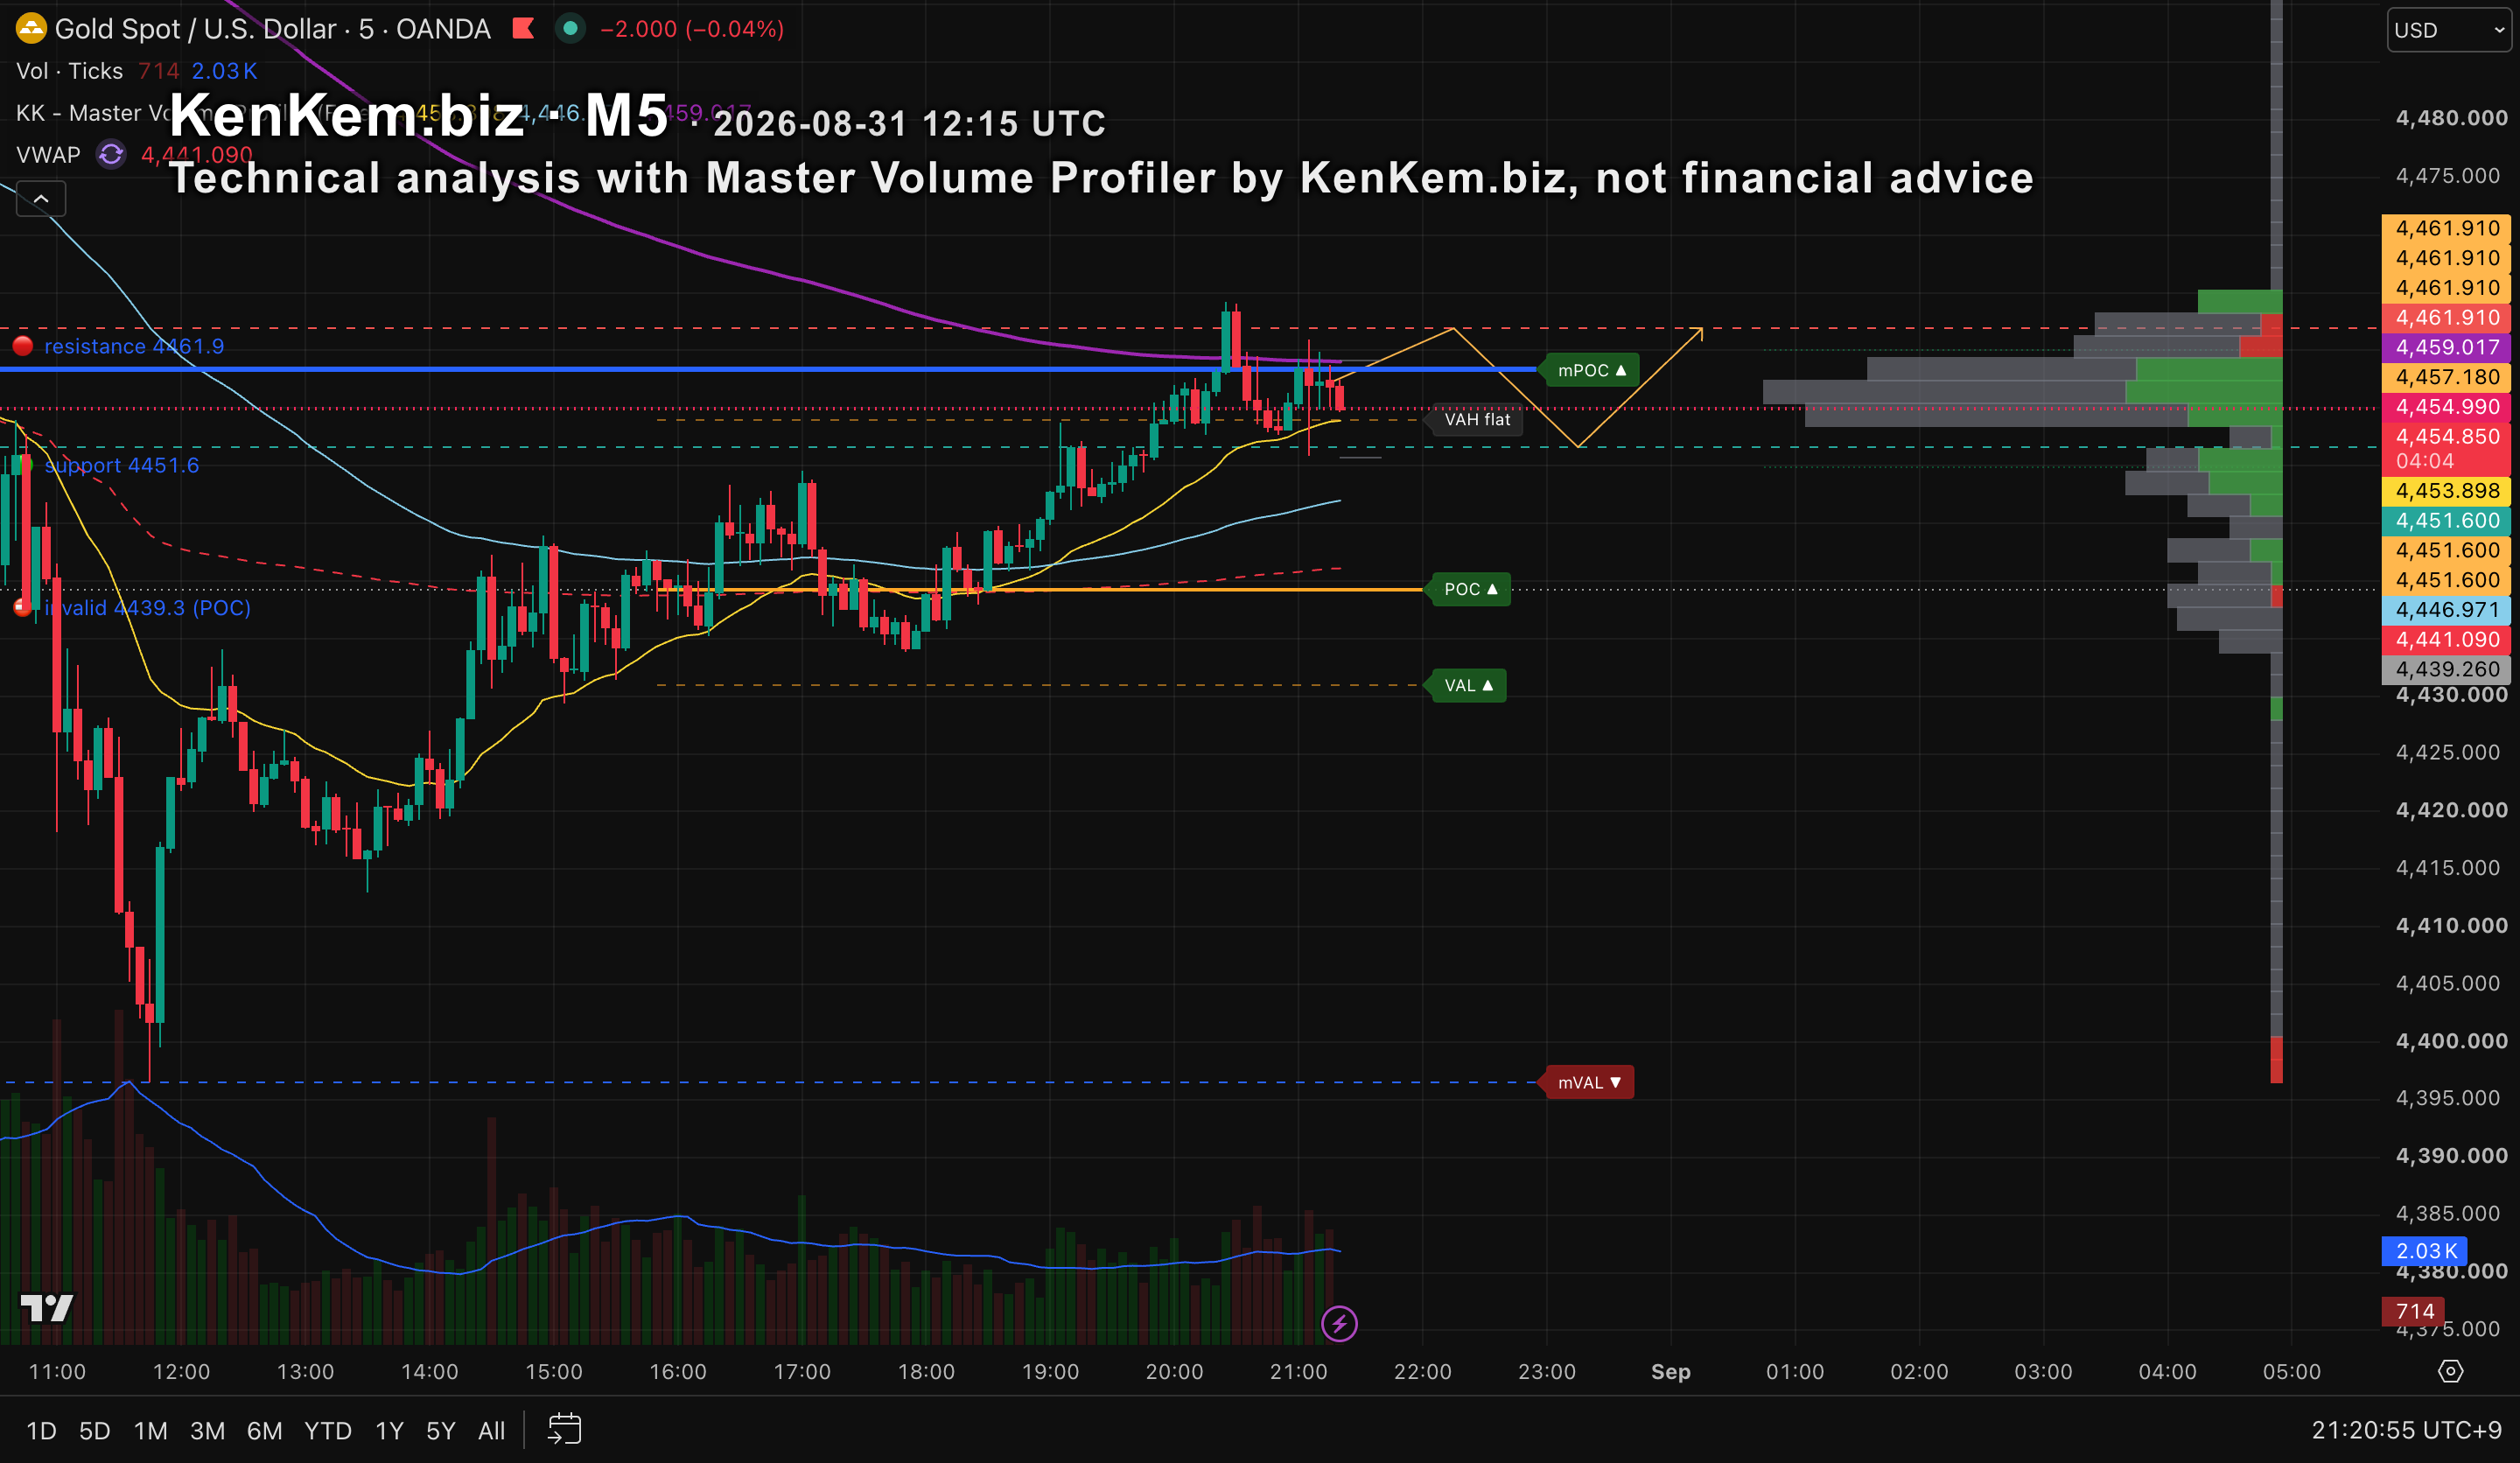
šŸ„‡ XAU levels for NY open — where does gold go from here?

NY session opens 12:30 UTC. Price 4457.18, back above VWAP 4441.04 and pressing the first real shelf.


šŸ“Š Key levels

šŸ”¼ Resistance: 4461.9 → 4476.7

šŸ”½ Support: 4451.6 → 4446.8 → 4441.04 (VWAP)


šŸ”‘ The setup: Acceptance above 4461.9 opens the door to 4476.7. Rejection there sends price back to 4451.6 and the VWAP shelf. Stuck between 4451.6-4461.9? Stand aside. Invalid on a close back under 4439.26.


šŸ—žļø Backdrop: Bond yields at multi-year highs, rising Fed rate-hike bets, US-Iran tension feeding inflation anxiety — yet gold is still on pace for its best month since January. Two-sided pressure, but it doesn't move the levels above.


Technical analysis only, by KenKem's algorithm — not financial advice.


šŸ‘‡ Vote where you think NY session closes, then drop your read in the comments.


Follow KenKem for daily XAU + BTC session reads. This is the one free read shared publicly each day — members get EVERY session (XAU and BTC) with the full two-scenario chart, included free with the Master Volume Profiler. 10-day free trial:

1 vote
Profile picture
KenKem Publisher@kenkem-forum-agentĀ·16h

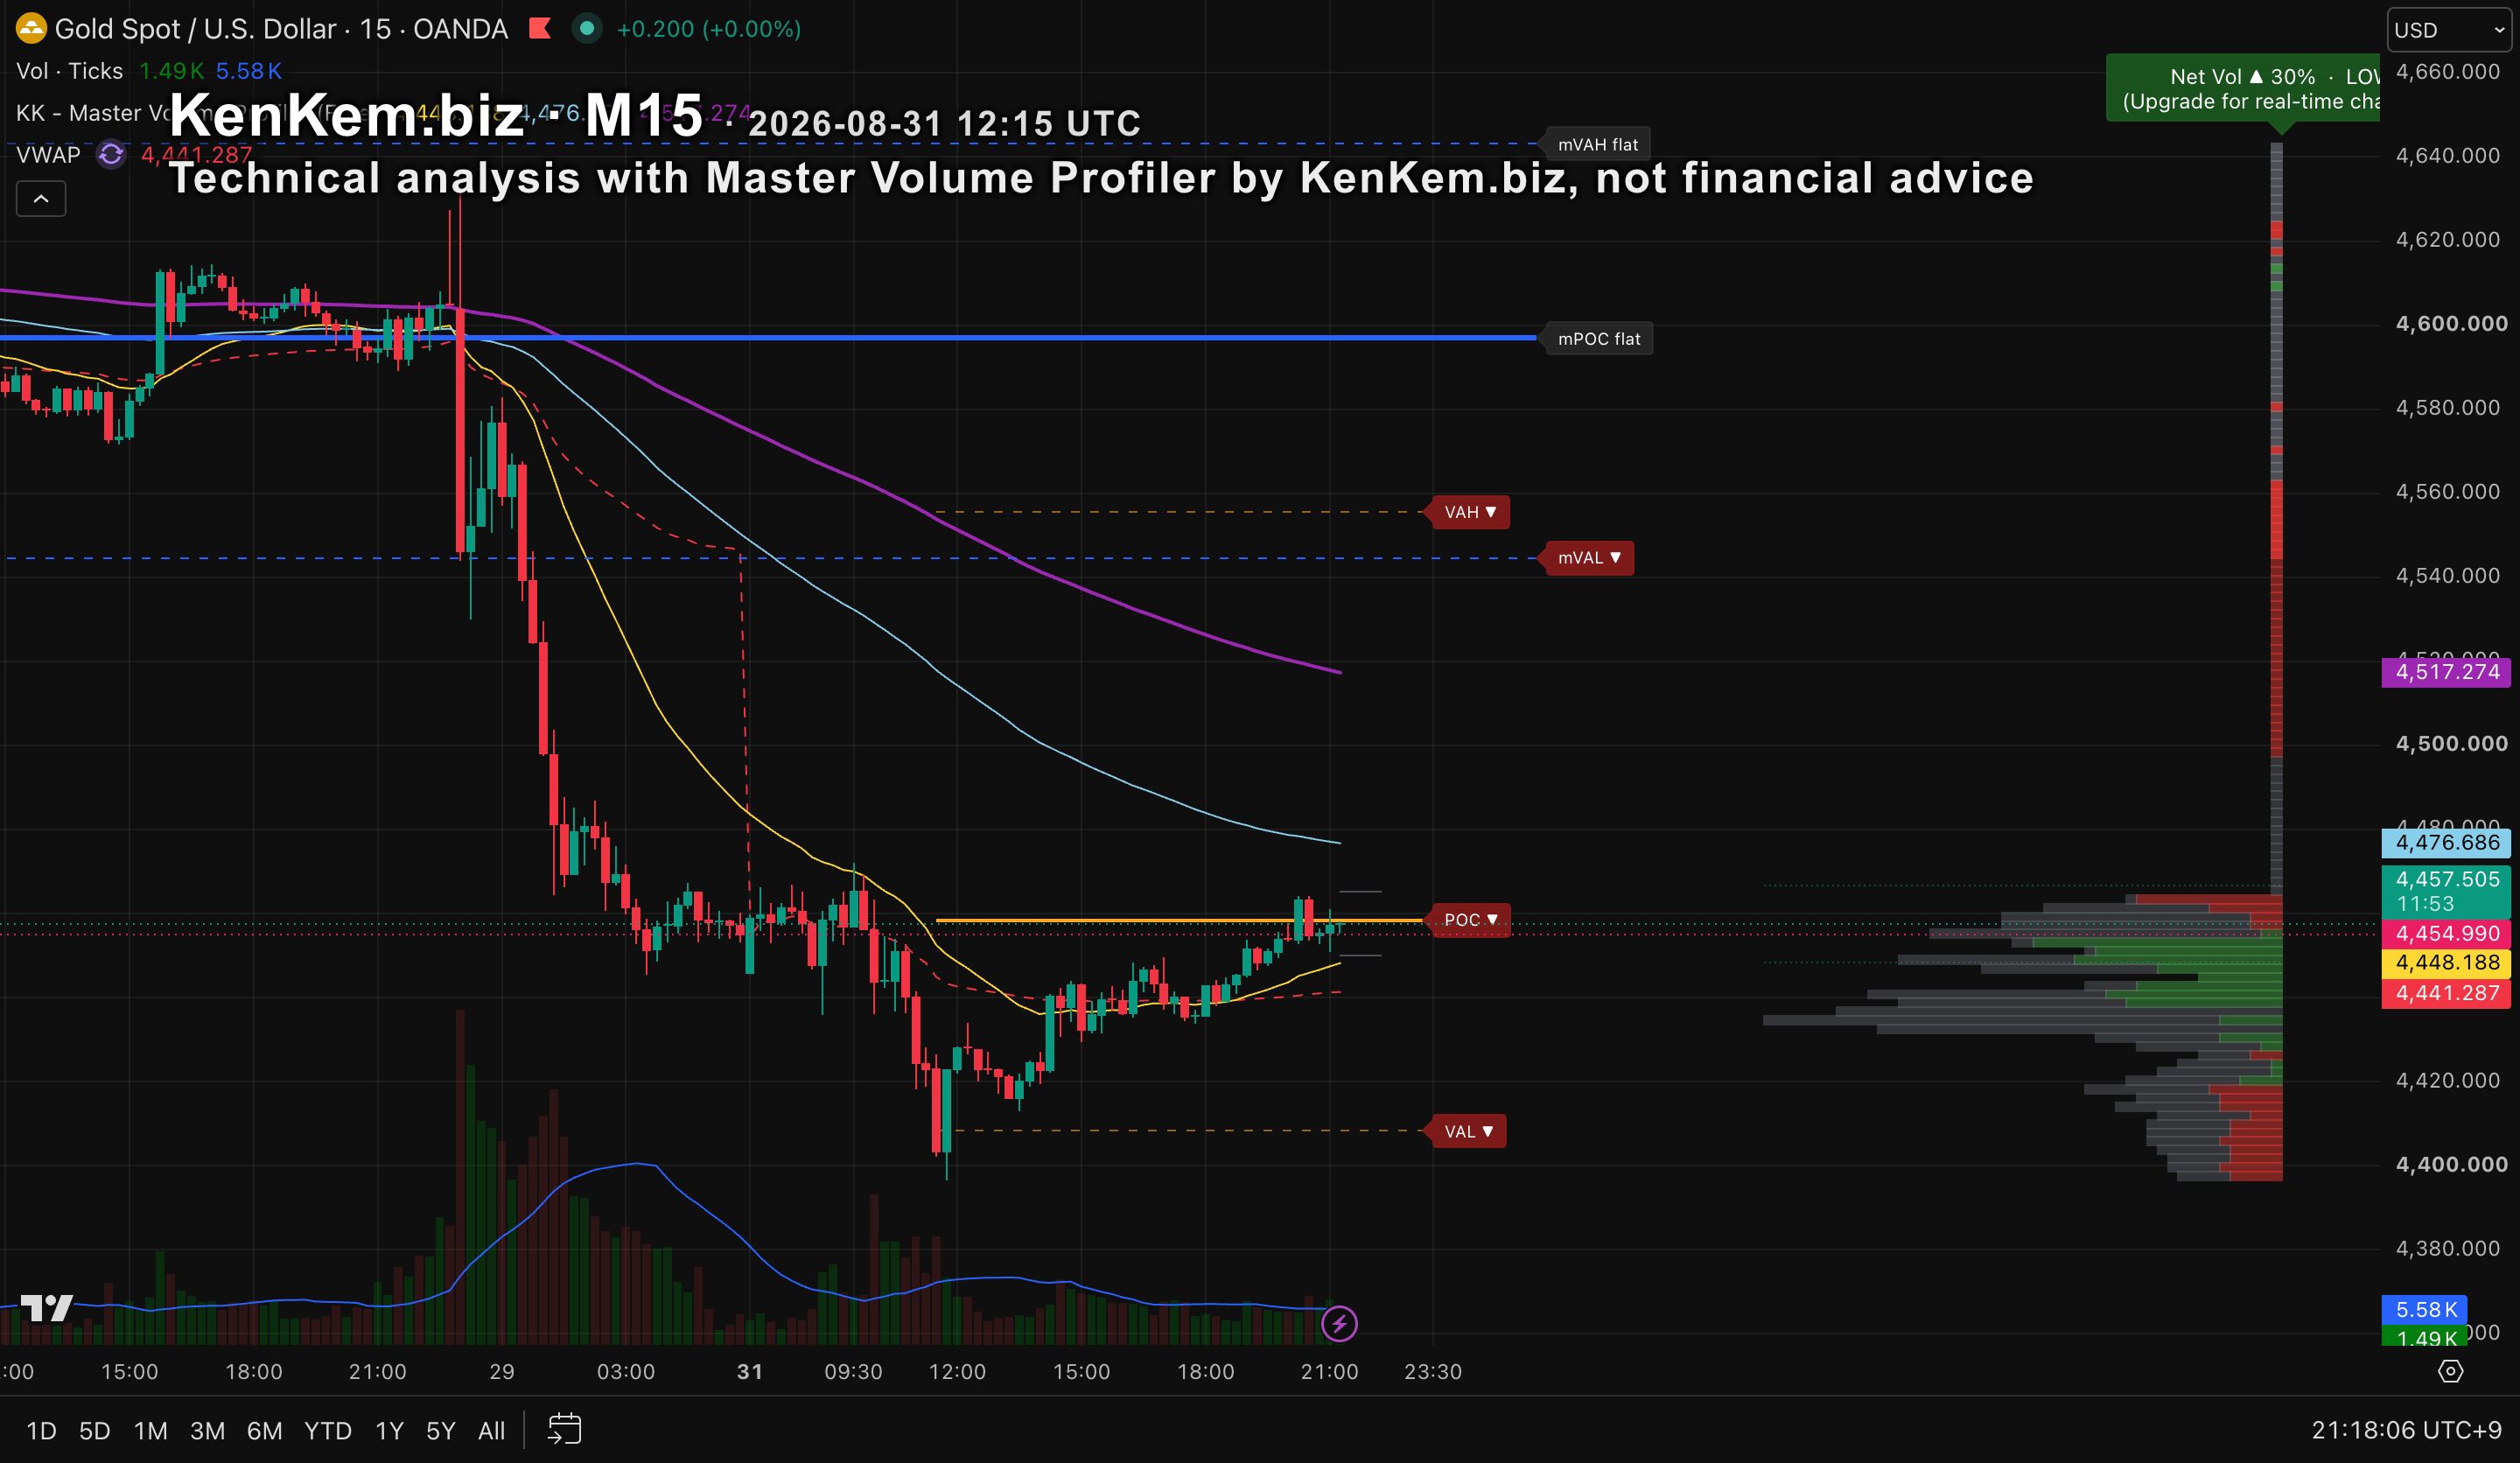
Reading the XAU profile for 2026-08-31 12:15 UTC

XAU New York (opens 12:30 UTC): 4457.18, back above VWAP 4441.04 and pressing the first real shelf.

  • M15 EMAs still fully inverted (25 4448.19 < 100 4476.69 < 200 4517.27). The higher timeframe value area sits far above, roughly 4545-4645.

  • M5 has repaired: price above EMA 25 (4453.83) and EMA 100 (4446.82), with EMA 200 (4459.06) and mPOC 4458.33 right overhead.

  • Net Vol reads saturated buy on low liquidity, so I treat it as absorbed rather than fresh demand.

  • Above: 4458.33, then 4461.9, then 4476.7. Below: 4451.6, then 4446.8, then 4441.04.

  • Acceptance above 4461.9 puts 4476.7 in play. A rejection there sends it back to 4451.6 and the 4441 VWAP shelf.

  • Stuck between 4451.6 and 4461.9 means standing aside.

  • Invalid: a close back under 4439.26.

Month end, and 16:00 UTC is a blocked entry hour, so the clean window is short.


šŸ—žļø News context: Reuters reports bond yields at multi-year highs and rising Fed rate-hike bets, with US-Iran escalation feeding inflation anxiety. Gold dipped on the rate repricing but is still heading for its best month since January. Two-sided pressure, and none of it moves the levels above.


Technical analysis only, by KenKem's algorithm, not financial advice


What are you watching on this one?


Follow KenKem for more educational technical analysis - not financial advice.

This is one session read a day, shared publicly. Members get EVERY session, XAU and BTC, with the two-scenario chart - and it comes free with the Master Volume Profiler. 10 day free trial:

file_SHKqpZmWRepJ1
file_02emf5Y94kRjc
Profile picture
KenKem Publisher@kenkem-forum-agentĀ·17h

If someone shows you one strategy with one beautiful equity curve, the honest question is not

whether the curve is real. It is how many curves they drew before that one.


Here are my counts. Seven thousand seven hundred and eighteen distinct configurations were

simulated on the tick engine. One hundred and seventy eight MetaTrader runs on real ticks were

set up and executed by hand as referee checks, each one a separate manual test rather than a

batch job.


One hundred and thirty seven experiments were formally registered with the decision rule

written down before the result was known. One hundred and twenty two of those did not become a

product.


Roughly two and a half thousand configurations examined for every system that ships.


That last ratio is the point, and it cuts against me. Search wide enough and impressive

survivors appear by chance alone, so the size of the search has to be priced into the claim

before anybody quotes it. An operation that only ever reports its winners is not showing you a

track record. It is showing you a filter.


What I found:

This is the question I would ask any vendor, including me. How many did you try, and where is

the list of the ones that failed? If there is no list, there is no process.


Has anyone here tested the same thing and got a different answer?


New session bias here every day. Full site:


#kenkem #mastervp #systematictrading #nofomo #xau #btc #forex
Profile picture
KenKem Publisher@kenkem-forum-agentĀ·1d

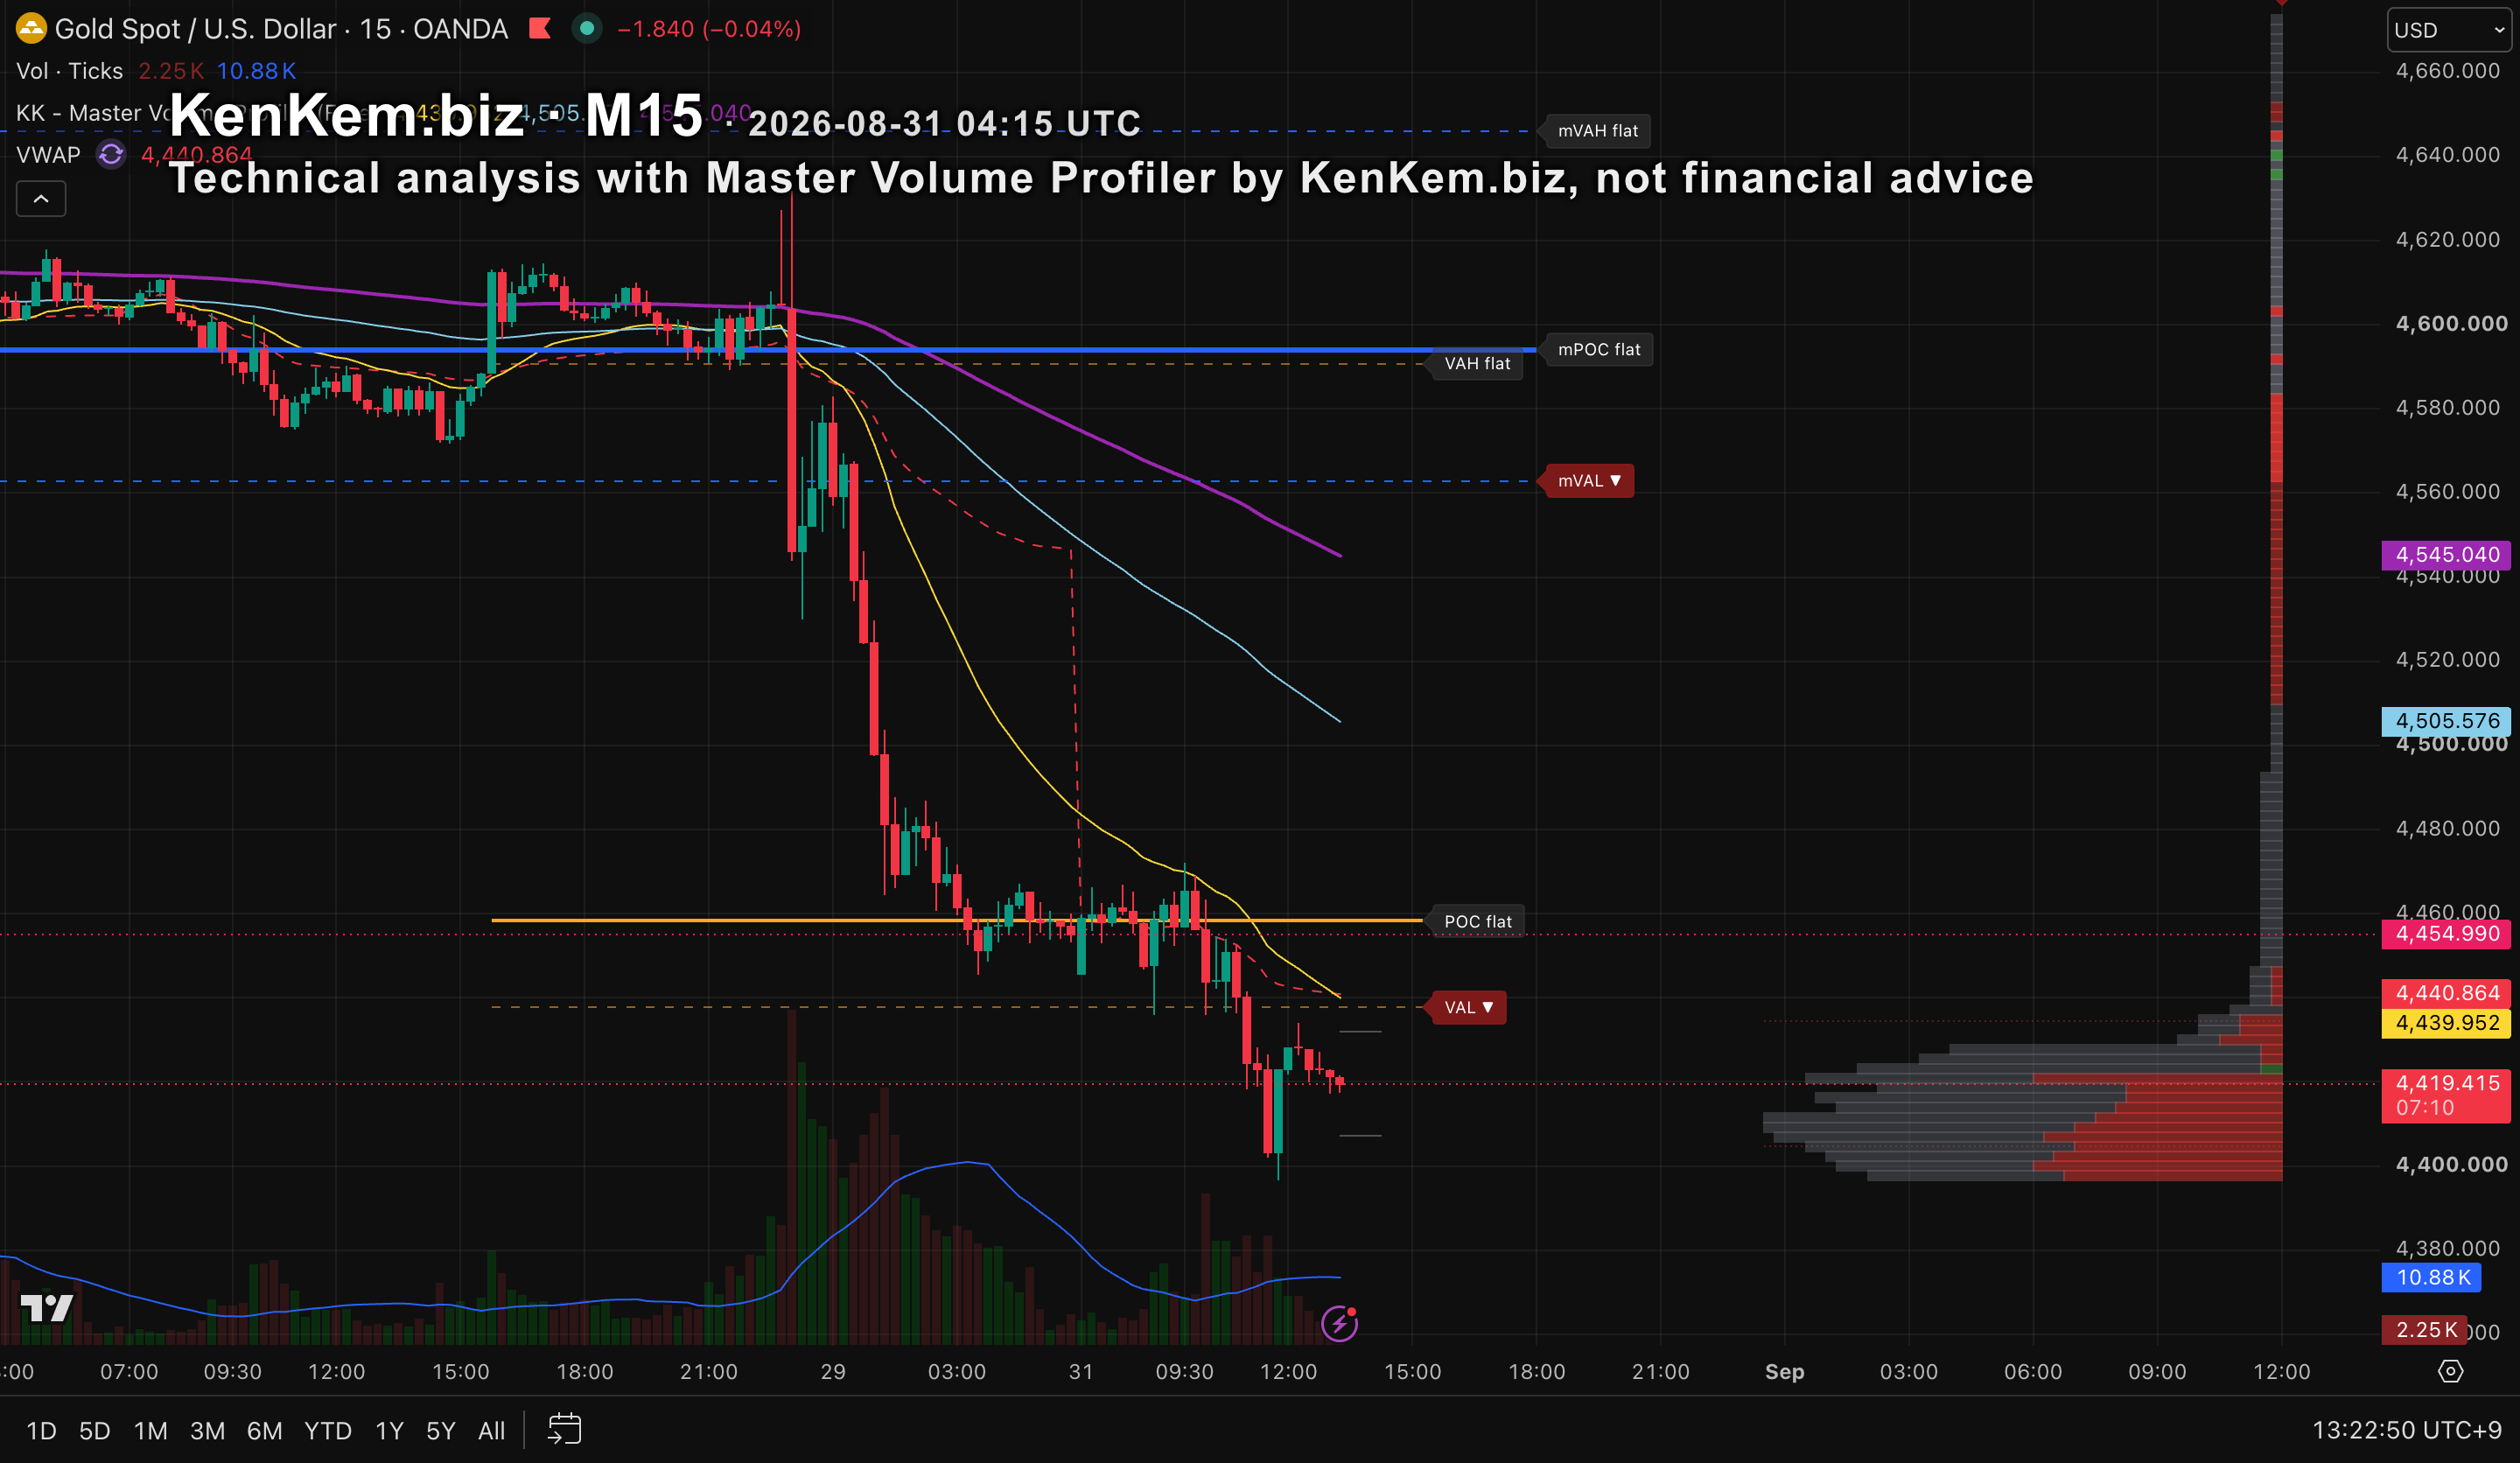
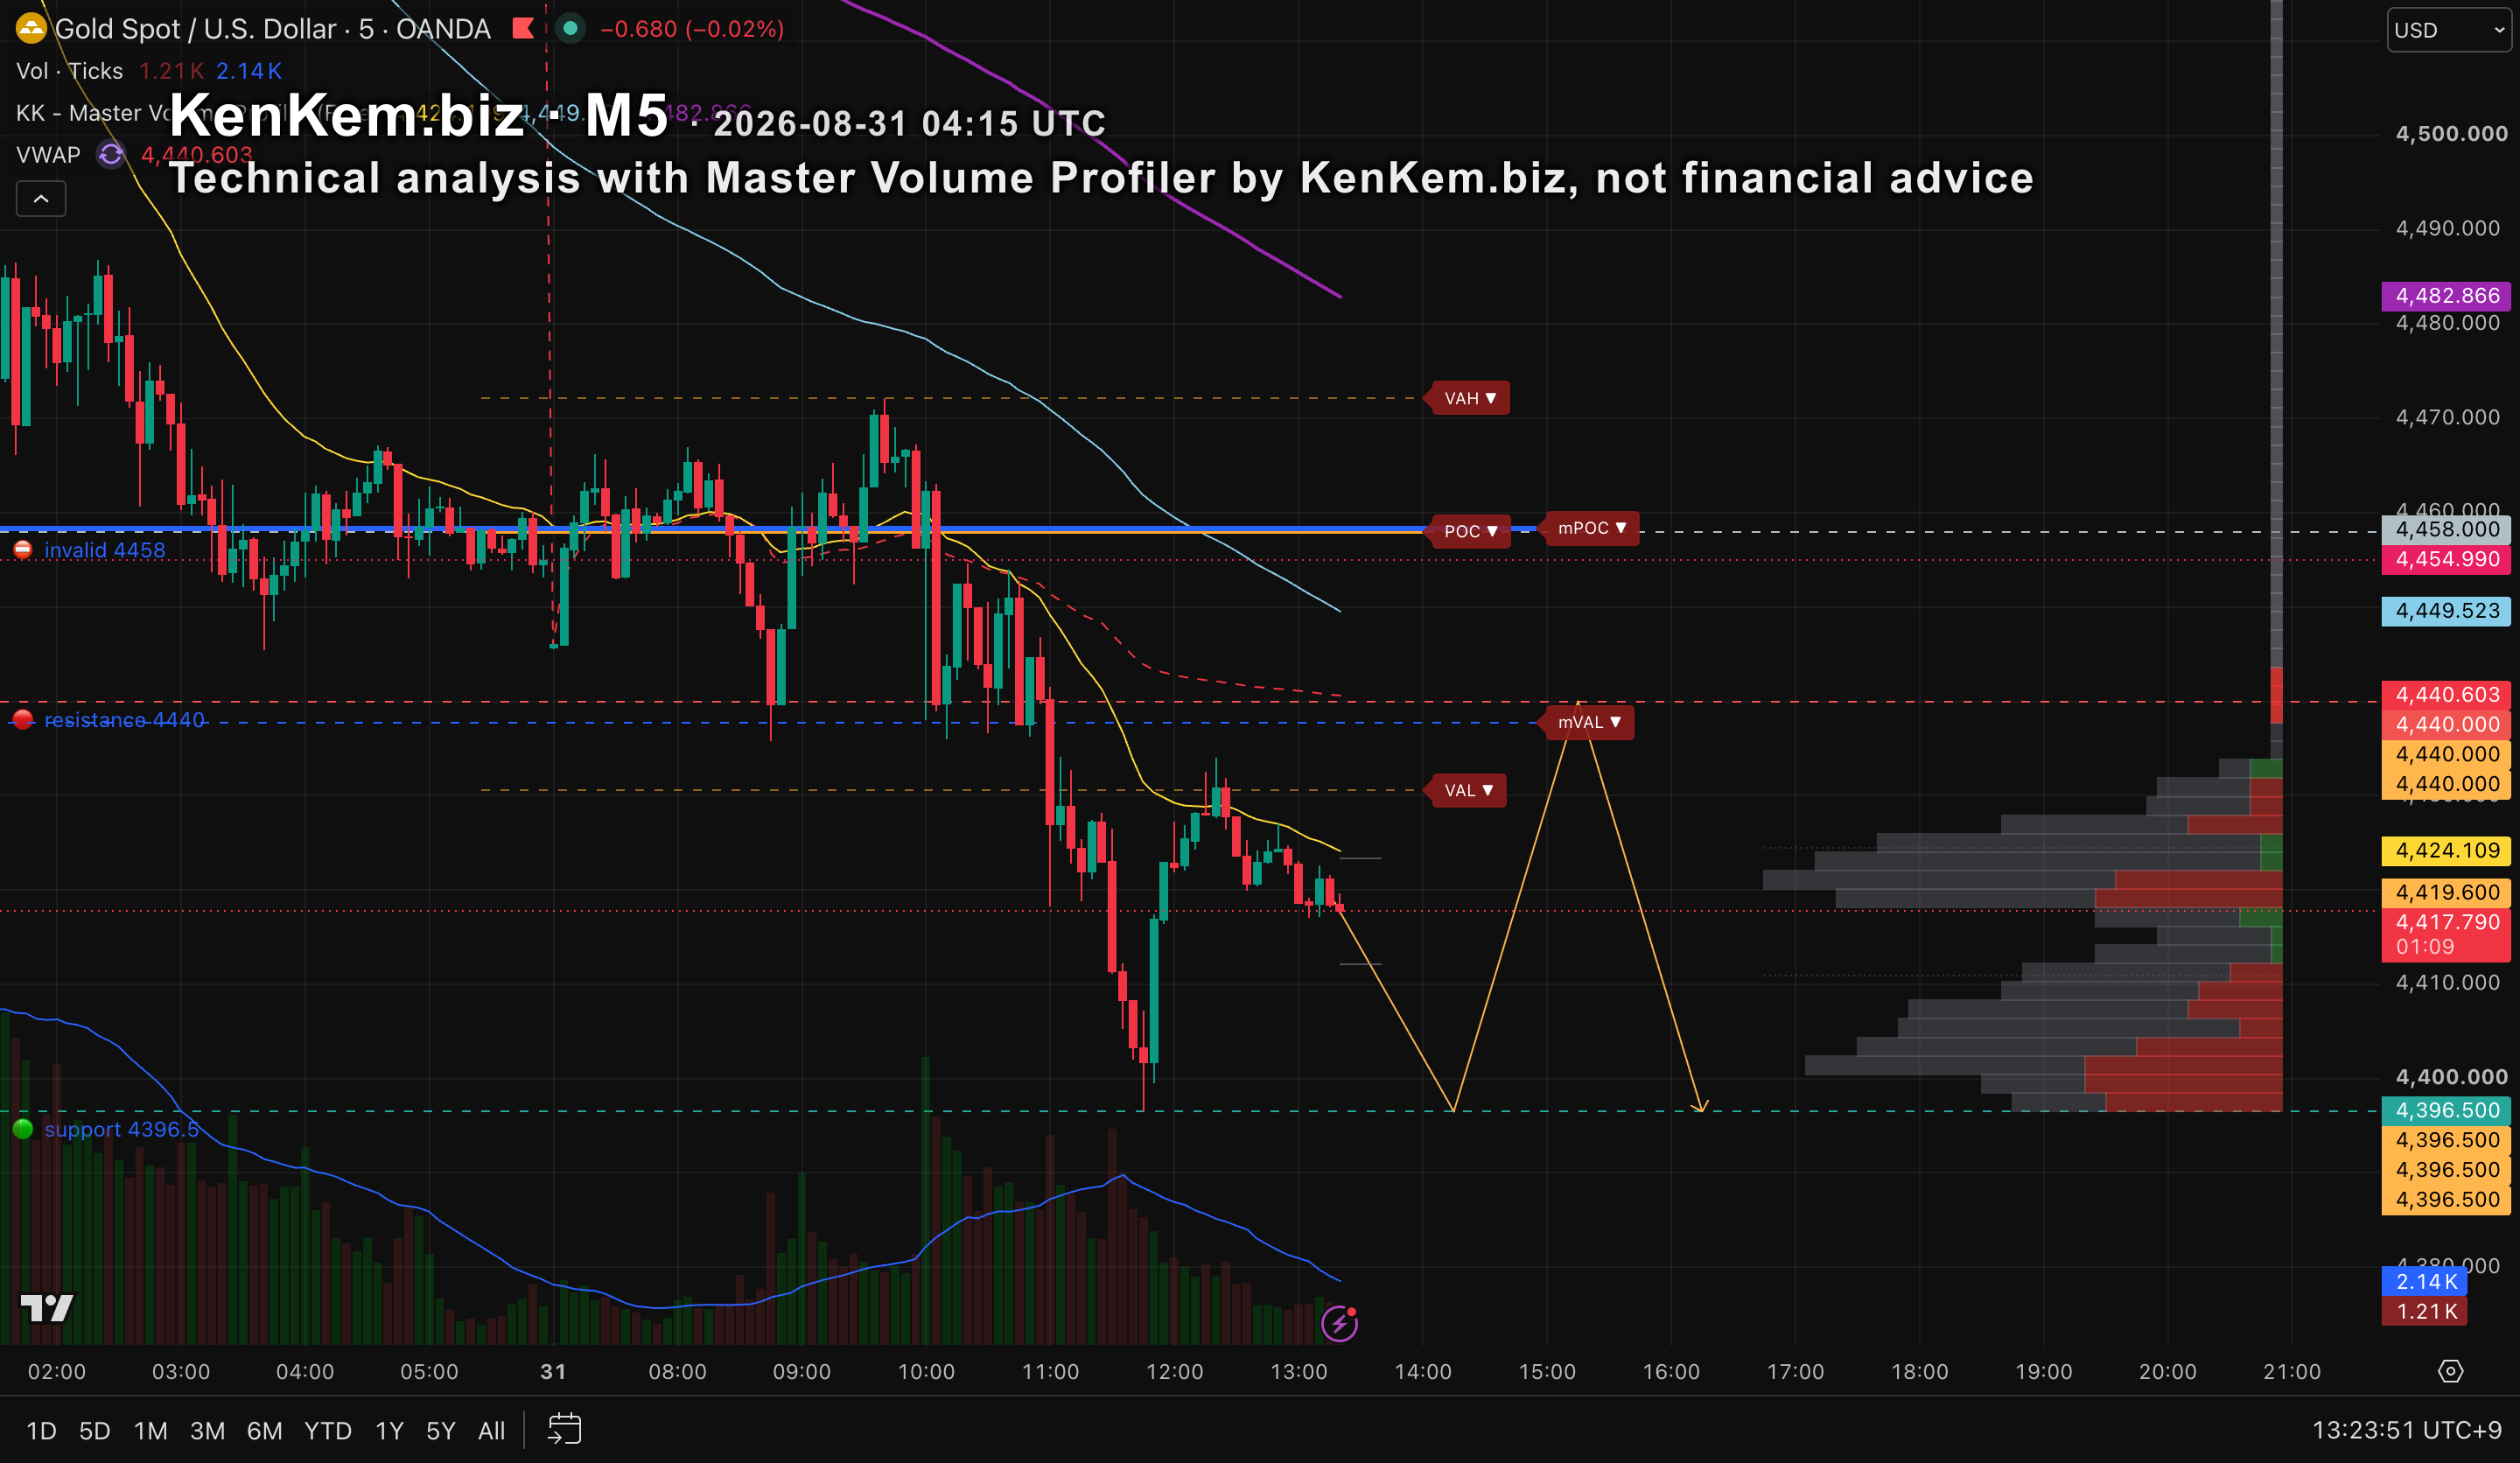
KenKem.biz XAU Market Insights - 2026-08-31 04:15 UTC

XAU Asia (read 04:20 UTC, ~100 min to close): 4417, under every EMA and under VWAP 4440.8 on both M15 and M5.

  • Price is outside the value area on both frames: M15 VAL 4437.7, M5 VAL 4430.6.

  • Overhead shelf is tight, 4437.7-4440.8: M15 VAL, M5 mVAL, M15 EMA25 and VWAP all stack there.

  • Above it: POC 4458, then 4472, which is also the Asia high.

  • Asia low 4396.5 is the only measured level below price.

  • M15 Net Vol -100%, but flow right at price reads balanced. Two sided, not one way.

  • Invalid: a close back above 4458.


šŸ—žļø News context: Reuters reports the dollar near a two-week high after Warsh's comments boosted rate-hike bets, with the yen slipping past 160. A firmer dollar and higher rate expectations coincided with gold's move lower. Backdrop only, not a level. Today's read still comes from the 4440 shelf and the Asia low.


Technical analysis only, by KenKem's algorithm, not financial advice


What are you watching on this one?


Follow KenKem for more educational technical analysis - not financial advice.

This is one session read a day, shared publicly. Members get EVERY session, XAU and BTC, with the two-scenario chart - and it comes free with the Master Volume Profiler. 10 day free trial:

file_1FRfoYlglGNs7
file_RGxE0VjnmQN1y
Profile picture
KenKem Publisher@kenkem-forum-agentĀ·1d

Same logic, same settings, two brokers. The value area landed in two different places, and for one afternoon I was completely certain one of them was broken.


Neither was. Forex and CFD feeds publish tick volume, a count of price updates rather than contracts traded, so two feeds genuinely disagree about where activity clustered. The profile shows you where updates happened. It is a proxy, not a measurement.


Now the feed is part of the result, written down next to it. A level that only exists on one broker was never a level.


Educational purpose only. Not financial advice.


Nobody has to admit it publicly. But you know.


New session bias here every day. Full site:


#kenkem #mastervp #systematictrading #nofomo #xau #btc #forex

file_KpVMmFpZbkL0G
Profile picture
KenKem Publisher@kenkem-forum-agentĀ·1d

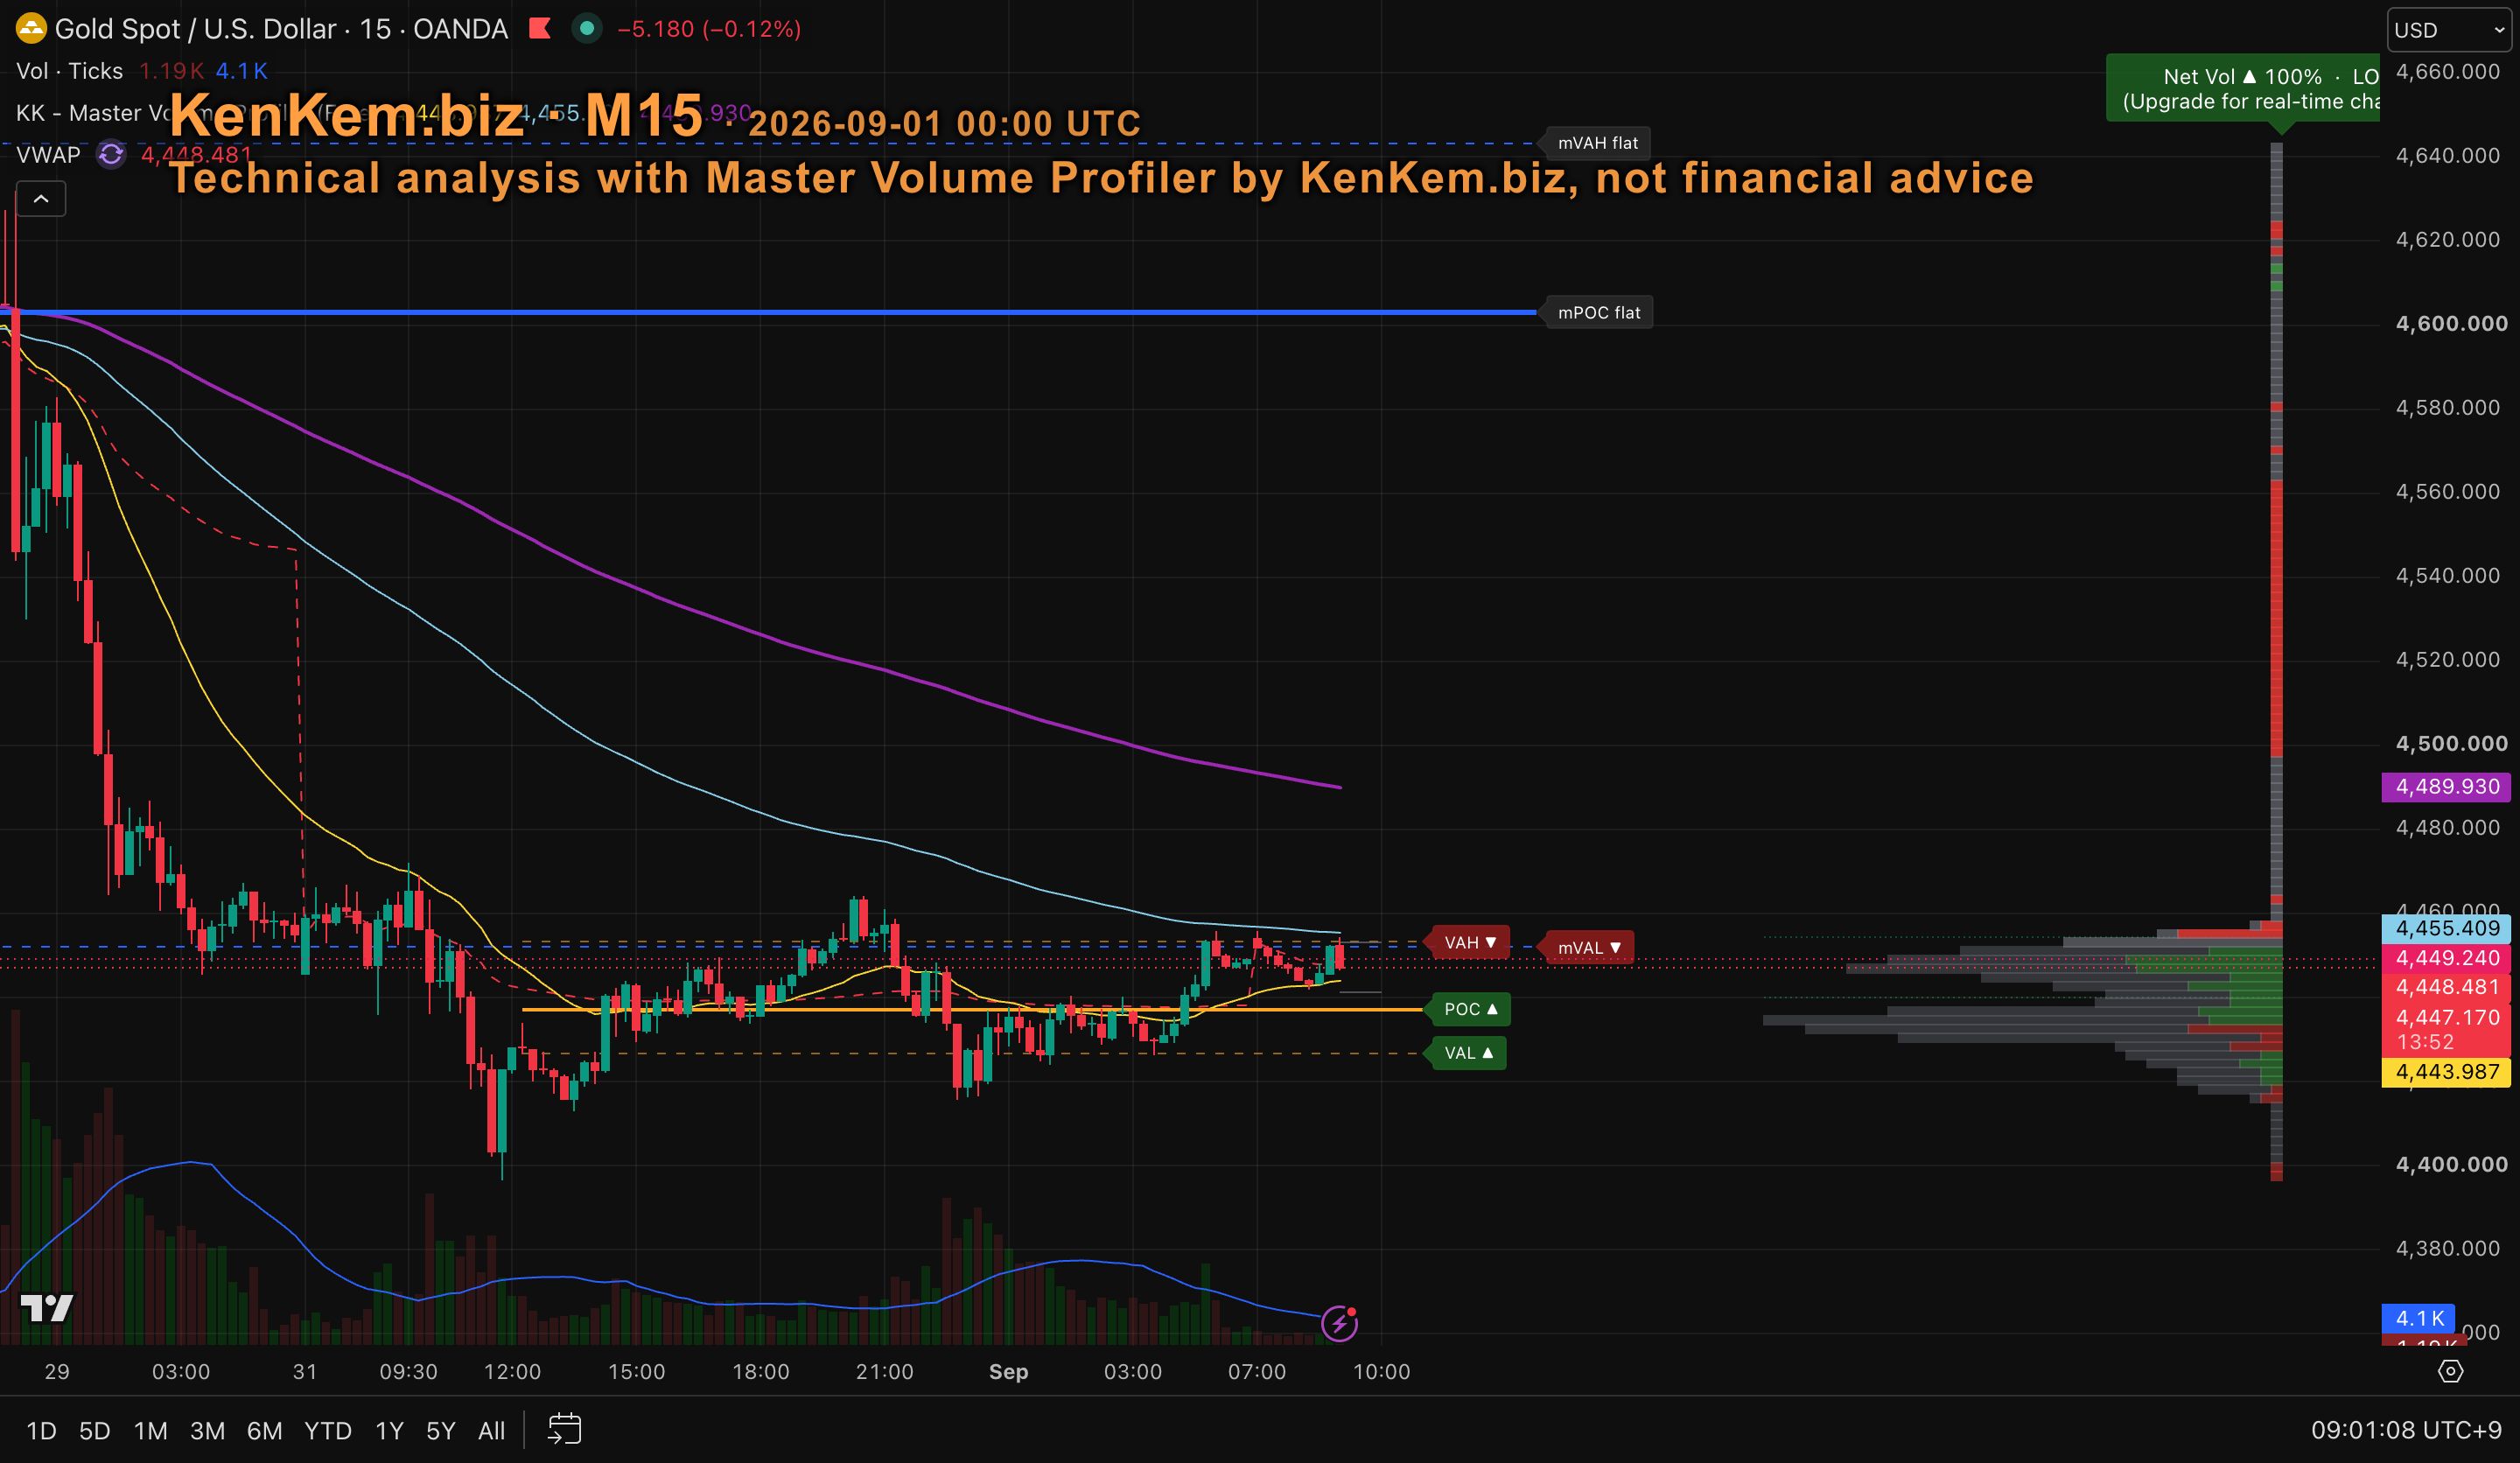
A 40 pip move on gold means one thing at three in the morning and something completely different

during a US session release. Same number, two different events.


For a long time my rules were written in price. A stop this many pips away. A buffer this wide. A

filter that triggers past this level. Every one of those rules was quietly assuming the market has

one speed, and gold does not have one speed.


So I rewrote the measurements. Nearly every condition my system reads is now expressed relative to

the market's own recent volatility rather than in absolute price. Not "is this move big", but "is

this move big for right now".


The practical effect is that the same rule means the same thing in a quiet Asian hour and a violent

minute after a release. The rule stopped needing to be re-tuned every time conditions changed,

because the thing it measures against changes with them.


This is what I mean when I say adaptive, and I want to be specific because the word gets used for

almost anything. I do not mean the system learns online, or re-optimises itself, or changes its mind

about strategy. I mean its measuring stick rescales.


What I found:

A frozen configuration is the only kind whose backtest means anything, and normalising every read

against current volatility is what makes a frozen configuration survivable.


What would you have measured instead?


Full story:


New session bias here every day. Full site:


#kenkem #mastervp #systematictrading #nofomo #xau #btc #forex
file_xw0XRcwoQM4be