
KrabsLab Indicator Suite
Live odds on every level, right on your TradingView chart.
Every level on your chart has odds. Now you can see them.
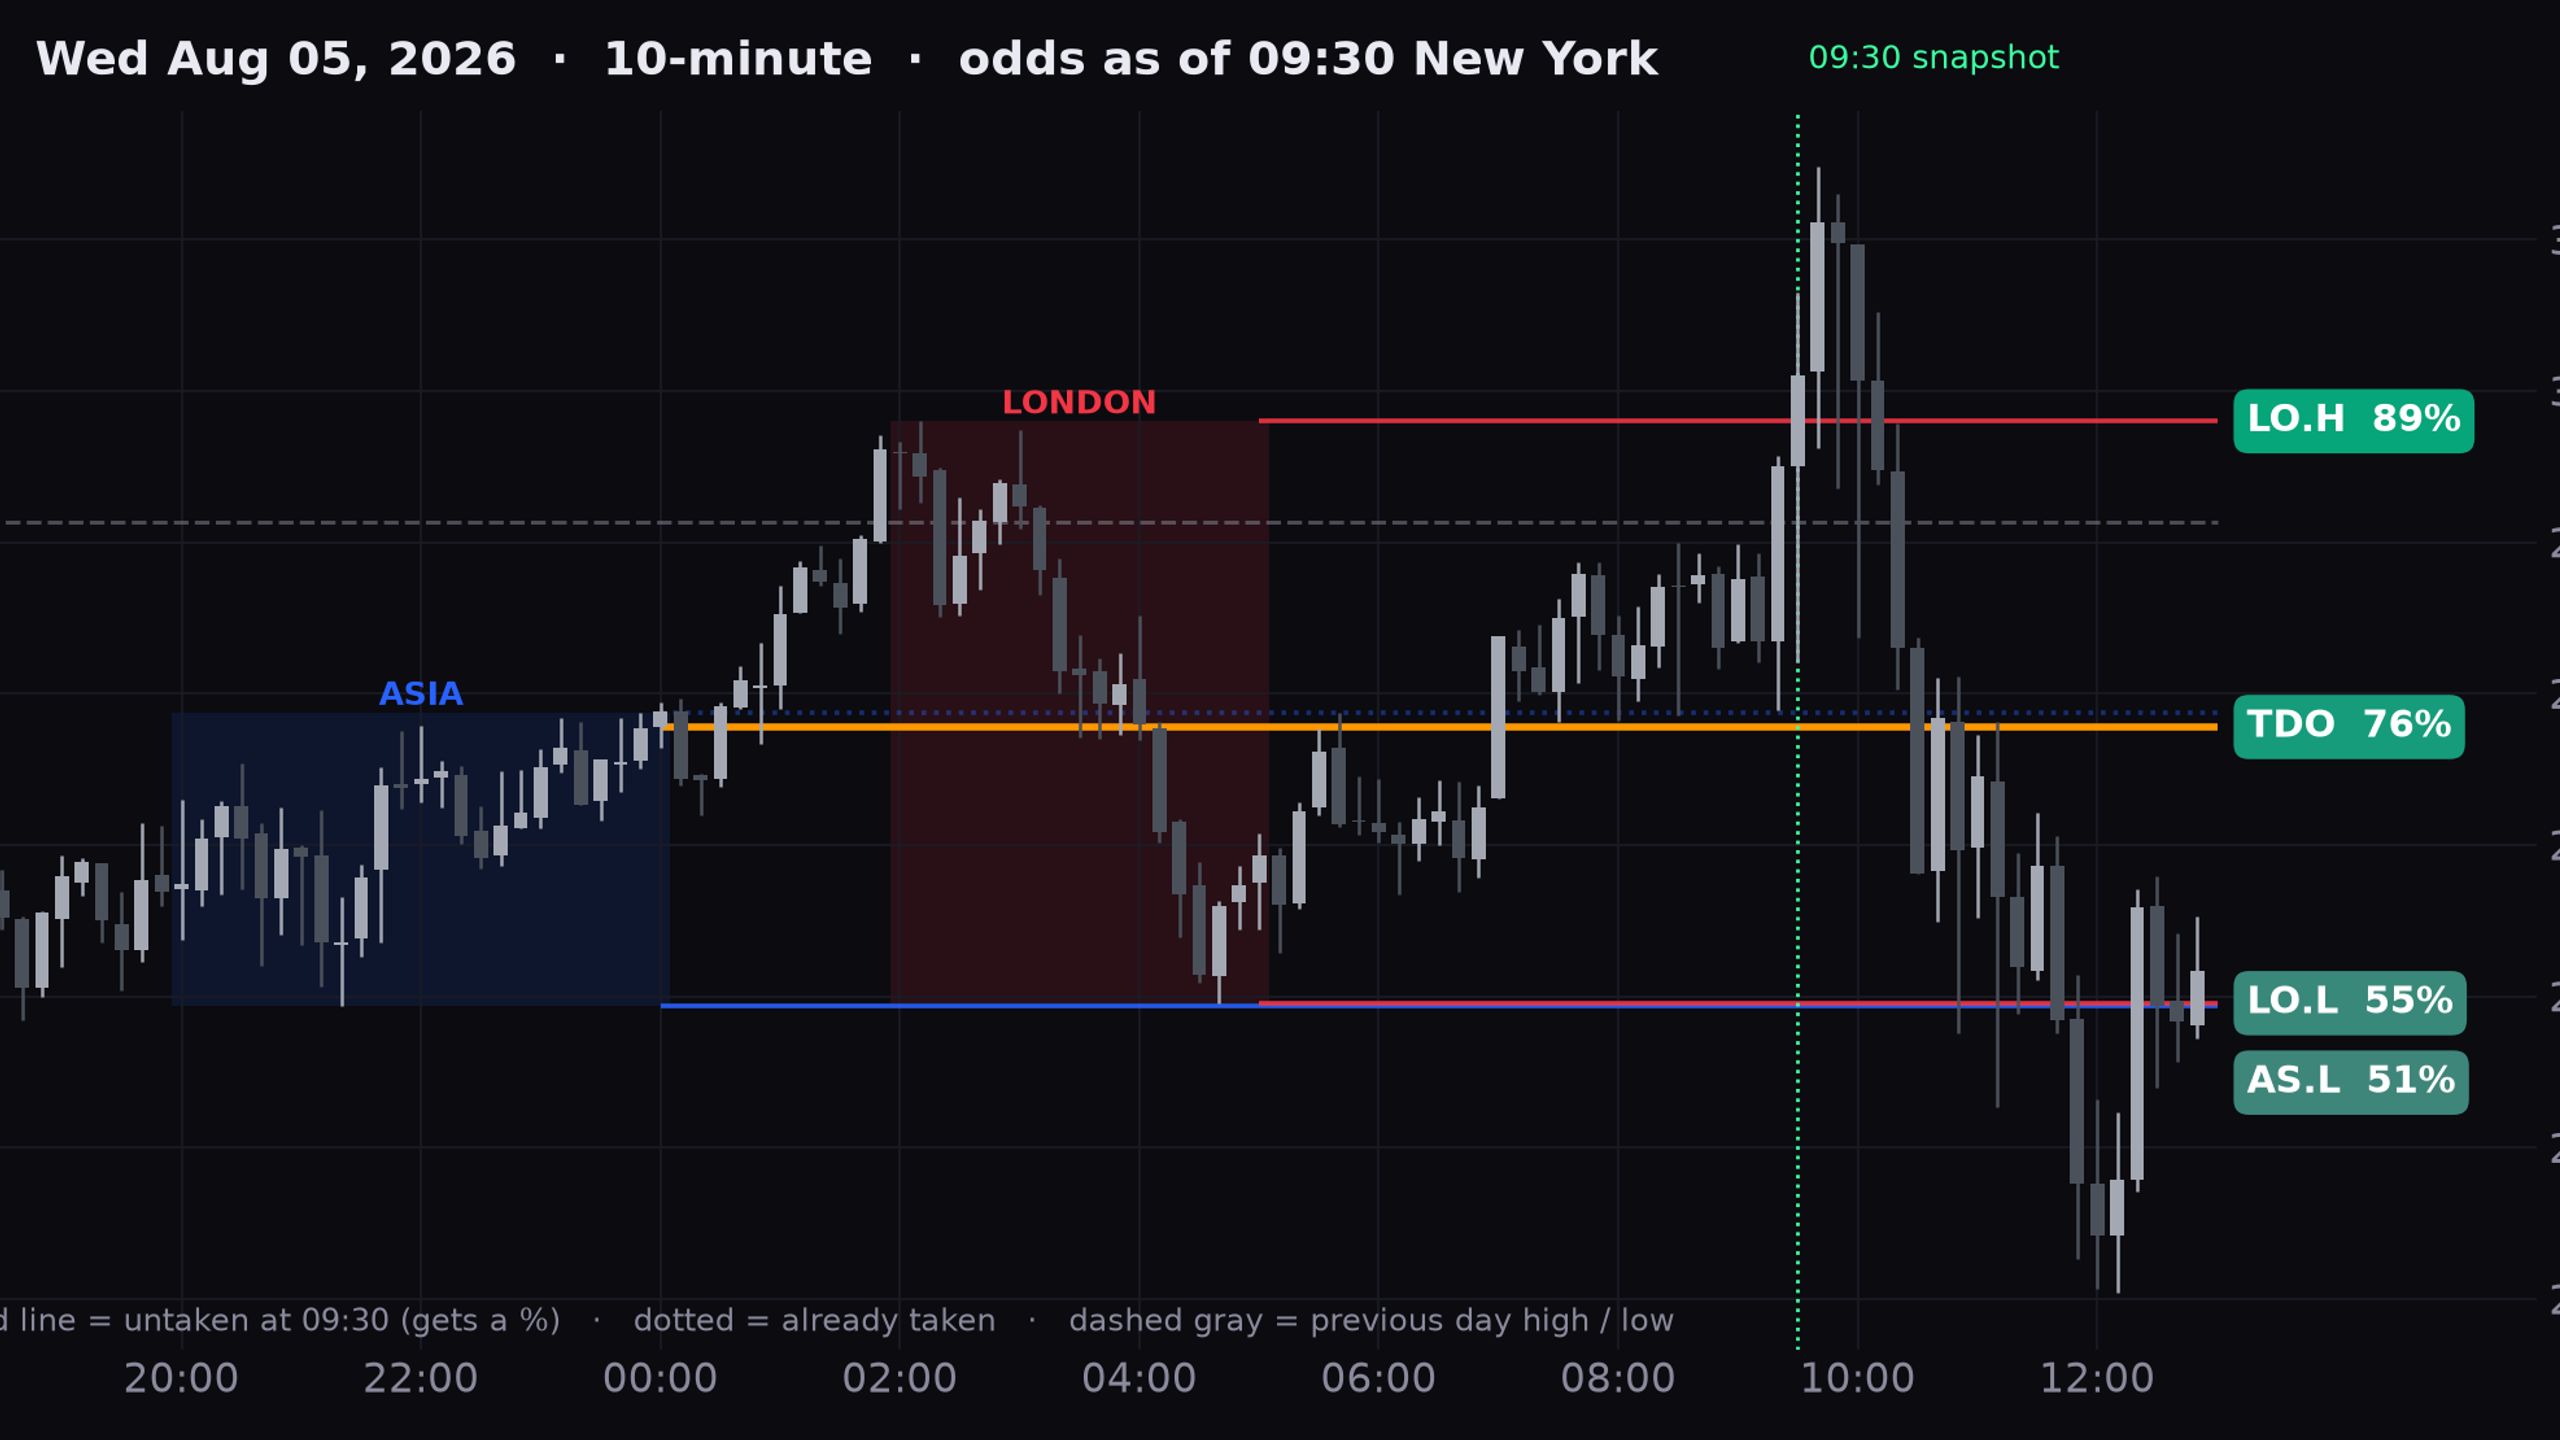
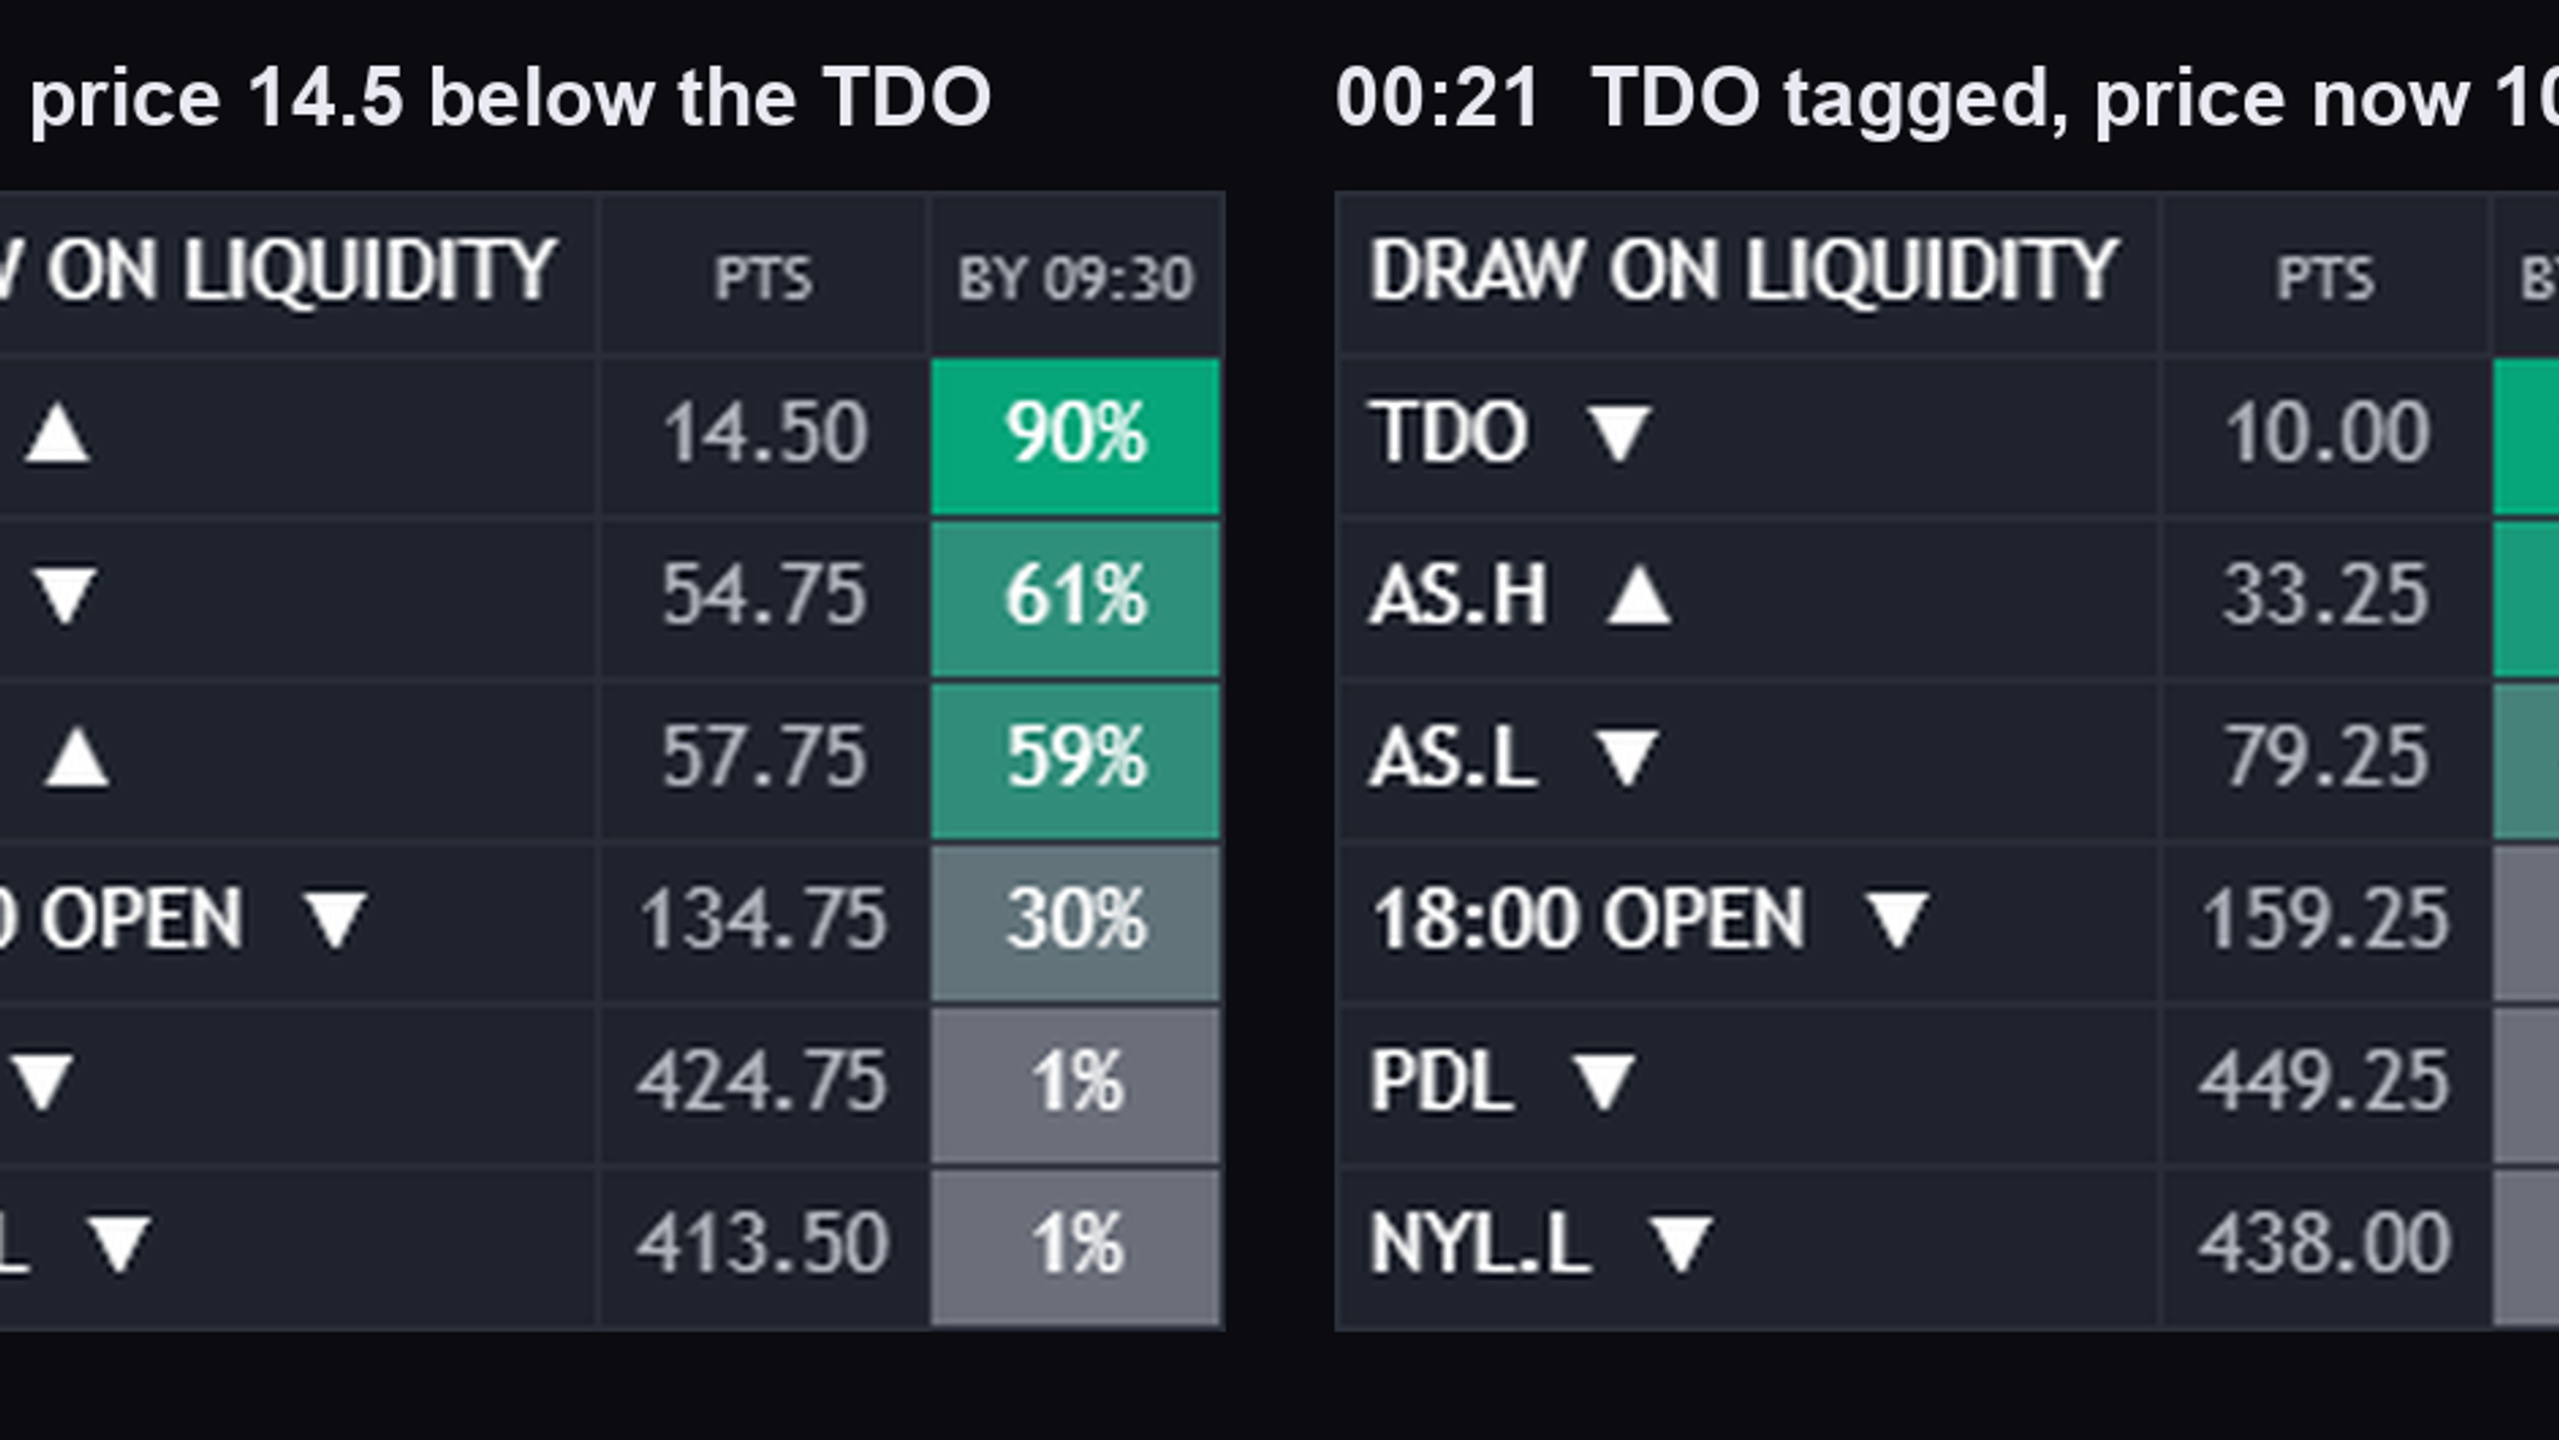
The KrabsLab Indicator Suite puts a live percentage on the session highs and lows you already trade: Asia, London, New York, the previous day and the True Day Open. It’s how often, historically, price took that level before the next session opened, adjusted for distance and time left.
Built on 11 years of one-minute CME NQ and ES data, tested on three years the model never saw.
WHAT YOU GET
- Killzones + live odds on every session high and low, with a 50% line
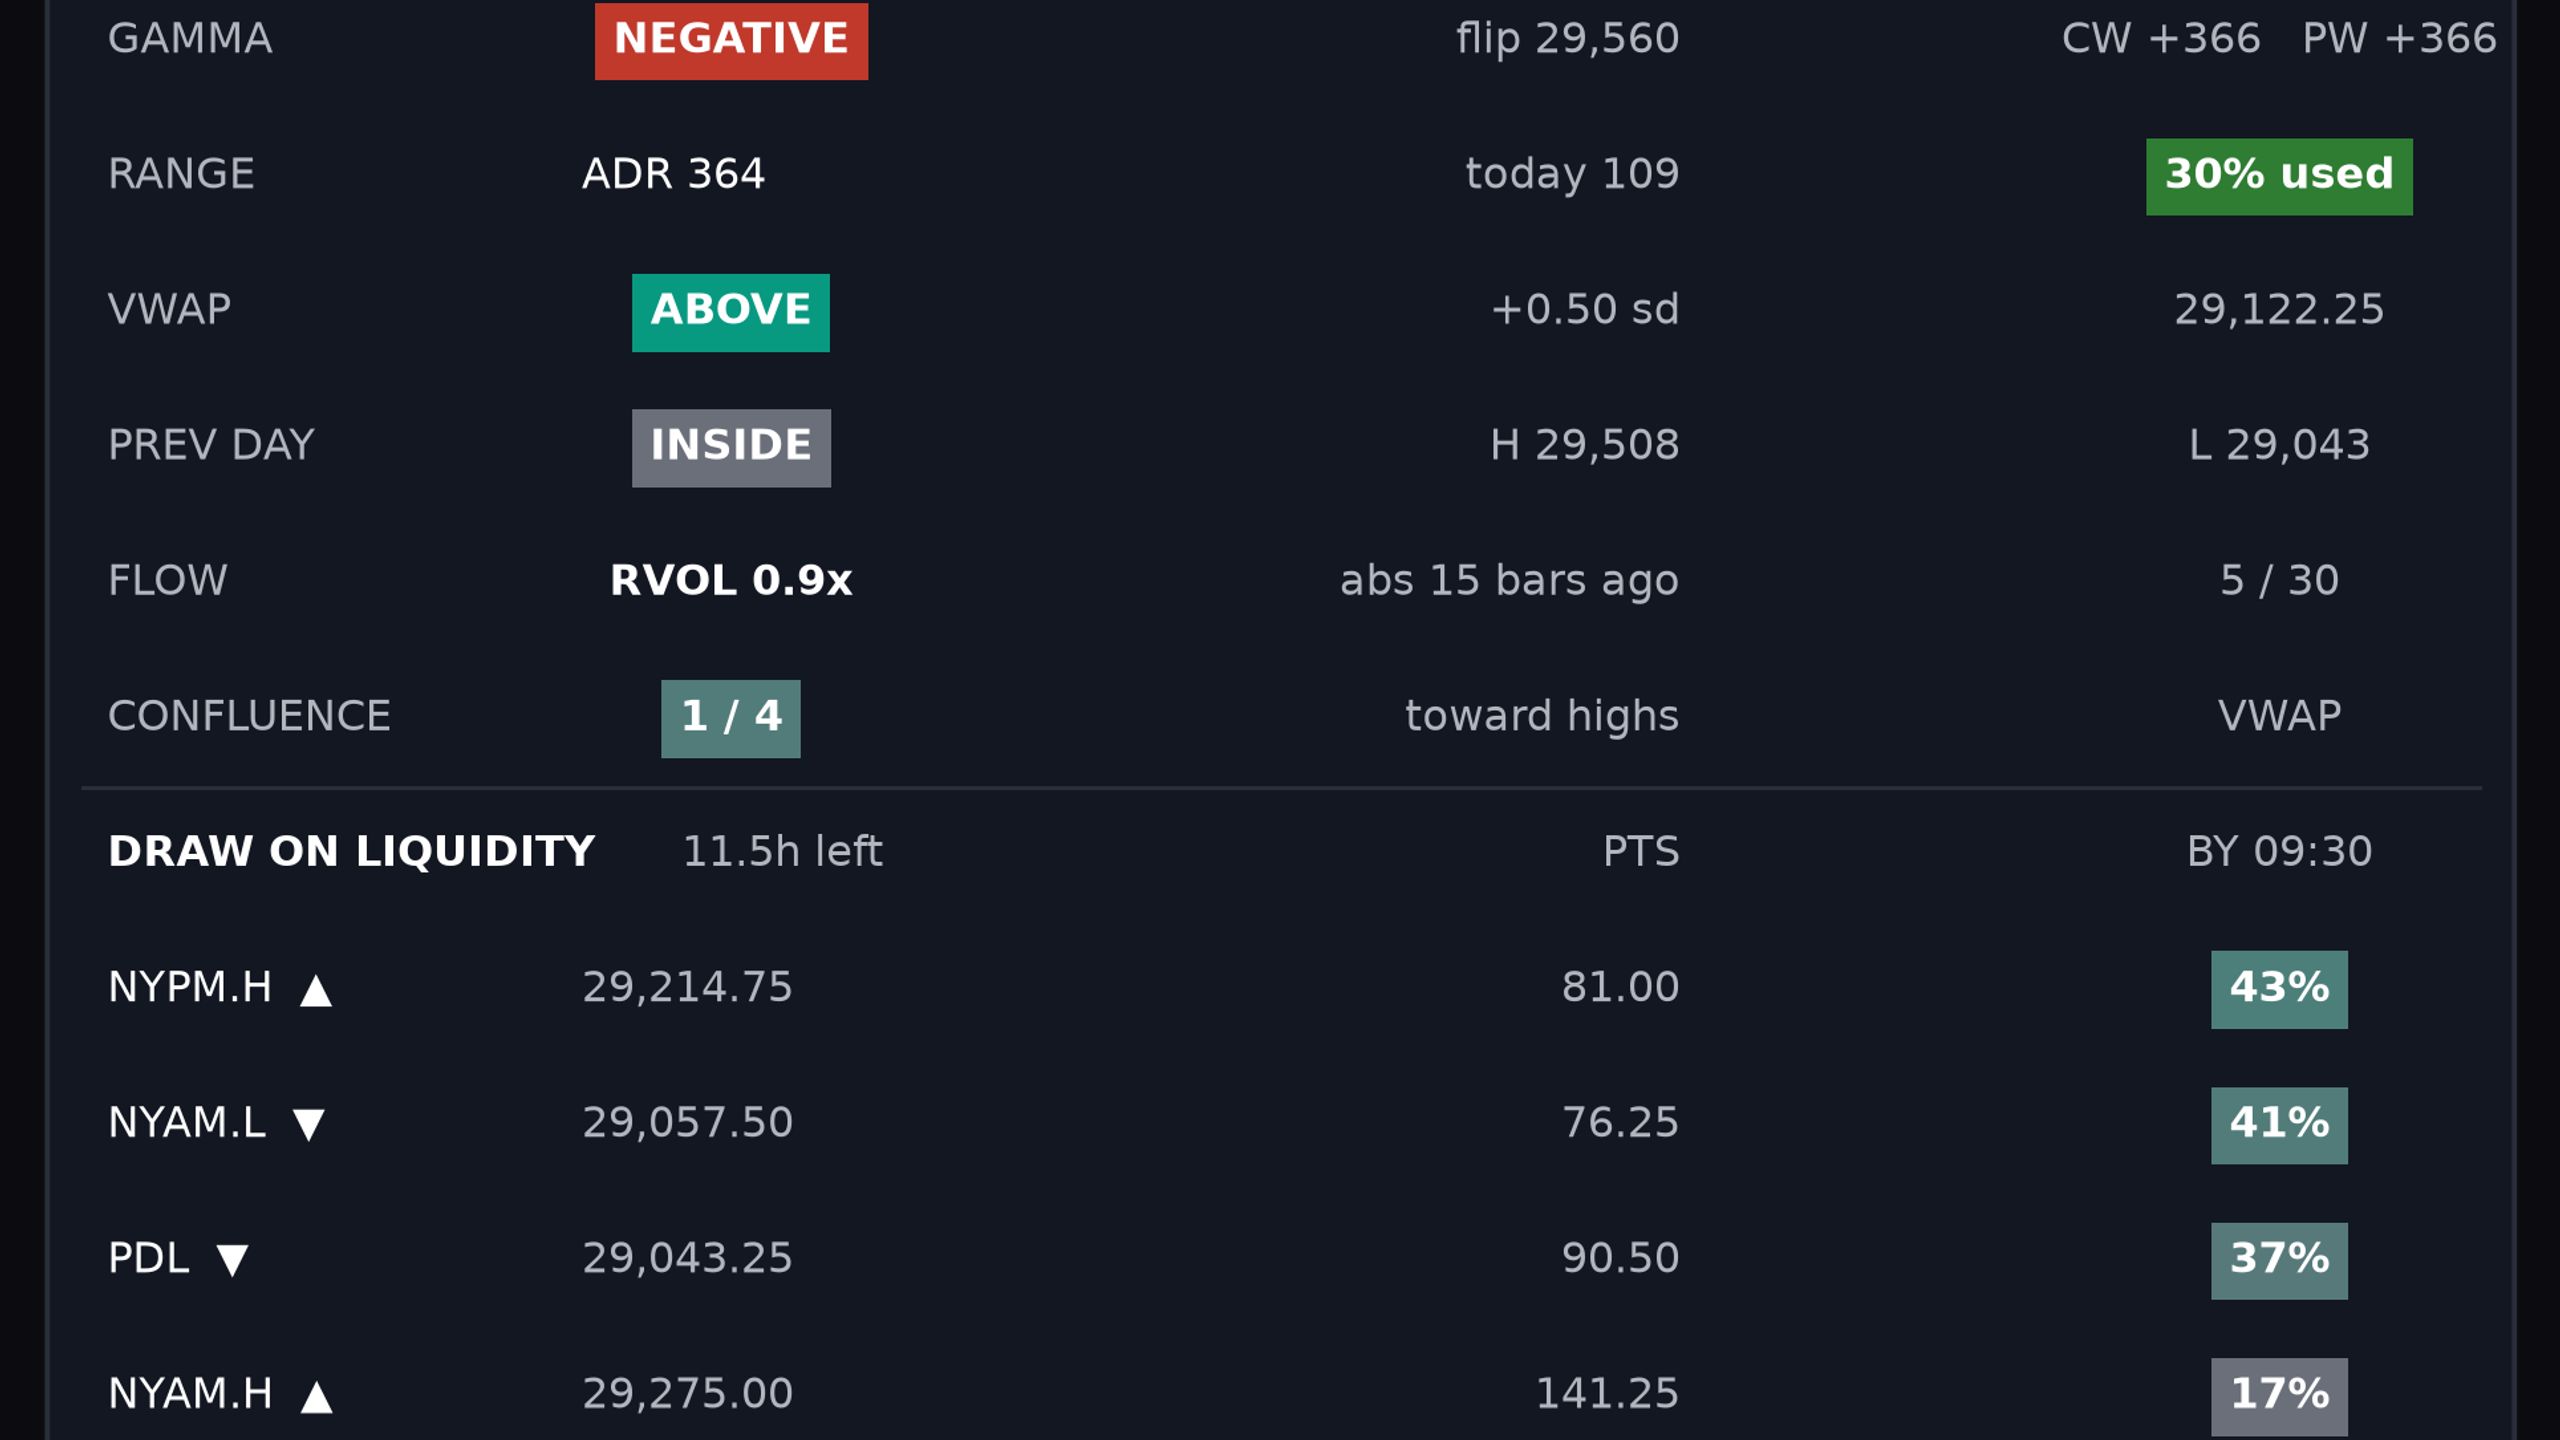
- Dashboard: bias, range, VWAP, delta and the next draw on liquidity
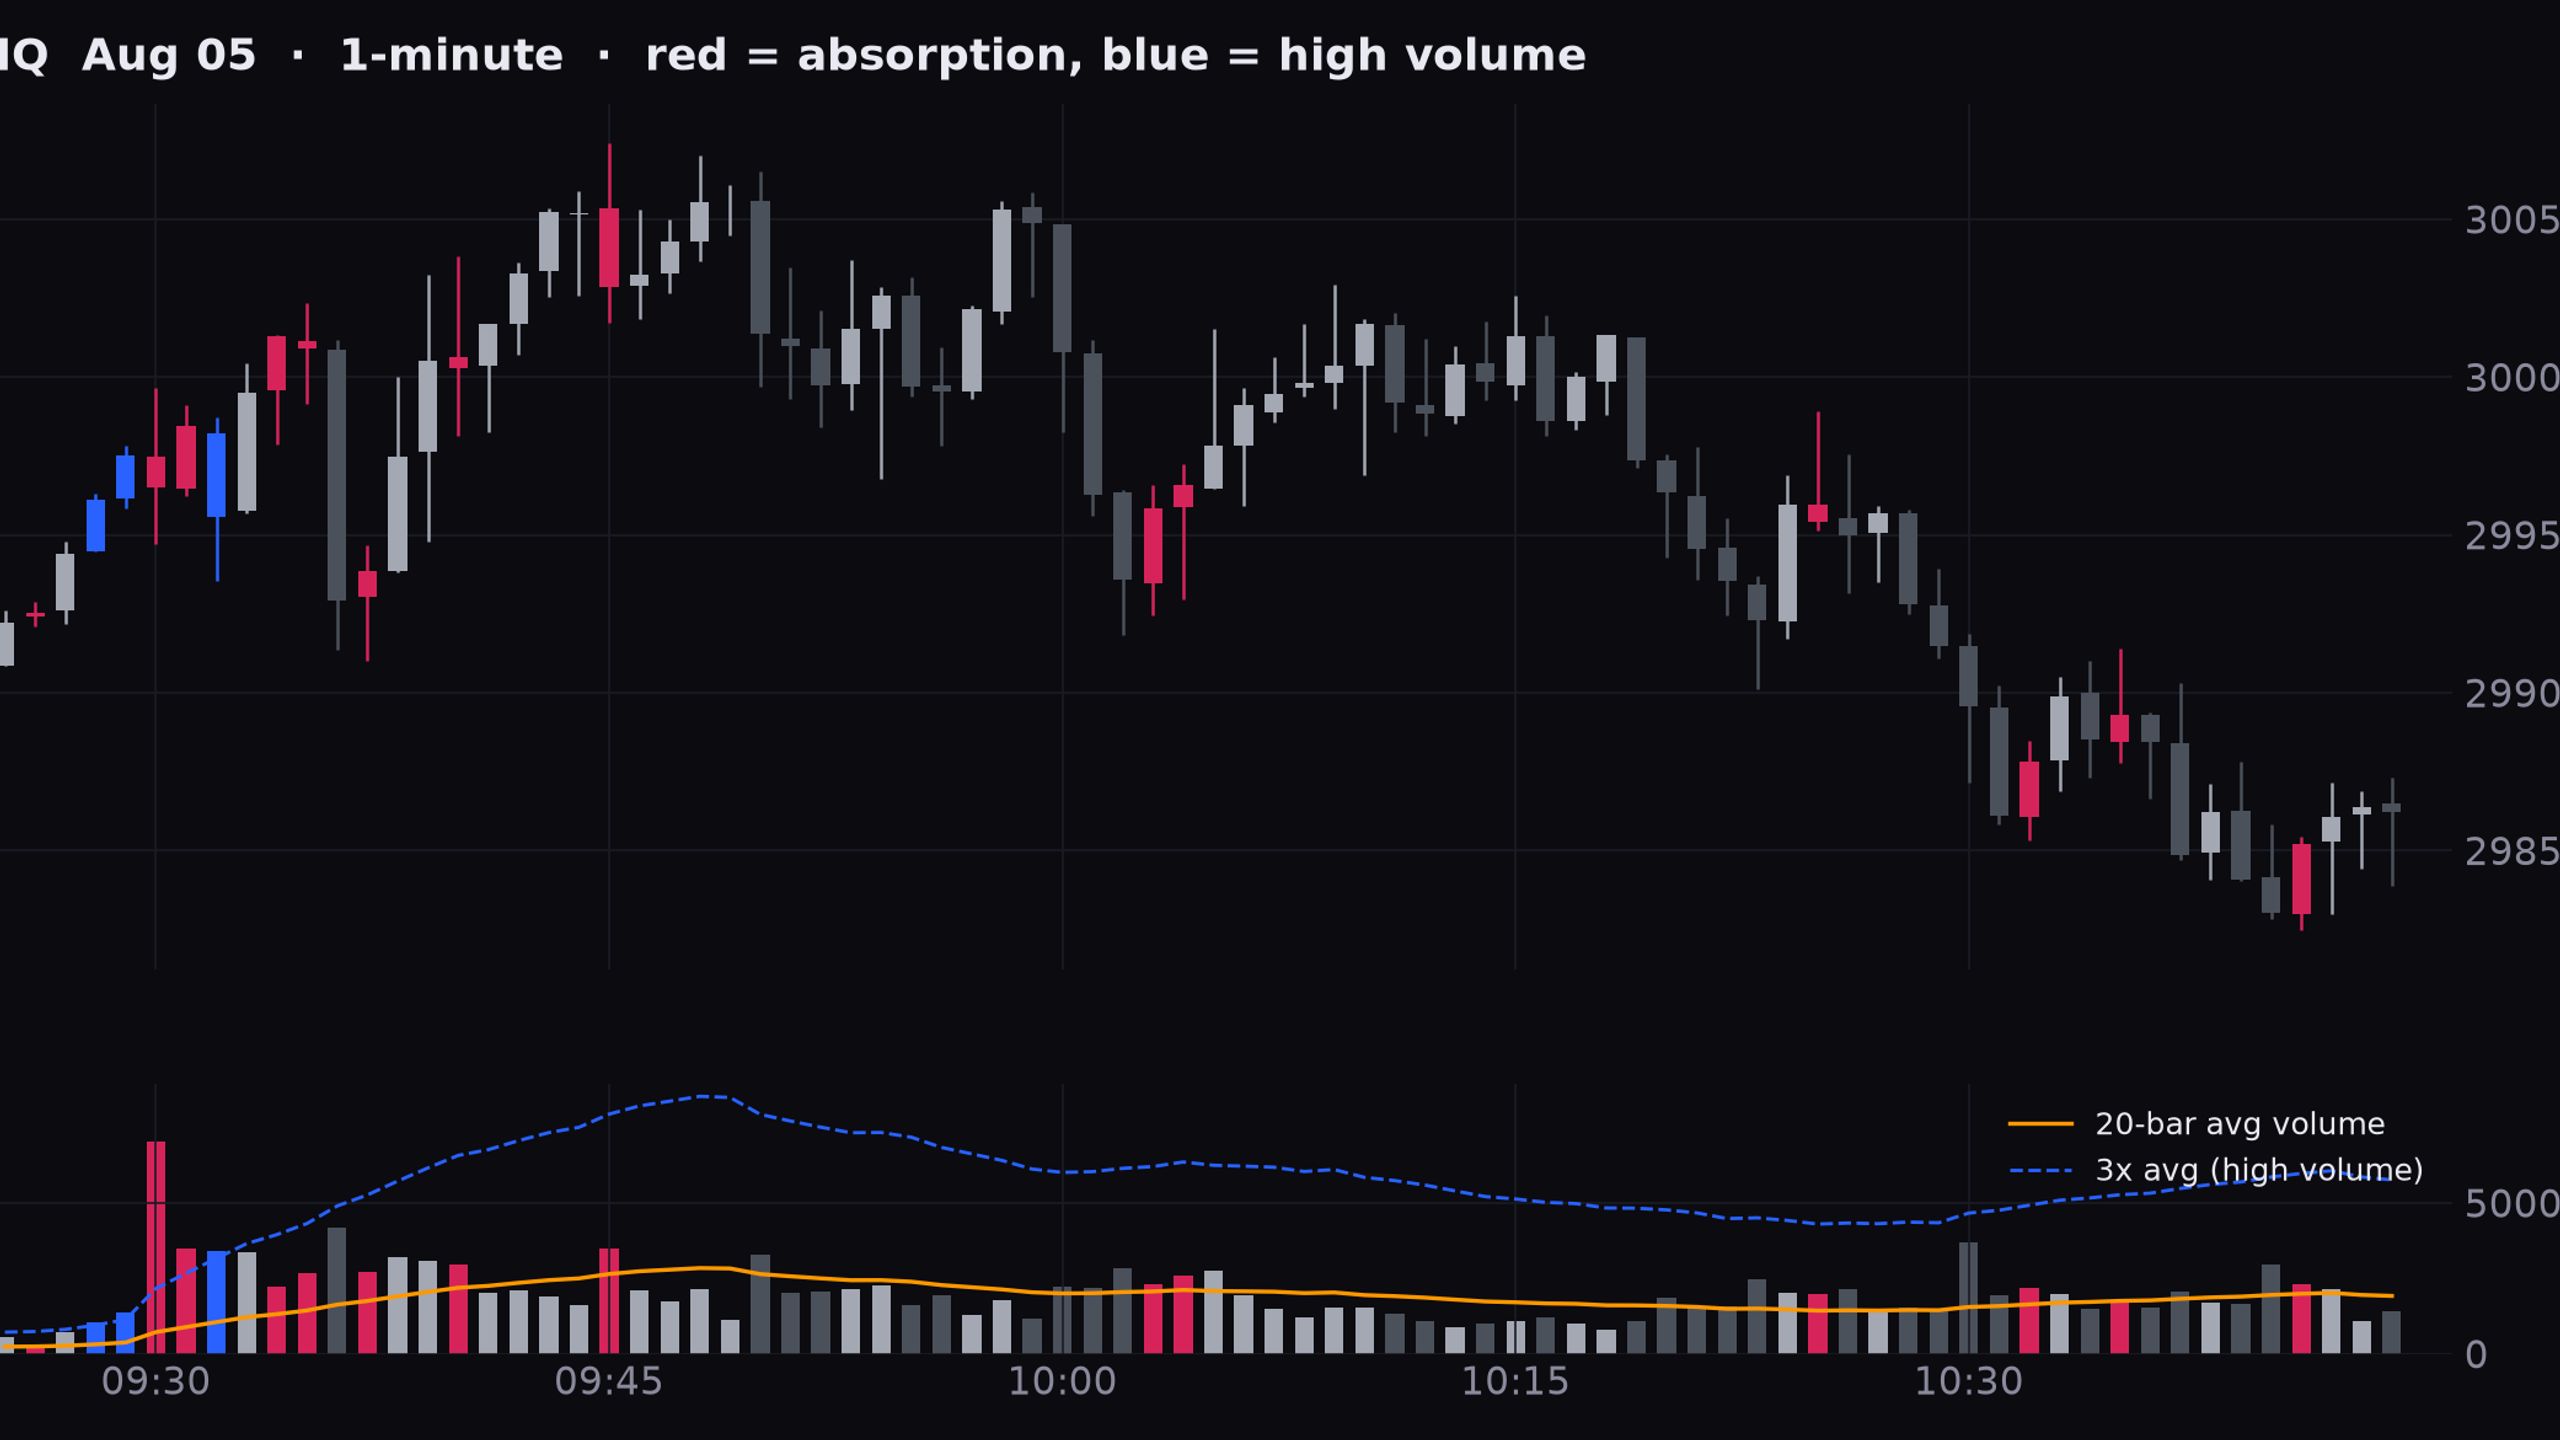
- Absorption: absorption and high-volume candles, nothing else
- Delta: cumulative delta with effort-vs-result divergences
- VWAP: daily, RTH and weekly VWAP with deviation bands
- Members-only channels in the KrabsLab Discord, setup videos and a full Asia-session walkthrough
HOW ACCESS WORKS
- Start your trial and enter your TradingView username at checkout.
- On the claim page, press Claim Indicators: access is instant.
- TradingView > Indicators > Invite-only scripts > add them to your chart.
- Join the KrabsLab Discord from Whop to unlock the members channels.
Monthly: 7-day free trial, then $139/month, or $97/month with code KRABS at checkout. Cancel anytime.
Educational tools only, not financial advice. Futures trading carries substantial risk of loss. Percentages are historical frequencies, not predictions. KrabsLab is not affiliated with TradingView.