
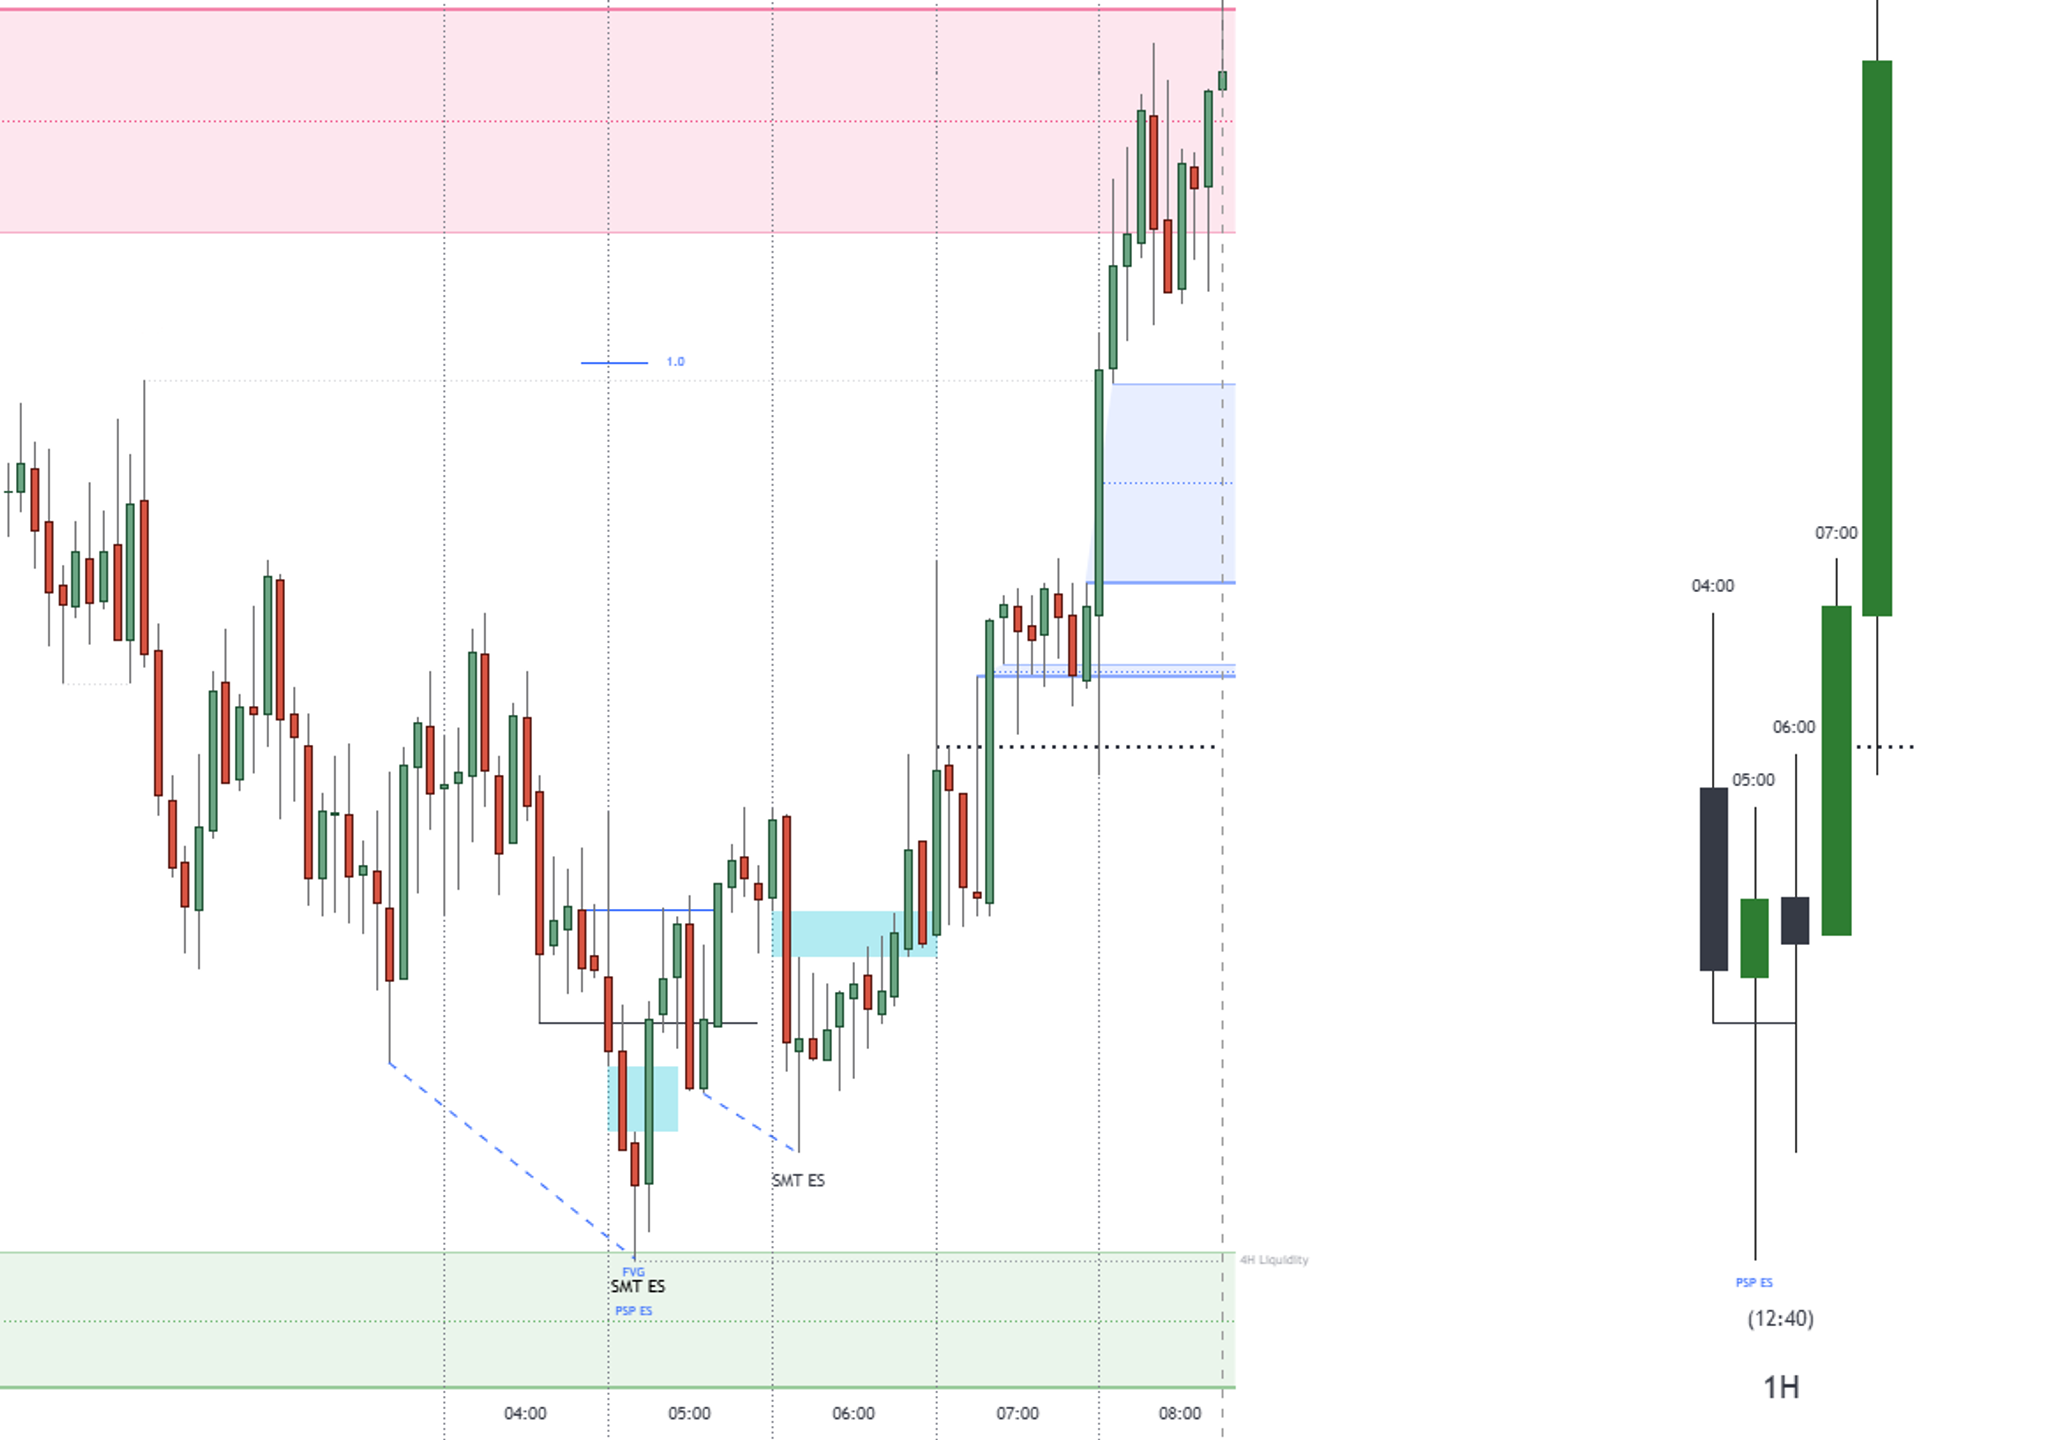
CRT Liquidity Framework
Candle ranges, sweeps, CISD and SMT on one chart.
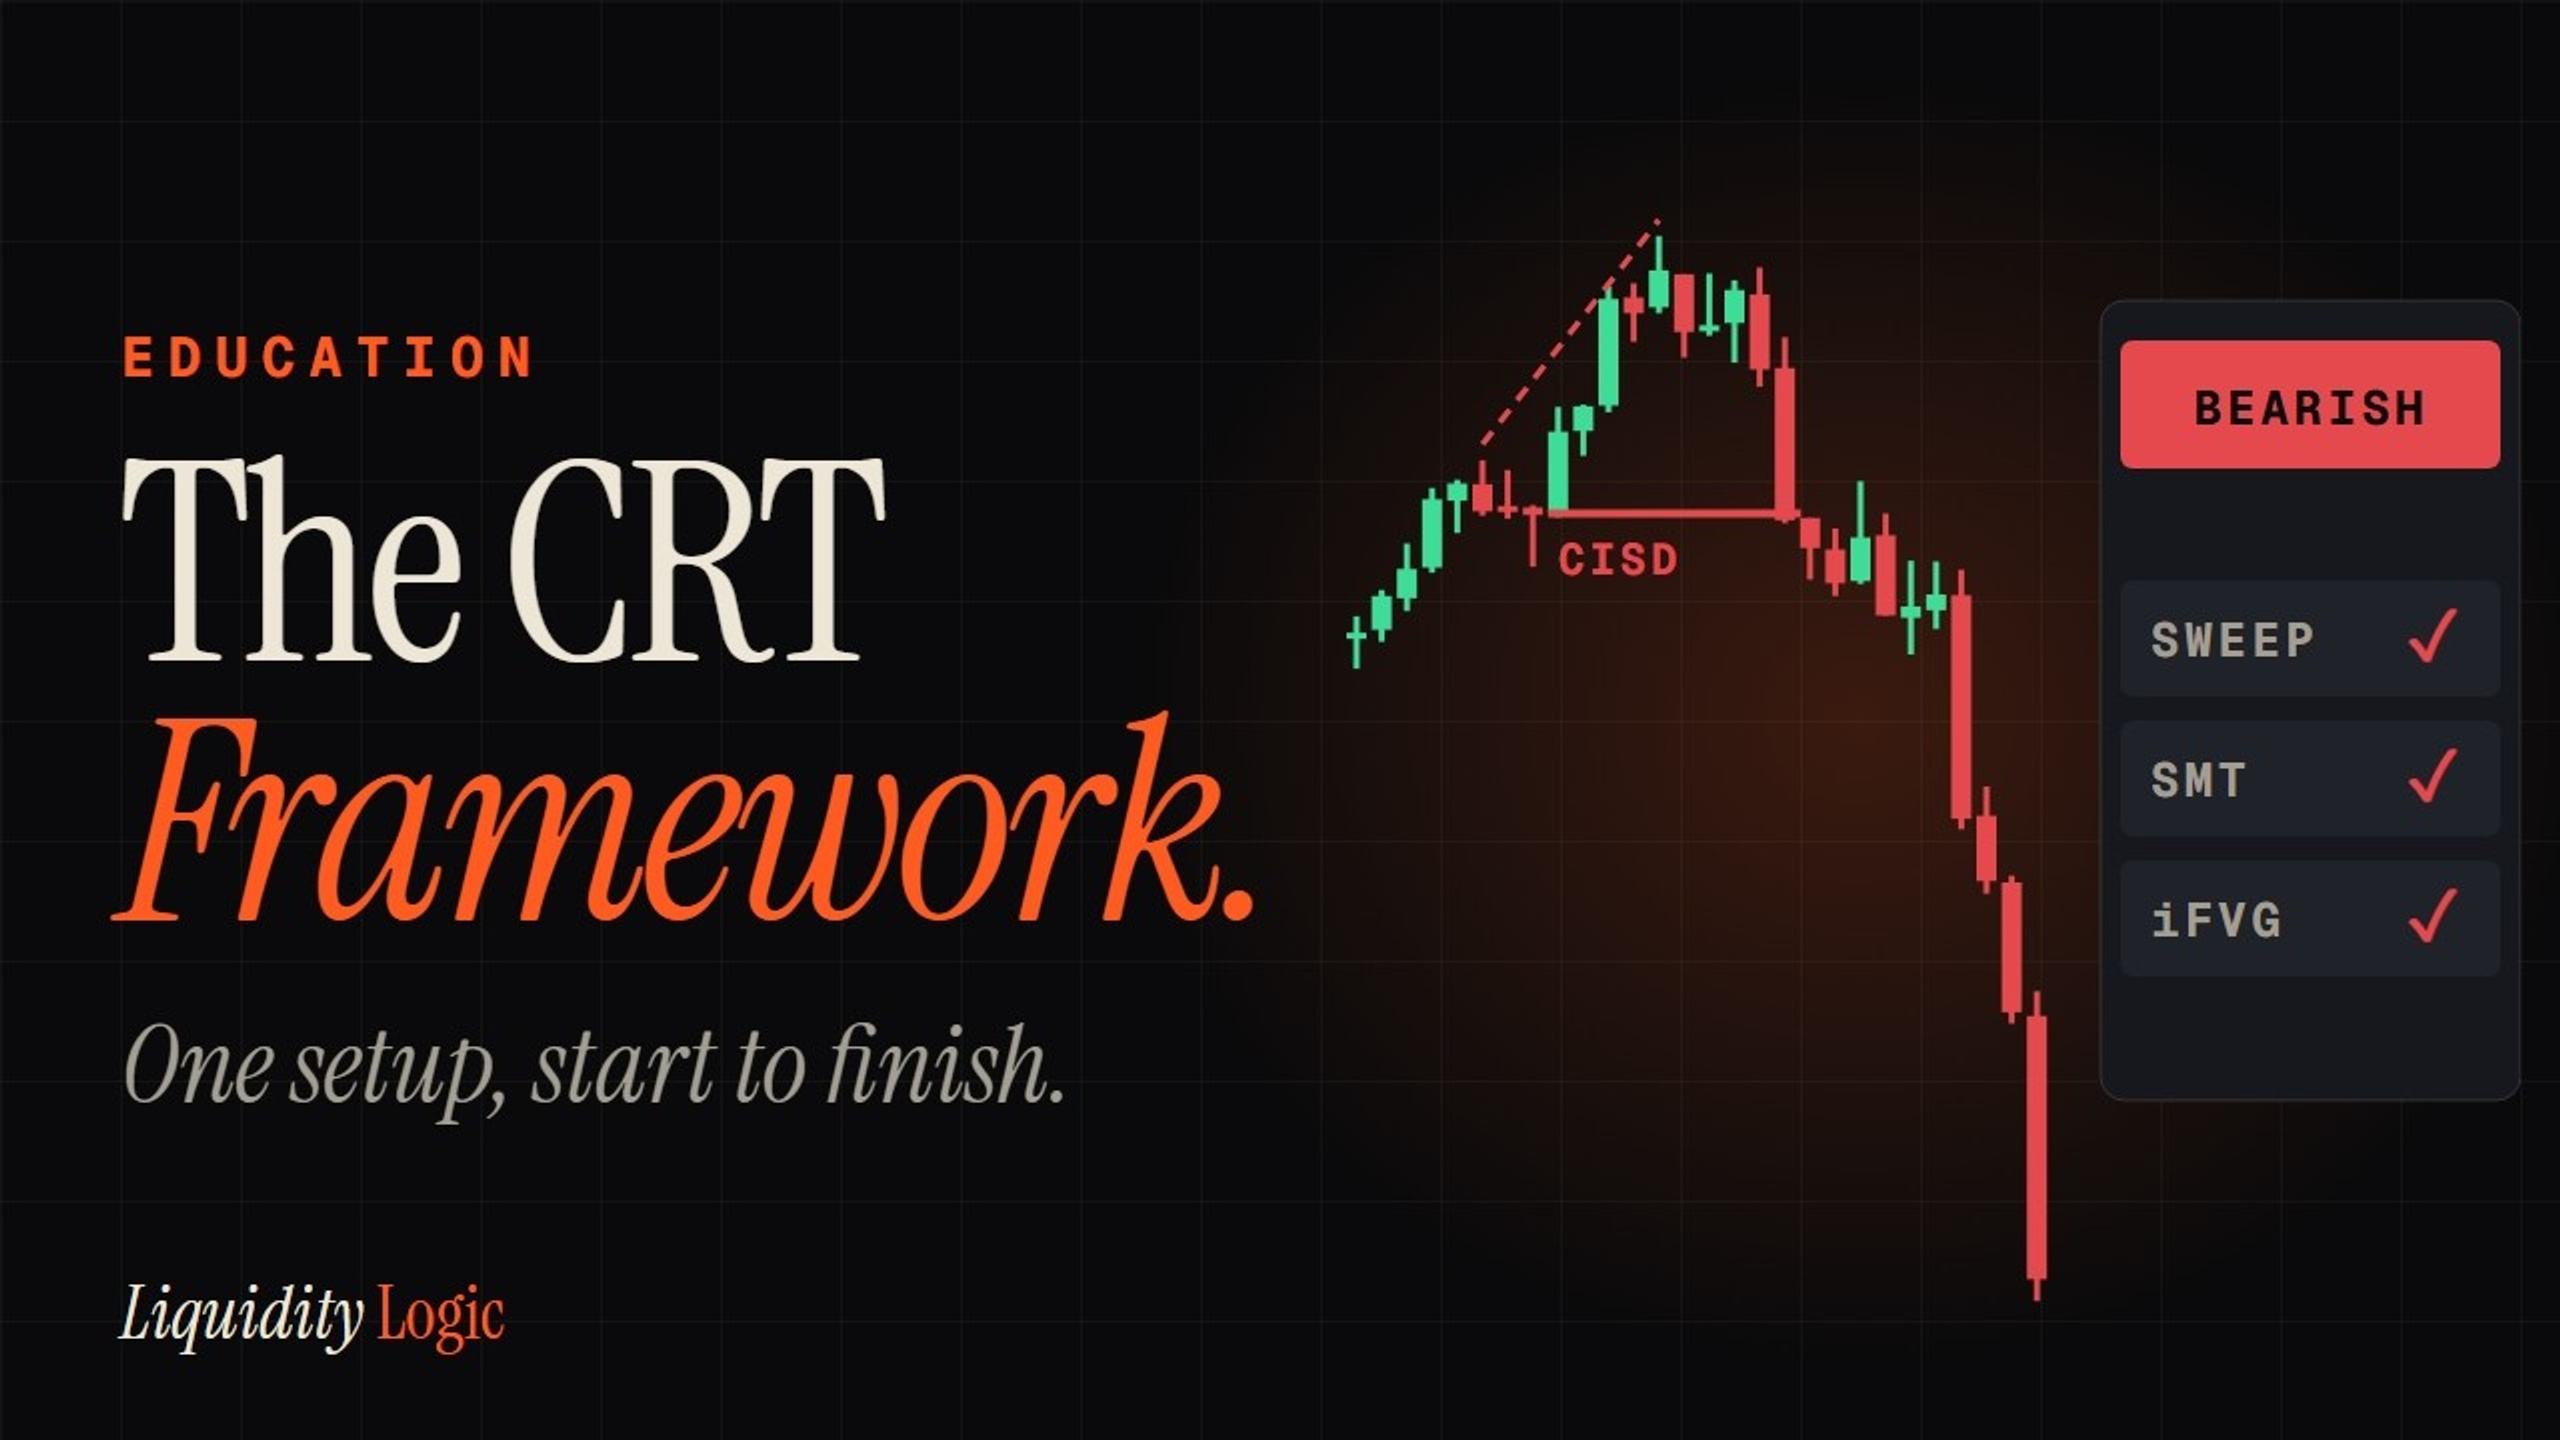
CRT Liquidity Framework maps Candle Range Theory (CRT) on one chart: the higher-timeframe candle range, the liquidity beyond it, the sweep of that liquidity, and the lower-timeframe shift that confirms price is delivering to the other side of the range.
Built for traders who already read ICT-style concepts (sweeps, CISD, SMT, FVGs) and want them drawn by fixed, consistent rules instead of by hand.
HOW THE MODEL WORKS
- Sweep. Price trades beyond the previous CRT candle’s high or low and closes back inside the range.
- CISD. On your execution timeframe, price closes through the origin of the last opposing move, confirming delivery has flipped.
- Delivery. Price is expected to draw toward the opposite side of the range, with projections drawn as reference levels.
WHAT IS ON THE CHART
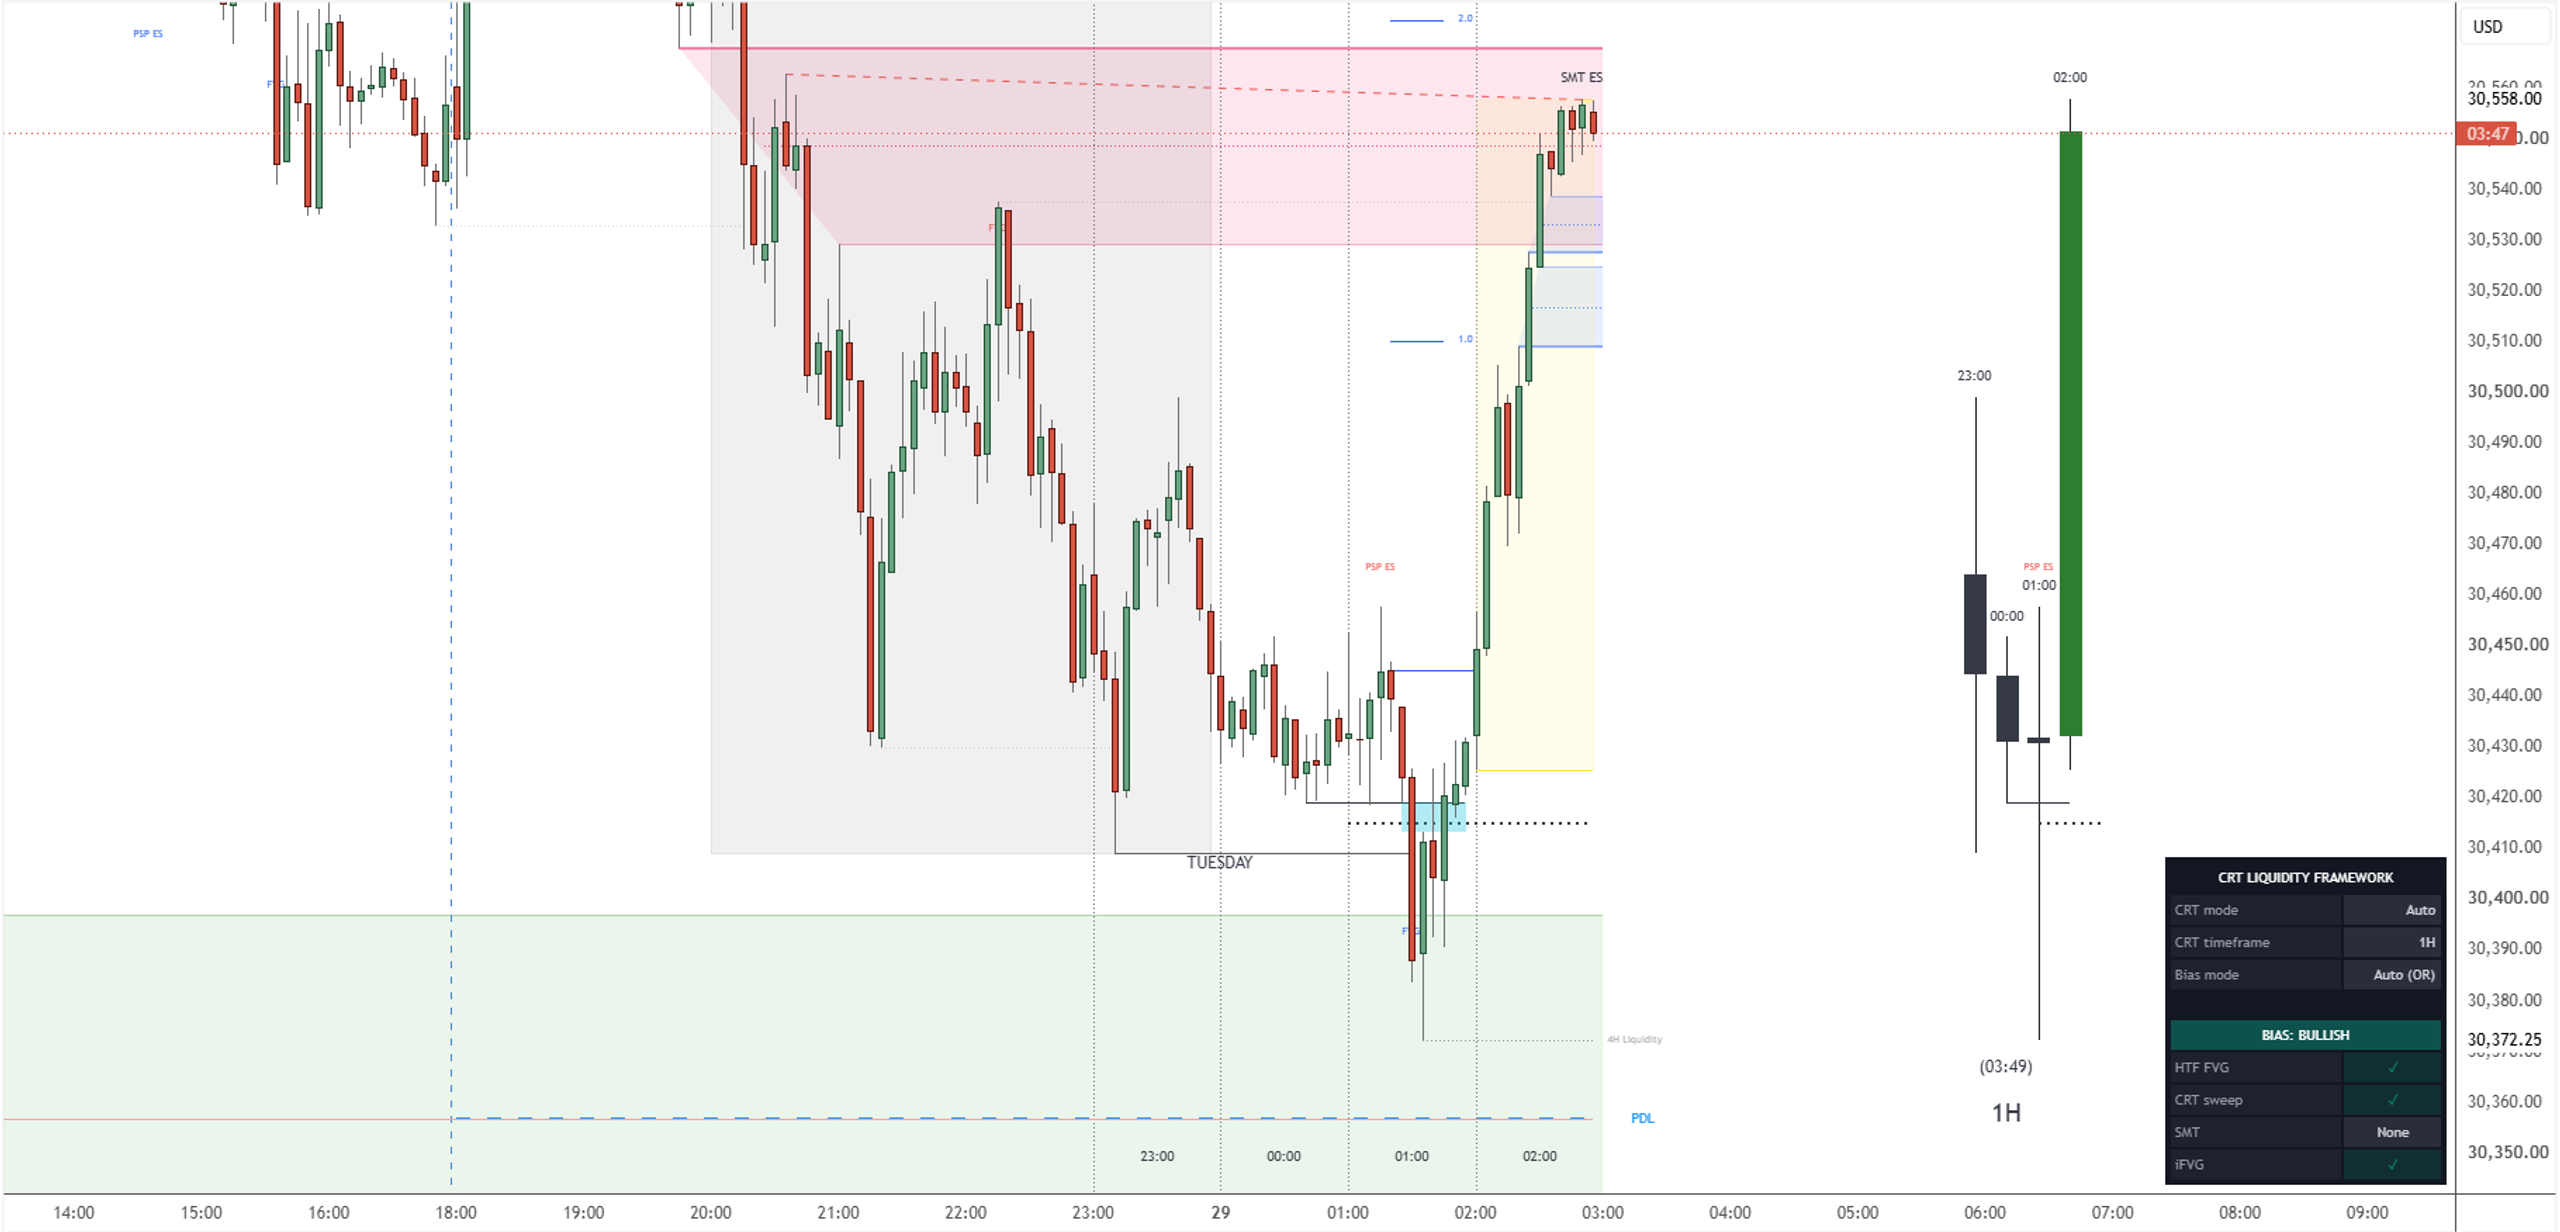
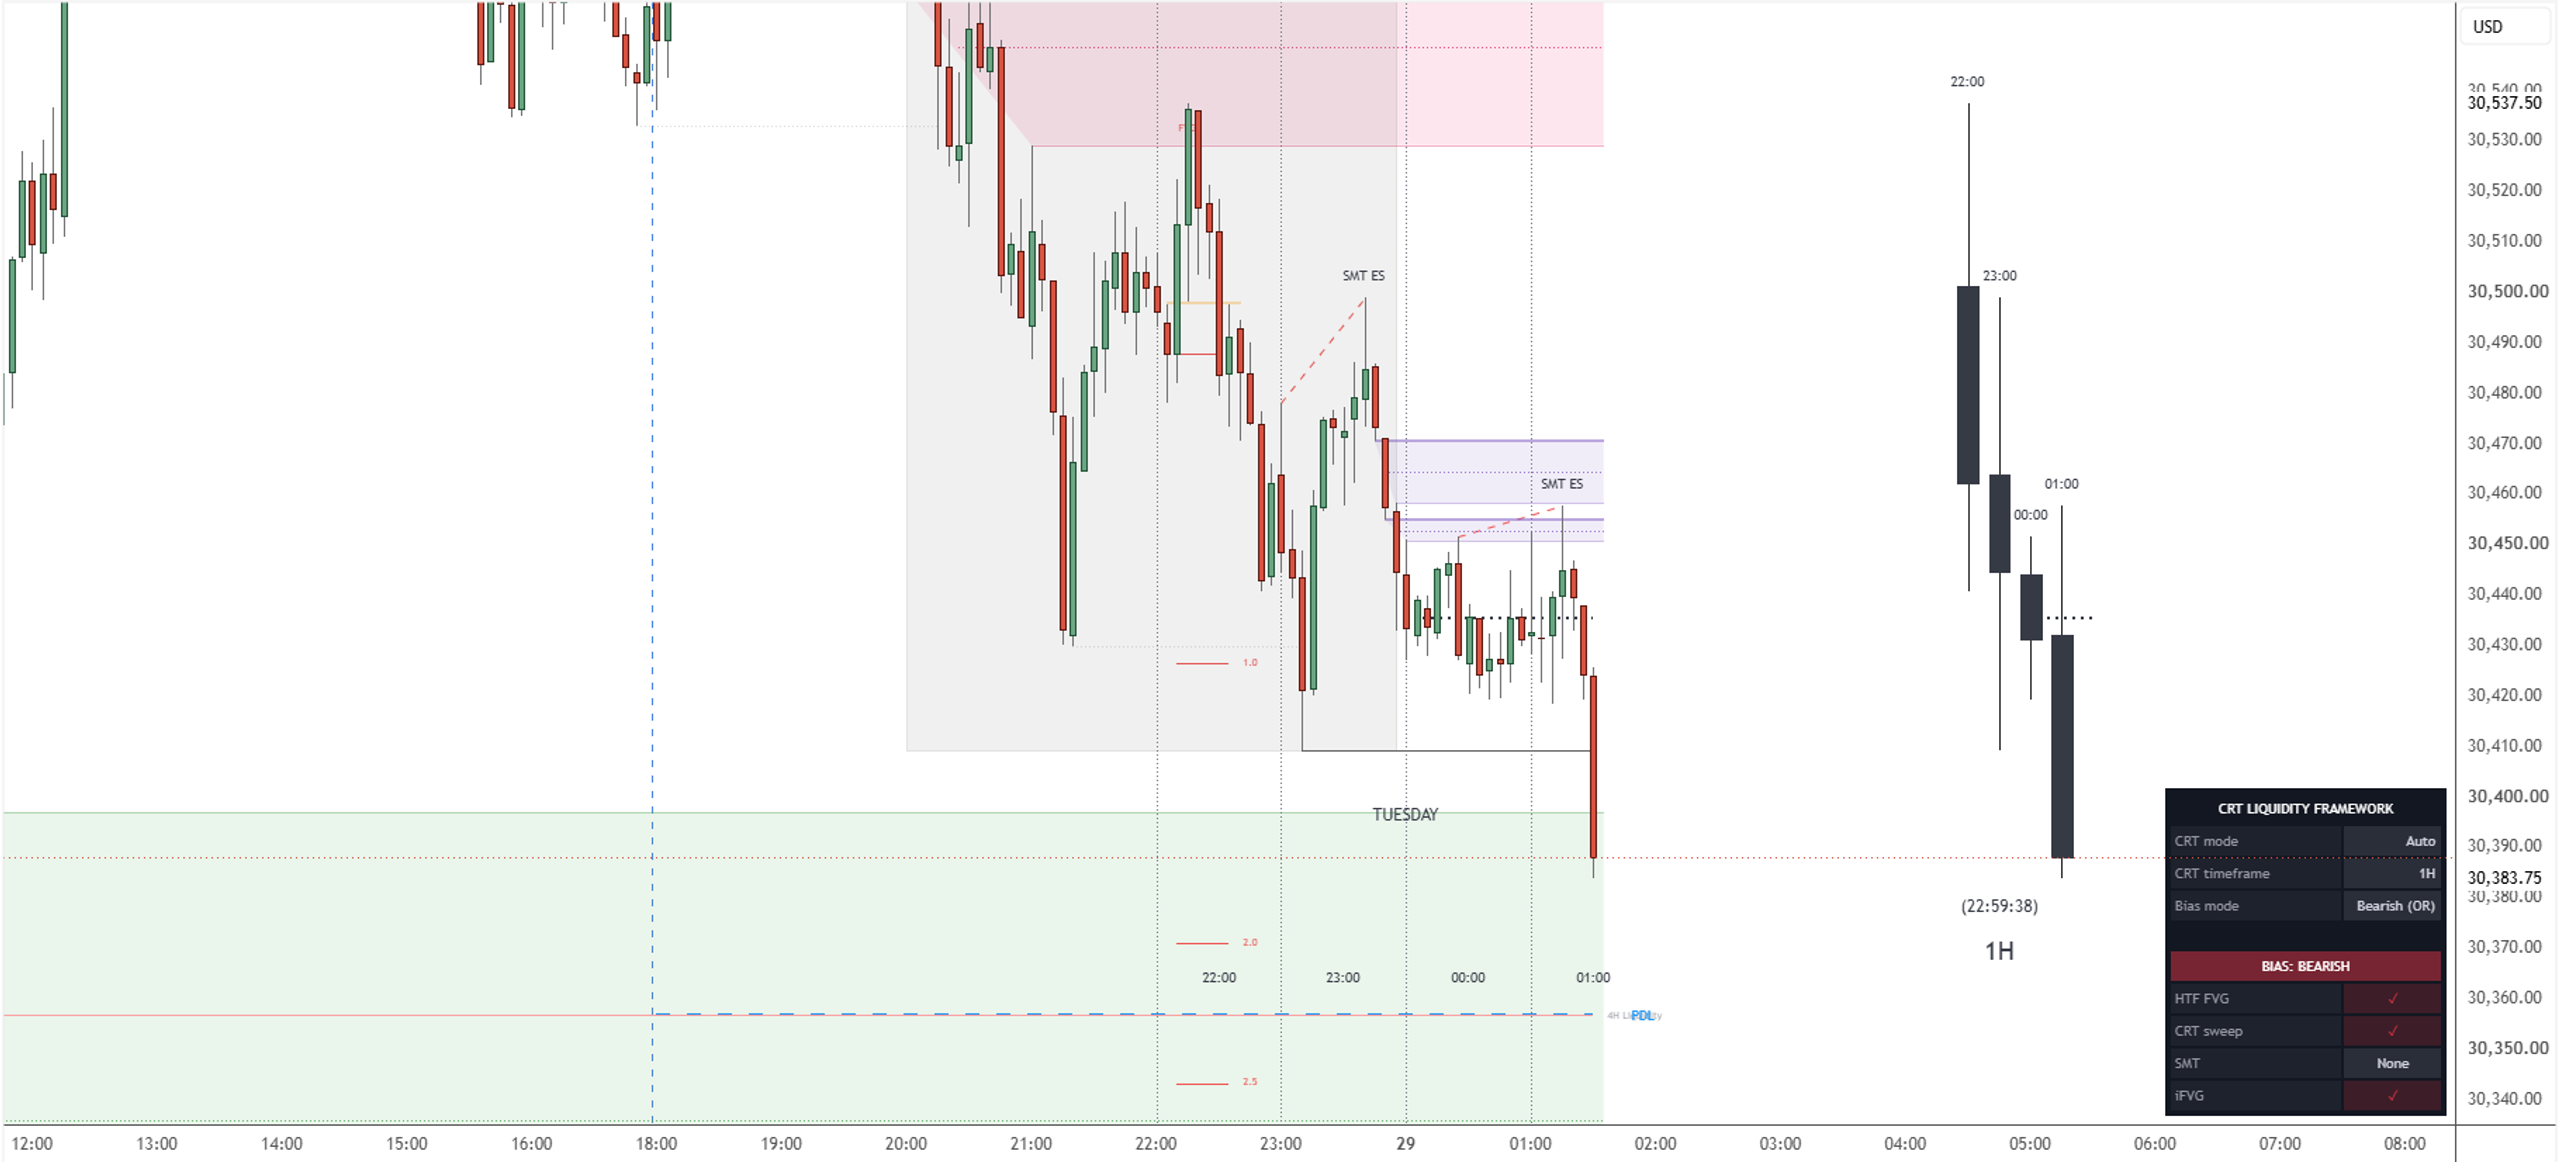
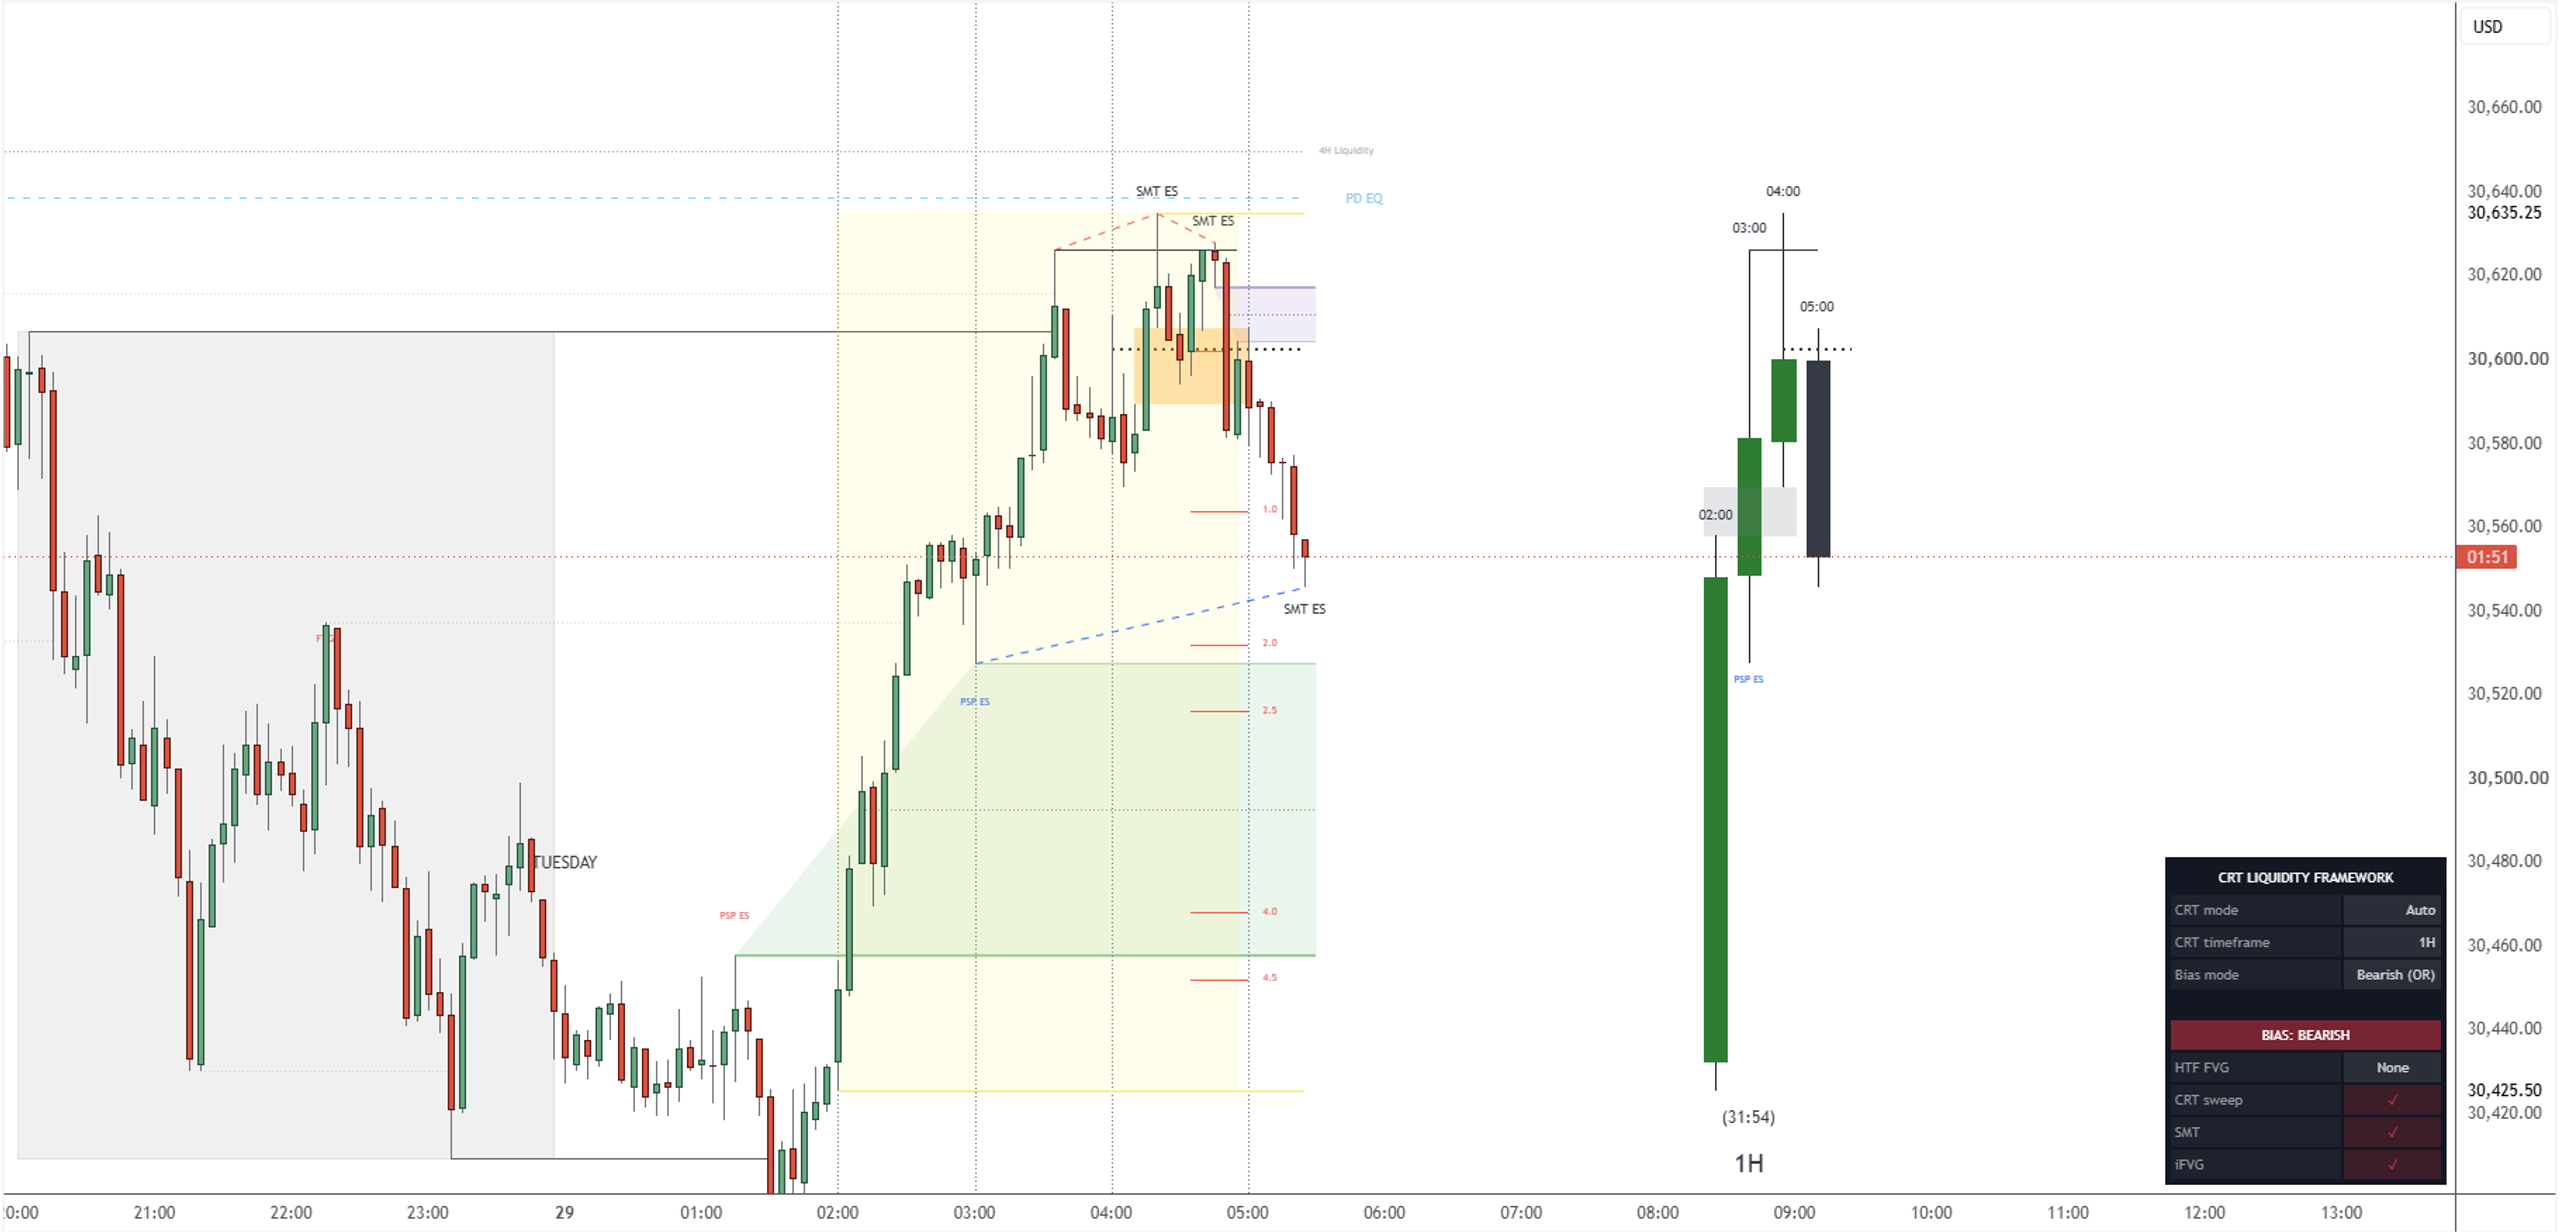
• HTF CRT candles projected beside price
• Auto timeframe alignment (e.g. 5m → 1H)
• Sweeps of CRT and PO3 highs/lows
• Previous HTF equilibrium (50%)
• CISD engine with projections
• SMT divergence and PSP
• FVG and iFVG layers
• Info table: bias, delivery direction, conditions
• Alerts for sweeps, SMT and iFVG
Every module can be switched off on its own.
HOW TO USE IT
- Add it to a 1m–15m chart with CRT timeframe on Auto.
- Read bias and delivery direction in the info table.
- Wait for a sweep of the CRT high/low or a tap of the HTF FVG.
- Let the CISD confirm, then frame the trade with the CRT range, equilibrium and projections.