


Model Suite
Take your trading strategy to the next level with our Models
Trading
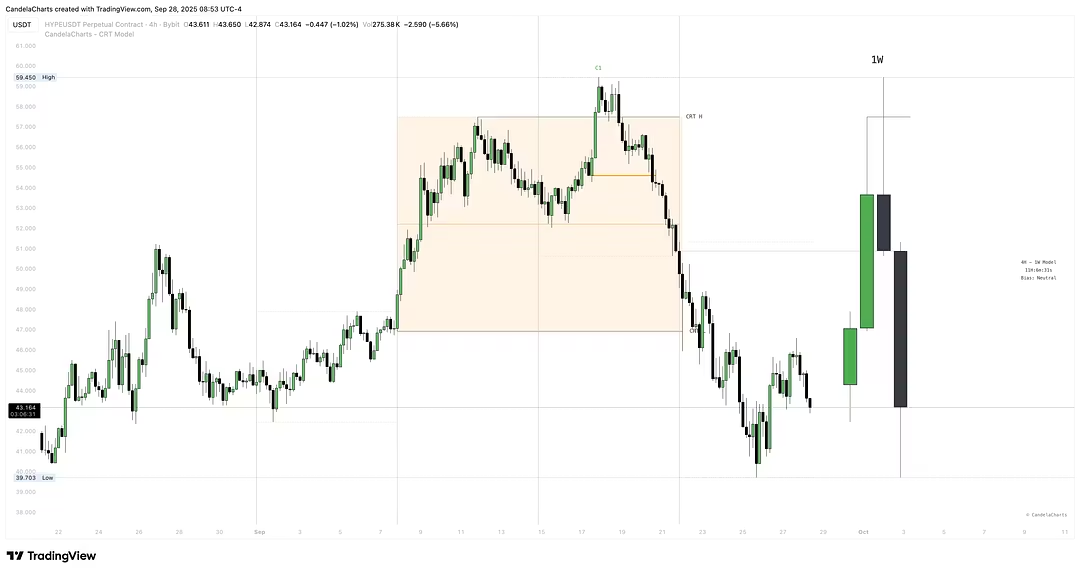
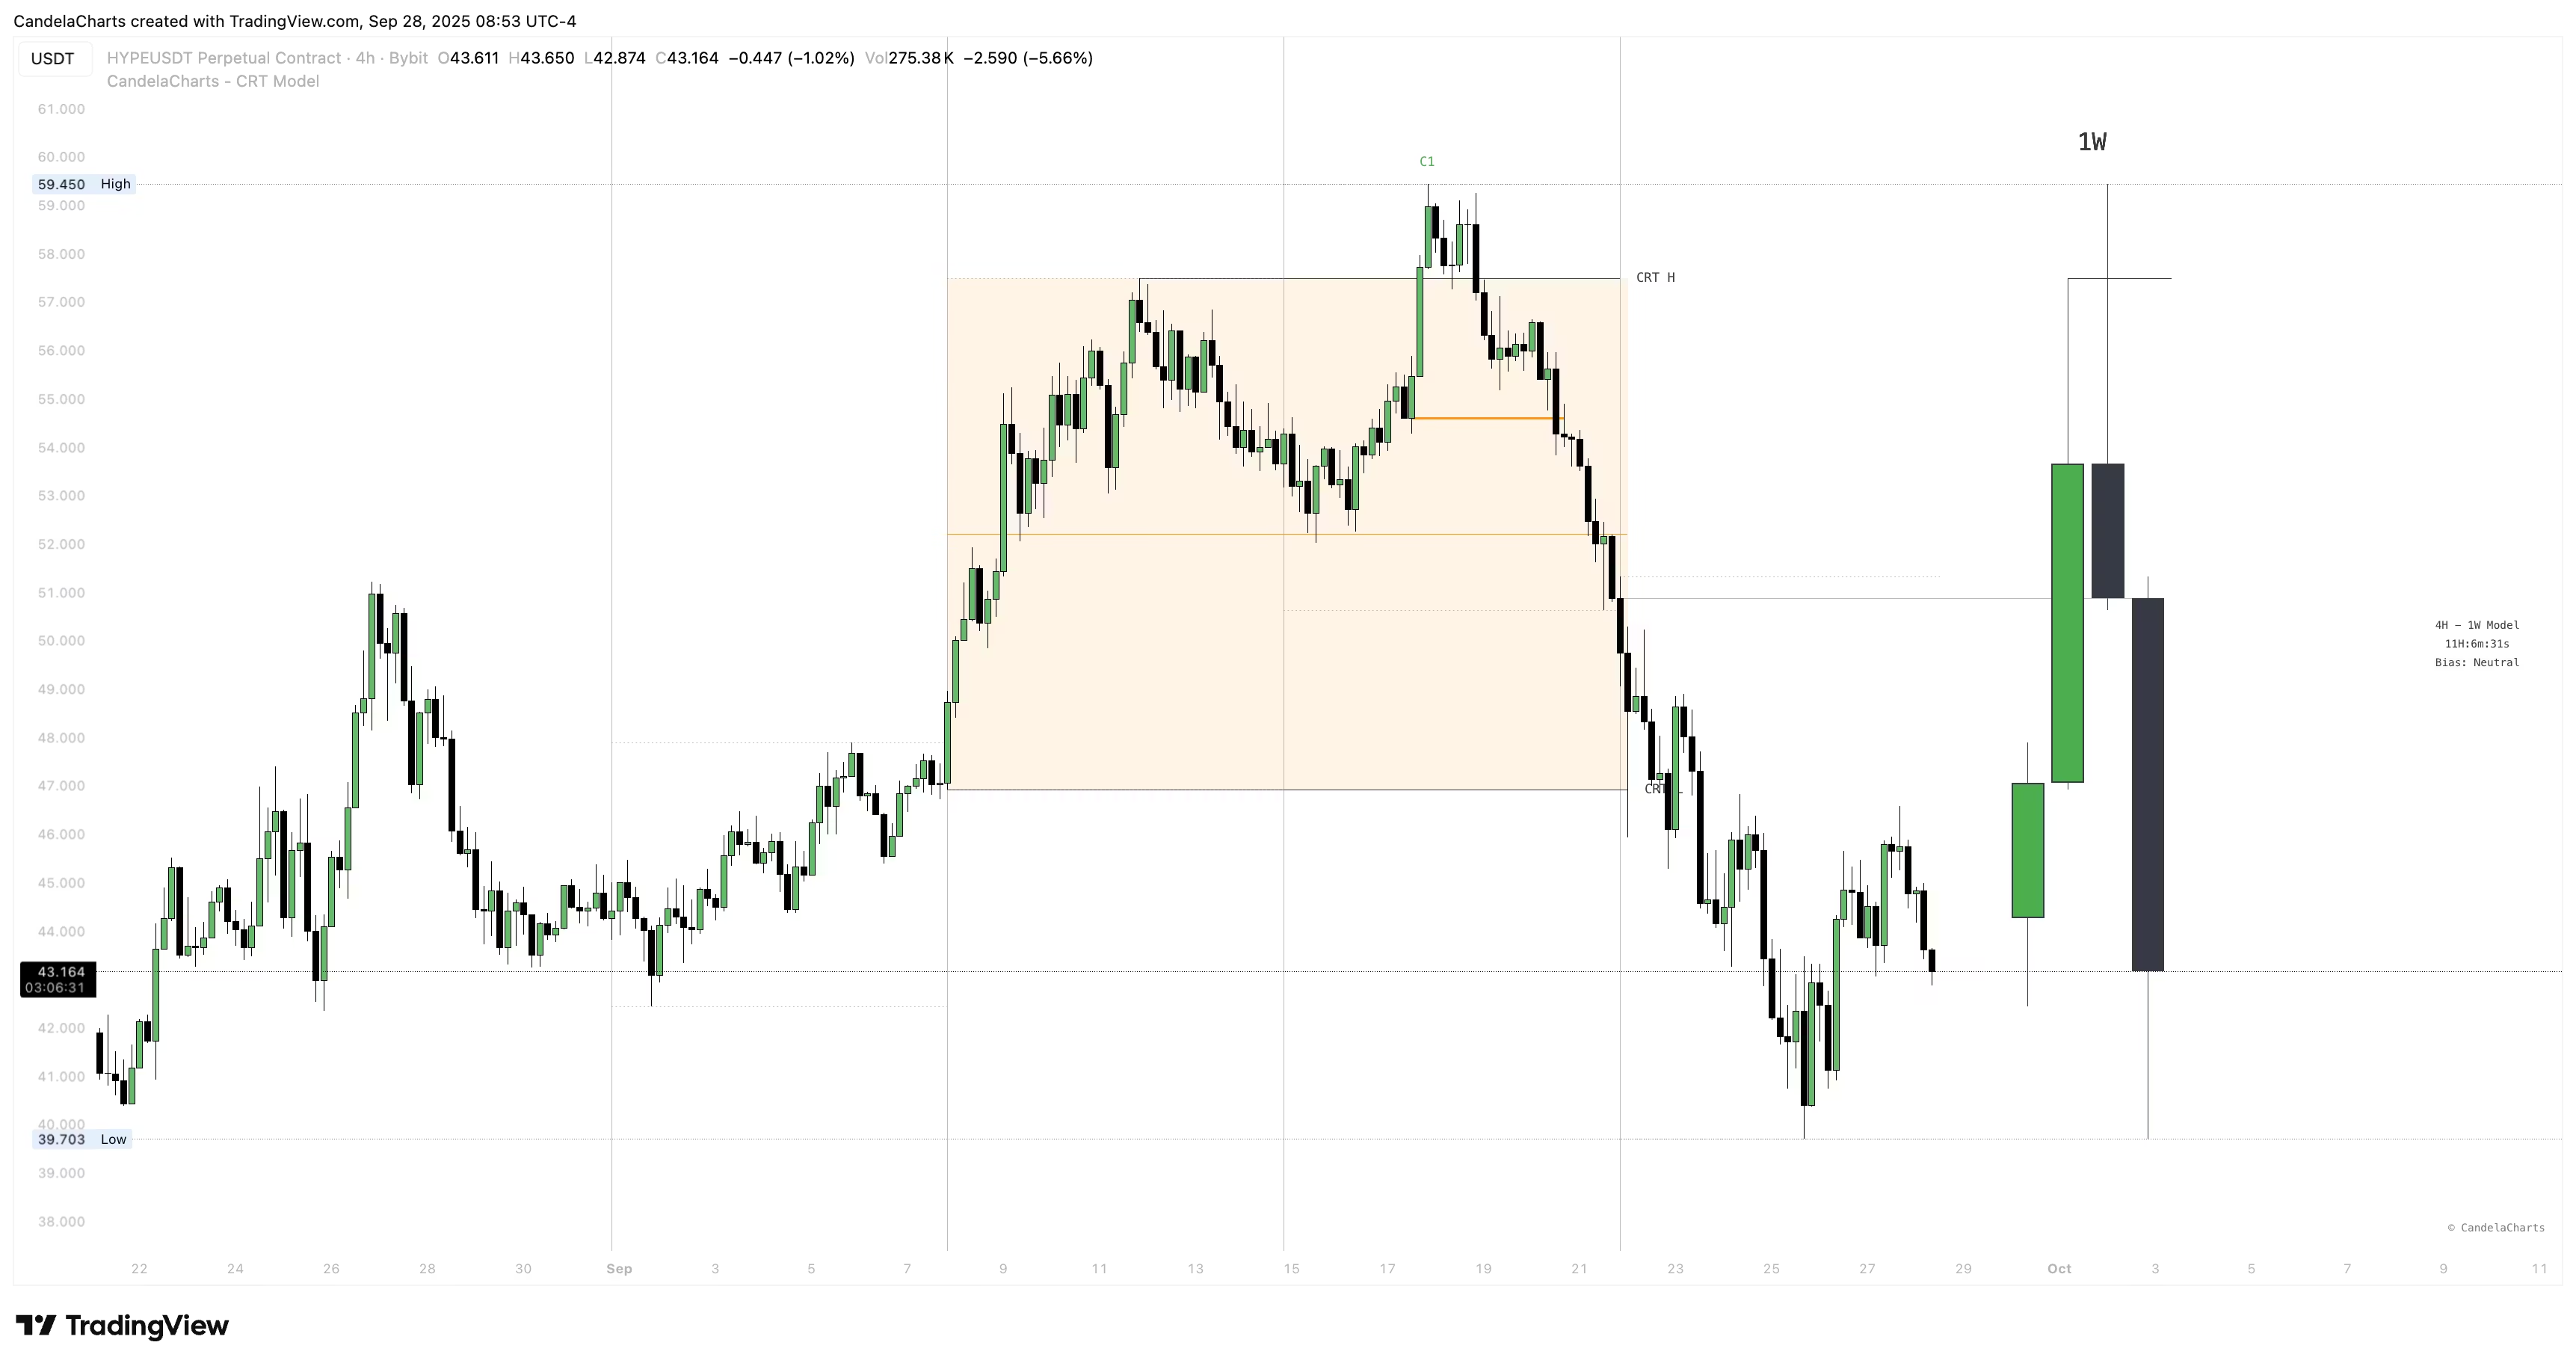
Gain access to a curated collection of robust trading models designed to help you build and refine your own strategies. This subscription includes detailed frameworks such as: X Model, Turtle Soup Model, Unicorn Model, CRT Model, Fractal Range Model.
These models don’t provide signals—they provide structure. Perfect for traders seeking a rules-based foundation to support discretionary or systematic approaches across markets.
Features
- Automates technical analysis, reducing mistakes from manual interpretation.
- Quickly analyzes market data, providing faster decision-making for traders.
- Ensures technical analysis is applied consistently without variation.
- Removes emotions from analysis, ensuring rational and objective assessments.
- Continuously scans the market, providing real-time technical insights.
About the creator

FAQs
Affiliates

10% reward
Earn money by bringing customers to CandelaCharts Indicators. Every time a customer purchases using your link, you'll earn a commission.
$59.99 / month
3 options