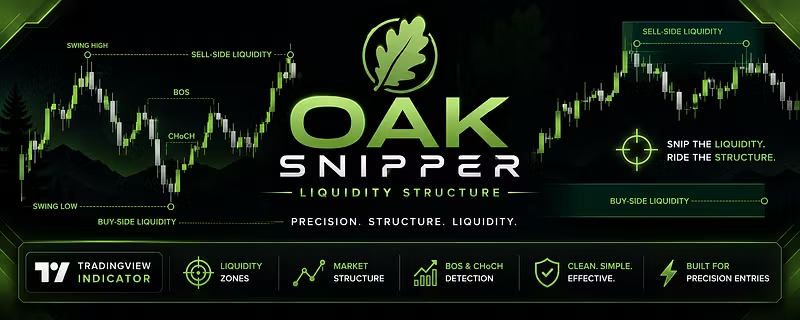
OAK Snipper Liquidity Structure is a powerful all-in-one liquidity based trading indicator designed to help traders understand where the...
Location hidden
•
•Created byProfile pictureUmmer Aftab
60 joined
Profile picture
Ummer AftabProfile picture@oaktlive·May 16
Pinned post

❓ Frequently Asked Questions (FAQ)

1️⃣ What is OAK Snipper Liquidity Structure?

OAK Snipper Liquidity Structure is a smart liquidity and market structure indicator that automatically detects important buy-side and sell-side liquidity zones, dynamic support/resistance areas, liquidity sweeps, and institutional reaction zones in real time.

It helps traders identify high-probability market reactions, reversals, and continuation opportunities.

2️⃣ Which markets can I use this indicator on?

You can use this indicator on almost any market, including:

  • Forex

  • Gold (XAUUSD)

  • Crypto

  • Indices

  • Stocks

  • Futures

  • Commodities

The indicator is designed to adapt dynamically to different market conditions.

3️⃣ Which timeframe works best?

The indicator works on all timeframes from:

  • 1 Minute

  • 3 Minute

  • 5 Minute

  • 15 Minute

  • 1 Hour

  • 3 Hour

  • 4 Hour

Recommended usage:

  • Scalping → 1M to 5M

  • Intraday → 5M to 30M

  • Swing Trading → 1H to 4H

4️⃣ What do the green and red zones mean?

🟢 Green Zones = BUY LIQ

These are potential support/liquidity areas where buyers may step into the market.

🔴 Red Zones = SELL LIQ

These are potential resistance/liquidity areas where sellers may react.

These zones are designed to highlight areas where liquidity and institutional activity may exist.

5️⃣ What does “Liquidity Sweep” mean?

A liquidity sweep happens when price temporarily moves above or below a liquidity zone and quickly returns back inside.

This often represents:

  • Stop hunts

  • Fake breakouts

  • Institutional liquidity grabs

  • Possible reversal setups

Liquidity sweeps can provide powerful trading opportunities when combined with candle confirmation.

6️⃣ What are Developing Zones?

Developing zones are live higher timeframe liquidity zones that appear before the higher timeframe candle fully closes.

They help traders:

  • Prepare for potential setups early

  • Track forming liquidity

  • Anticipate future market structure

These zones update dynamically in real time.

7️⃣ Does this indicator repaint?

The confirmed liquidity zones are designed to remain stable after confirmation.

Developing zones are dynamic by nature because they are based on live higher timeframe movement before candle close.

Once confirmed, the finalized zones remain fixed according to market structure behavior.

8️⃣ Can beginners use this indicator?

Yes.

The indicator is designed with simple visual colors and labels so both beginners and advanced traders can understand market liquidity behavior easily.

Even if you are new to smart money concepts, the visual structure helps simplify the learning process.

9️⃣ How should I take entries using this indicator?

A common approach is:

BUY Example

  • Price enters a BUY LIQ zone

  • Liquidity sweep happens below the zone

  • Strong bullish rejection candle appears

  • Enter after confirmation candle closes

SELL Example

  • Price enters a SELL LIQ zone

  • Liquidity sweep happens above the zone

  • Strong bearish rejection candle appears

  • Enter after confirmation candle closes

Always use proper risk management.

🔟 Can I use this indicator alone?

Yes, many traders use it standalone.

However, for stronger confirmation, you can combine it with:

  • Price action

  • Market structure

  • Volume

  • Trend analysis

  • Session timing

This can further improve trade quality.

1️⃣1️⃣ Why do some zones change color?

Zones change color depending on how price interacts with them.

The indicator automatically tracks:

  • Active zones

  • Touched zones

  • Swept zones

  • Broken zones

This helps traders understand the current condition and strength of each liquidity area.

1️⃣2️⃣ Is this indicator suitable for Gold trading?

Yes.
The indicator performs especially well on:

  • Gold (XAUUSD)

  • Nasdaq

  • Forex major pairs

  • Crypto volatility markets

It is highly useful for tracking liquidity sweeps and institutional reactions in fast-moving markets.

1️⃣3️⃣ Does the indicator work during all trading sessions?

Yes.

It can be used during:

  • London Session

  • New York Session

  • Asian Session

Many traders prefer using it during high-volume sessions for stronger reactions and liquidity movement.

1️⃣4️⃣ What makes this indicator different from normal support & resistance indicators?

Traditional support/resistance indicators only draw static levels.

OAK Snipper Liquidity Structure focuses on:

  • Smart liquidity behavior

  • Real-time sweeps

  • Dynamic structure

  • Institutional reaction zones

  • Adaptive market conditions

This provides a much deeper understanding of how price interacts with liquidity.

1️⃣5️⃣ Is this indicator good for scalping?

Yes.

The indicator is highly effective for scalping because it helps identify:

  • Fast liquidity grabs

  • Short-term reversals

  • Intraday reaction zones

  • Momentum continuation areas

Many traders use it on 1M–5M charts for precision entries.

Profile picture
Ummer AftabProfile picture@oaktlive·May 16
Pinned post

🌳 OAK Snipper Liquidity Structure

The Complete Smart Liquidity & Market Structure Toolkit

OAK Snipper Liquidity Structure is a powerful all-in-one trading indicator designed to help traders identify high-probability liquidity zones, dynamic support & resistance areas, market reaction zones, and smart price movement behavior in real time.

This indicator is built for traders who want clean charts, professional liquidity mapping, and institutional-style market structure analysis without complicated setups.

Whether you are a:

  • Scalper

  • Intraday trader

  • Swing trader

  • Smart money trader

  • Price action trader

this indicator is designed to help you understand where the market is likely to react, reverse, sweep liquidity, or continue trending.

✅ Works on Any Market

OAK Snipper Liquidity Structure works smoothly on:

  • Forex

  • Gold (XAUUSD)

  • Crypto

  • Indices

  • Stocks

  • Futures

  • Commodities

You can use it on almost any symbol available on TradingView.

✅ Supports Multiple Timeframes

This indicator is designed to work perfectly from lower timeframes to higher timeframes.

Recommended usage:

  • 1 Minute → Fast scalping

  • 3 Minute → Scalping

  • 5 Minute → Intraday

  • 15 Minute → Intraday & momentum trading

  • 30 Minute → Intraday structure

  • 1 Hour → Swing entries

  • 2 Hour → Swing confirmation

  • 3 Hour → Main liquidity structure

  • 4 Hour → Strong institutional zones

The indicator automatically adapts to the chart timeframe while maintaining higher timeframe liquidity structure behavior.

🌳 Main Features

1️⃣ Smart Liquidity Zones

The indicator automatically detects:

  • Buy-side liquidity zones

  • Sell-side liquidity zones

These zones are created using higher timeframe market structure and liquidity behavior.

BUY LIQ Zones

Green zones represent areas where buyers may enter aggressively or where liquidity exists below price.

SELL LIQ Zones

Red zones represent areas where sellers may react or where liquidity exists above price.

These zones help traders identify:

  • Reversal areas

  • Stop hunt zones

  • Liquidity sweeps

  • Institutional reaction areas

  • Breakout continuation points

2️⃣ Developing Liquidity Zones

One of the most advanced features of this indicator.

The indicator creates:

  • Developing Buy Liquidity Zones

  • Developing Sell Liquidity Zones

before the higher timeframe candle is fully closed.

These zones allow traders to:

  • Prepare early entries

  • Anticipate future liquidity

  • Track live market structure development

Developing zones are shown using dashed borders and lighter colors to clearly separate them from confirmed zones.

This gives traders an early warning system before major market moves happen.

3️⃣ Dynamic Zone State Engine

Every liquidity zone changes its behavior and color based on live market interaction.

The indicator tracks 4 important states:

🟢 ACTIVE

Fresh untouched liquidity zone.

This means price has not reacted yet and the zone is still valid.

These are often the strongest zones.

🟡 TOUCHED

Price entered the zone but did not fully reject or break it.

This tells traders:

  • Market is reacting

  • Liquidity is being tested

  • Momentum may slow down

🟠 SWEPT

Liquidity sweep detected.

This is one of the most important smart money concepts.

A sweep usually means:

  • Stop hunts

  • Fake breakouts

  • Liquidity grabs

  • Potential reversals

This can provide strong reversal opportunities when combined with confirmation candles.

⚫ BROKEN

The liquidity zone failed.

Price closed completely through the zone.

This helps traders avoid taking outdated setups and keeps charts clean and updated.

4️⃣ Automatic Dynamic Support & Resistance Zones

The indicator automatically creates:

  • Dynamic support zones

  • Dynamic resistance zones

using higher timeframe market structure.

These zones continuously adapt to market movement and update automatically.

Benefits:

  • Identify trend continuation areas

  • Find rejection zones

  • Detect breakout regions

  • Follow institutional price movement

5️⃣ Trend-Aware Market Structure

The indicator uses trend behavior internally to help identify:

  • Bullish environments

  • Bearish environments

  • Strong momentum conditions

  • Weak reaction areas

This helps zones react more intelligently to market movement.

6️⃣ Previous Day Premium & Discount Zones

The indicator automatically plots:

  • Previous day reaction areas

  • Dynamic daily structure zones

  • Premium & discount regions

These zones help traders identify:

  • High probability intraday reaction areas

  • Daily support and resistance

  • Reversal regions

  • Institutional pricing areas

Perfect for:

  • London session trading

  • New York session trading

  • Gold trading

  • Intraday reversals

7️⃣ Auto-Clean System

The indicator automatically removes:

  • Old zones

  • Overlapping zones

  • Invalid developing zones

This keeps the chart:

  • Clean

  • Fast

  • Easy to read

  • Professional

No chart clutter.

8️⃣ Real-Time Updating Zones

All zones extend dynamically in real time.

This means:

  • Liquidity areas stay updated

  • Structure remains visible

  • Traders can monitor reactions live

without needing to refresh charts.

🎯 How To Use The Indicator

BUY Setup

Look for:
✅ Price entering a BUY LIQ zone
✅ Liquidity sweep below support
✅ Strong bullish rejection candle
✅ Price closing back above the zone

Best confirmations:

  • Bullish engulfing candle

  • Strong rejection wick

  • Market structure shift

  • Volume increase

Potential targets:

  • Previous highs

  • SELL LIQ zones

  • Dynamic resistance zones

SELL Setup

Look for:
✅ Price entering a SELL LIQ zone
✅ Liquidity sweep above resistance
✅ Strong bearish rejection candle
✅ Price closing back below the zone

Best confirmations:

  • Bearish engulfing candle

  • Rejection wick

  • Momentum shift

  • Structure break

Potential targets:

  • Previous lows

  • BUY LIQ zones

  • Dynamic support zones

🔥 Best Strategy Ideas

This indicator works extremely well with:

  • Price action

  • Smart money concepts (SMC)

  • ICT concepts

  • Supply & demand

  • Break & retest trading

  • Liquidity sweep trading

  • Trend continuation trading

📈 Scalping Usage

For scalpers:

  • Use on 1M–5M charts

  • Watch for sweeps inside liquidity zones

  • Enter after rejection confirmation

  • Use nearby liquidity as targets

Especially effective for:

  • Gold scalping

  • Nasdaq scalping

  • Forex session scalping

📊 Intraday Usage

For intraday traders:

  • Use 5M–30M charts

  • Trade reactions from major liquidity zones

  • Combine with session highs/lows

  • Follow directional bias

🚀 Swing Trading Usage

For swing traders:

  • Use 1H–4H charts

  • Focus on major liquidity sweeps

  • Use broken zones for continuation trades

  • Hold positions between liquidity targets

💡 Why This Indicator Is Powerful

Unlike traditional support & resistance indicators, OAK Snipper Liquidity Structure focuses on:

  • Liquidity behavior

  • Institutional reactions

  • Smart money sweeps

  • Dynamic market structure

  • Real-time zone adaptation

This helps traders understand:

  • Where liquidity exists

  • Where stop hunts may occur

  • Where reversals are likely

  • Where momentum may continue

✅ Key Advantages

✔ Clean professional liquidity zones
✔ Real-time developing structure
✔ Automatic dynamic support & resistance
✔ Smart liquidity sweep detection
✔ Adaptive market structure behavior
✔ Multi-timeframe compatible
✔ Works on all symbols & markets
✔ Great for scalping, intraday & swing trading
✔ Beginner friendly visual design
✔ Advanced institutional-style analysis

⚠ Important Trading Notes

This indicator is designed to assist with market structure and liquidity analysis.

For best results:

  • Always wait for candle confirmation

  • Combine with proper risk management

  • Avoid trading during extreme news volatility

  • Use higher timeframe bias for stronger setups

🌳 Final Words

OAK Snipper Liquidity Structure was created to simplify smart money and liquidity trading into a clean, easy-to-read visual system.

Whether you are a beginner learning liquidity concepts or an experienced trader looking for cleaner institutional structure mapping, this indicator provides a powerful framework for identifying high-probability trading opportunities across all markets and timeframes.