
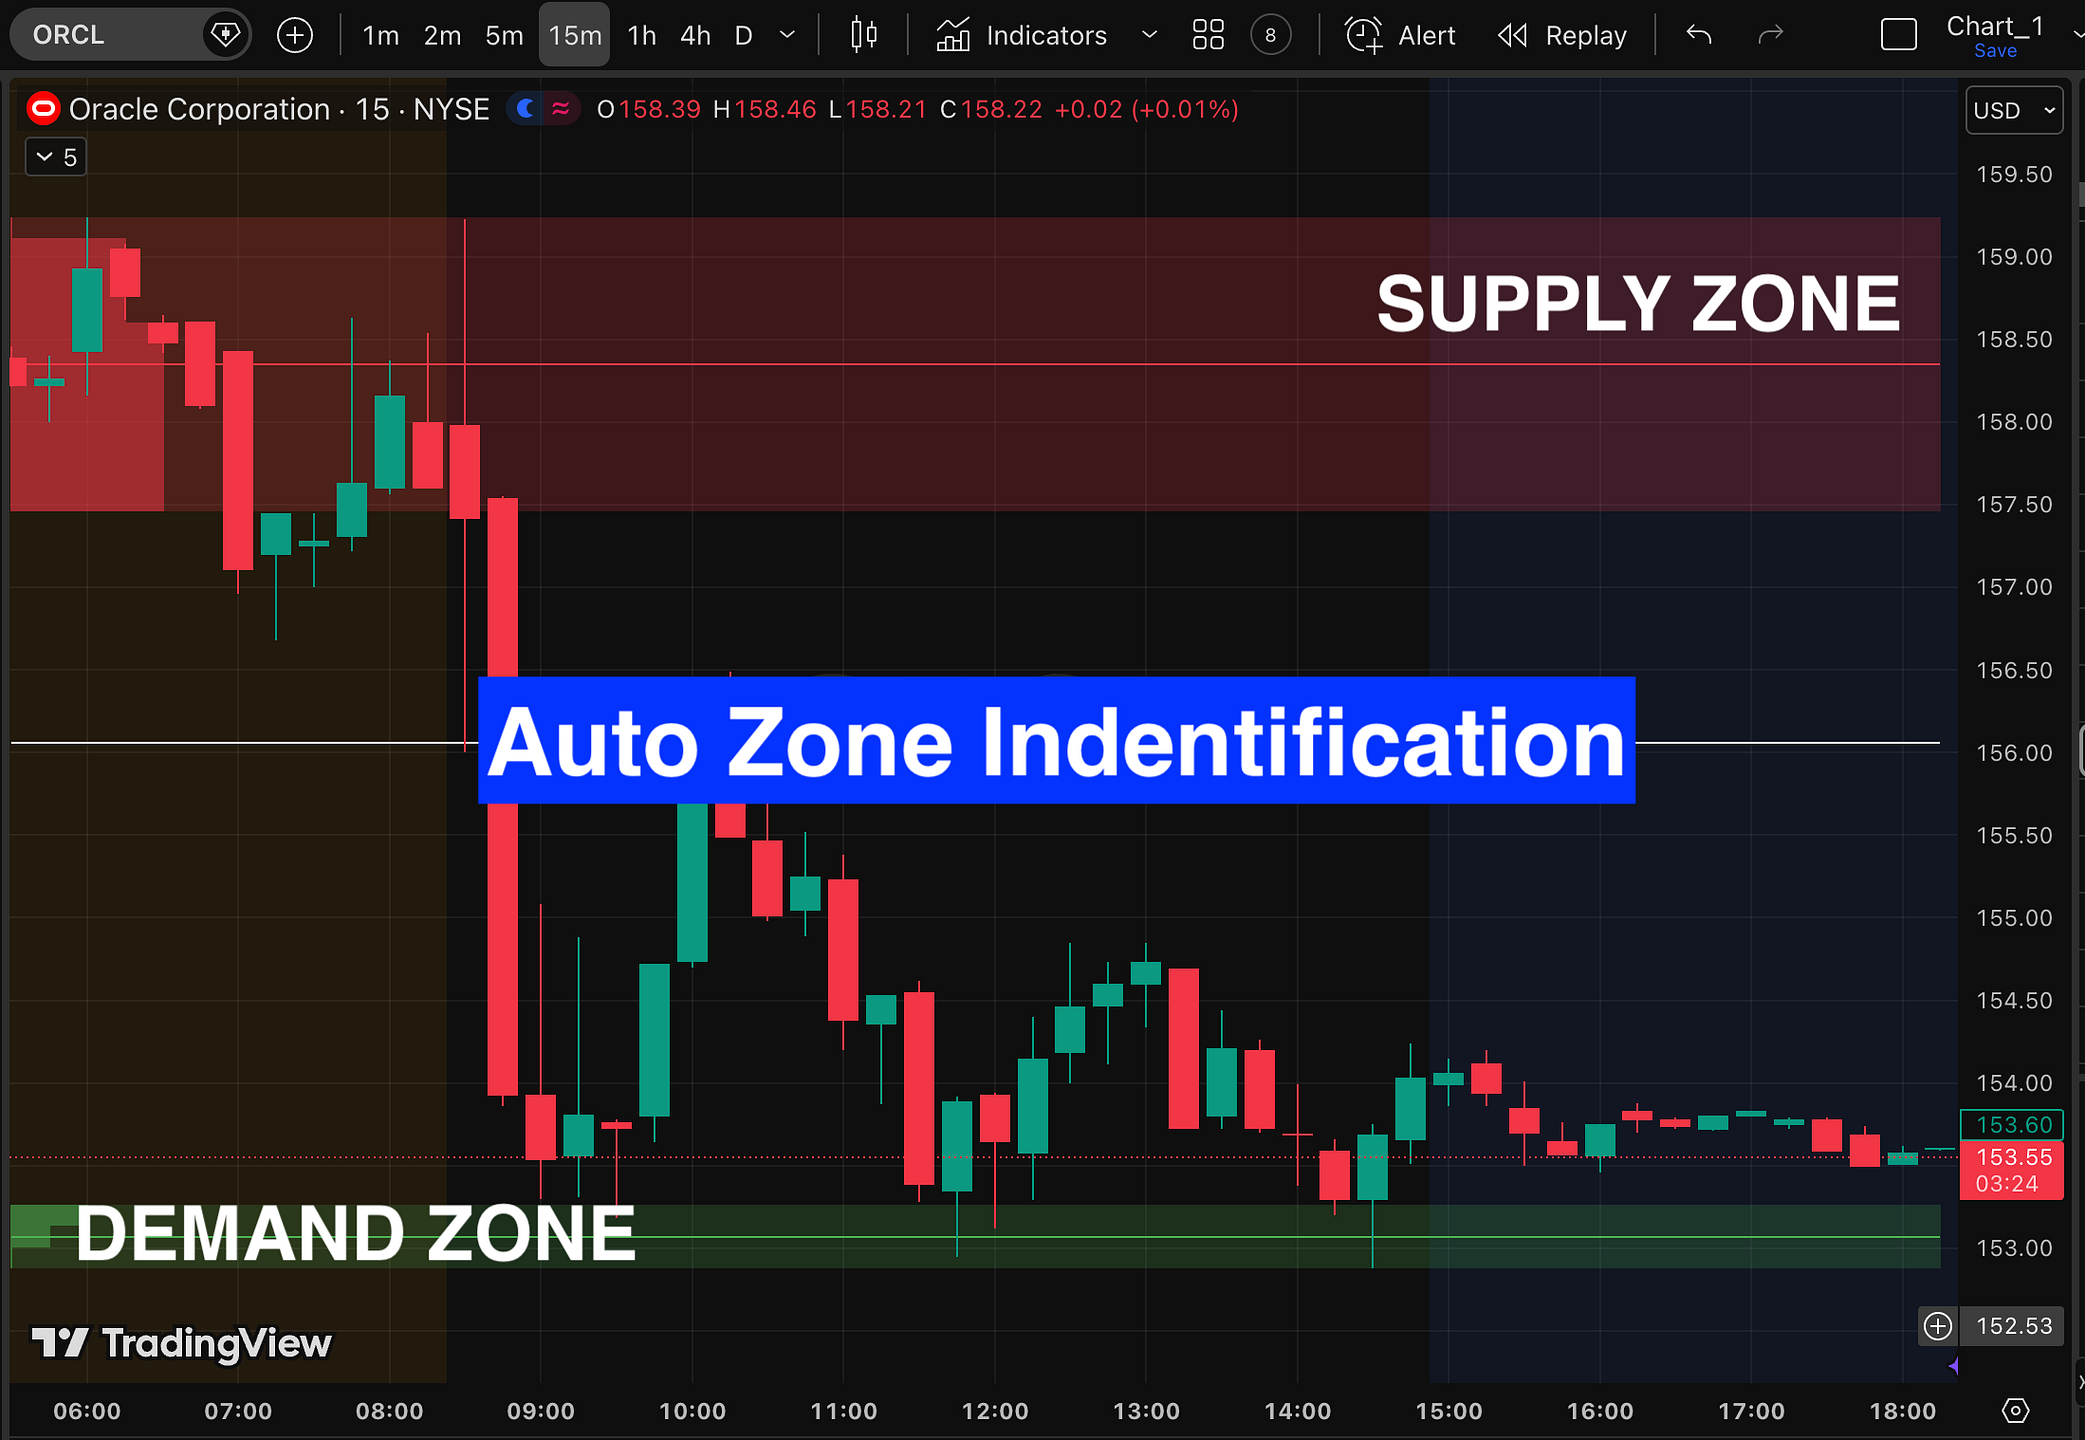
Supply and Demand Zone
Automated Supply and Demand Zone Indicators for TradingView
Indicator 1: Automated Supply & Demand Zones
The Supply and Demand Zone Indicator for TradingView is a structured technical tool designed to objectively identify high-probability market zones. It removes subjectivity by automatically detecting Demand and Supply areas, reducing chart clutter and allowing traders to focus on execution. Built for precision and efficiency, the indicator analyzes price and volume behavior to highlight areas where institutional activity and market imbalances are most likely.
How It Works:
- Calculates total visible volume
- Divides price vertically into defined intervals
- Accumulates volume within each slice
- When a slice exceeds a set percentage of total volume:
- Upper region becomes a Supply Zone
- Lower region becomes a Demand Zone
It then plots:
- Supply and Demand zones (high-volume regions)
- An equilibrium midpoint line
- Dashed weighted averages representing the true volume center
Indicator 2: Support & Resistance with Break Confirmation
This indicator strengthens traditional pivot-based support and resistance analysis by identifying significant breaks. Using a Volume Oscillator filter, it highlights only volume-confirmed breakouts, helping traders separate strong moves from market noise and focus on high-probability opportunities.