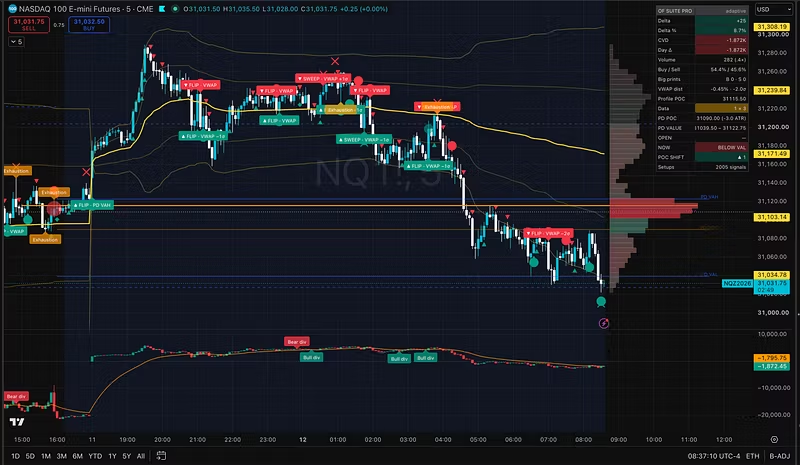


Quickstart Guide: Setting Up Orderflow Suite Pro on TradingView
Orderflow Suite Pro: Setup Guide and 3 Playbooks
Welcome! This post shows you how to set up the indicator and the three ways I read it. Read this first, then open a chart.
1. Setup (2 minutes)
Open a chart of NQ, MNQ, ES or MES on 1m, 2m or 5m. Any symbol with volume works.
Add Orderflow Suite Pro. The CVD opens in its own pane, and everything else draws on the price chart.
Start with these settings:
Delta model: Adaptive (the default)
Signals on closed bars only: ON. Signals then never disappear after a bar closes.
CVD anchor and VWAP anchor: RTH for US index futures, so they reset at the 09:30 New York open.
Modules: turn on Session levels and Key-level setups. If the chart looks busy, turn off Big prints.
Check the Data row in the dashboard. It shows how many smaller-timeframe bars the delta is built from:
Something like
1S × 60or1 × 5: good data.Amber or
bar (approx.): the delta is only a rough estimate on this chart. Go down a timeframe, or rely more on the levels.
2. How to read it in one sentence
Levels tell you where to look. Order flow tells you whether to act.
A signal in the middle of nowhere is noise. The same signal at a prior-day value-area high or low, a naked POC, a VWAP band or a stacked zone is information.
3. Key levels to mark before the open
PD POC / VAH / VAL: yesterday’s fair value and its edges.
nPOC: older POCs that price hasn’t returned to yet.
PDH / PDL: the previous day’s high and low.
VWAP and its σ-bands.
Stacked imbalance zones: green boxes are buyers, red boxes are sellers. A zone stays active until a bar closes through it.
Look at the dashboard rows OPEN and NOW. Is price opening above, inside or below yesterday’s value? That sets the type of day you’re likely to see.
4. Playbook A: Failed breakout at a value edge
Idea: price pokes outside yesterday’s value, but the buyers or sellers who pushed it there get stuck.
Price trades above PD VAH (or below PD VAL).
You get a liquidity sweep ✕, or trapped buyers ◆ (trapped sellers at VAL).
Price closes back inside value. The “entered prior value from above/below” alert fires.
Target: PD POC first. Stop: beyond the sweep’s high or low.
5. Playbook B: Absorption at a level
Idea: aggressive orders hit a level, but price doesn’t move. Someone large is absorbing them.
Price reaches a key level (VWAP ±2σ, PDH or PDL, nPOC).
An Absorption label prints: high volume and strong delta in one direction, but the bar closes against that delta.
Wait for the next bar to confirm by moving away from the level.
Stop: beyond the absorption bar. Target: the next level (VWAP, POC).
6. Playbook C: Stacked zone retest
Idea: strong one-sided aggression creates a zone, and price often reacts when it first comes back.
A stacked buy zone forms on a push up.
Price pulls back into the zone for the first time. This is the retest alert.
Look for delta turning positive or a bullish delta flip inside the zone.
Stop: a close below the zone. When that happens, the zone is mitigated and the idea is invalid.
Reverse everything for sell zones.
7. Let the indicator combine them: Key-level setups
With Key-level setups on, you get a label only when a trigger happens at a level, for example ▲ SWEEP · PD VAL or ▼ ABS · VWAP +2σ. These are your short list.
Set up alerts like this: Create alert → Orderflow Suite Pro → “Any alert() function call”. You’ll get the direction, trigger, level and price in the message.
8. Rules that keep you alive
Trade only 2–3 setups per day, and only at levels you marked before the open.
Don’t fade a strong trend just because one signal printed. If POC SHIFT shows ▲▲▲ (value has moved up several days in a row), prefer longs.
Risk no more than 0.5–1% per trade. Decide your stop before you enter, not after.
Journal every setup with a screenshot. After 30 trades you’ll know which playbook works for you.
9. Honest limitations
TradingView has no real bid/ask data, so delta is estimated from smaller-timeframe bars. It’s a strong guide, not exchange-level order flow.
With “LTF + realtime ticks” on, the live bar can differ from the same bar after a refresh.
The “Track setup outcomes” statistics are signal tracking without costs or slippage. They are not a backtest.
No indicator predicts price. These are tools for reading context, not a trading system that wins on autopilot. Nothing here is financial advice.
Questions? Post them below with a screenshot of your chart and your settings, and I’ll help you read it.