
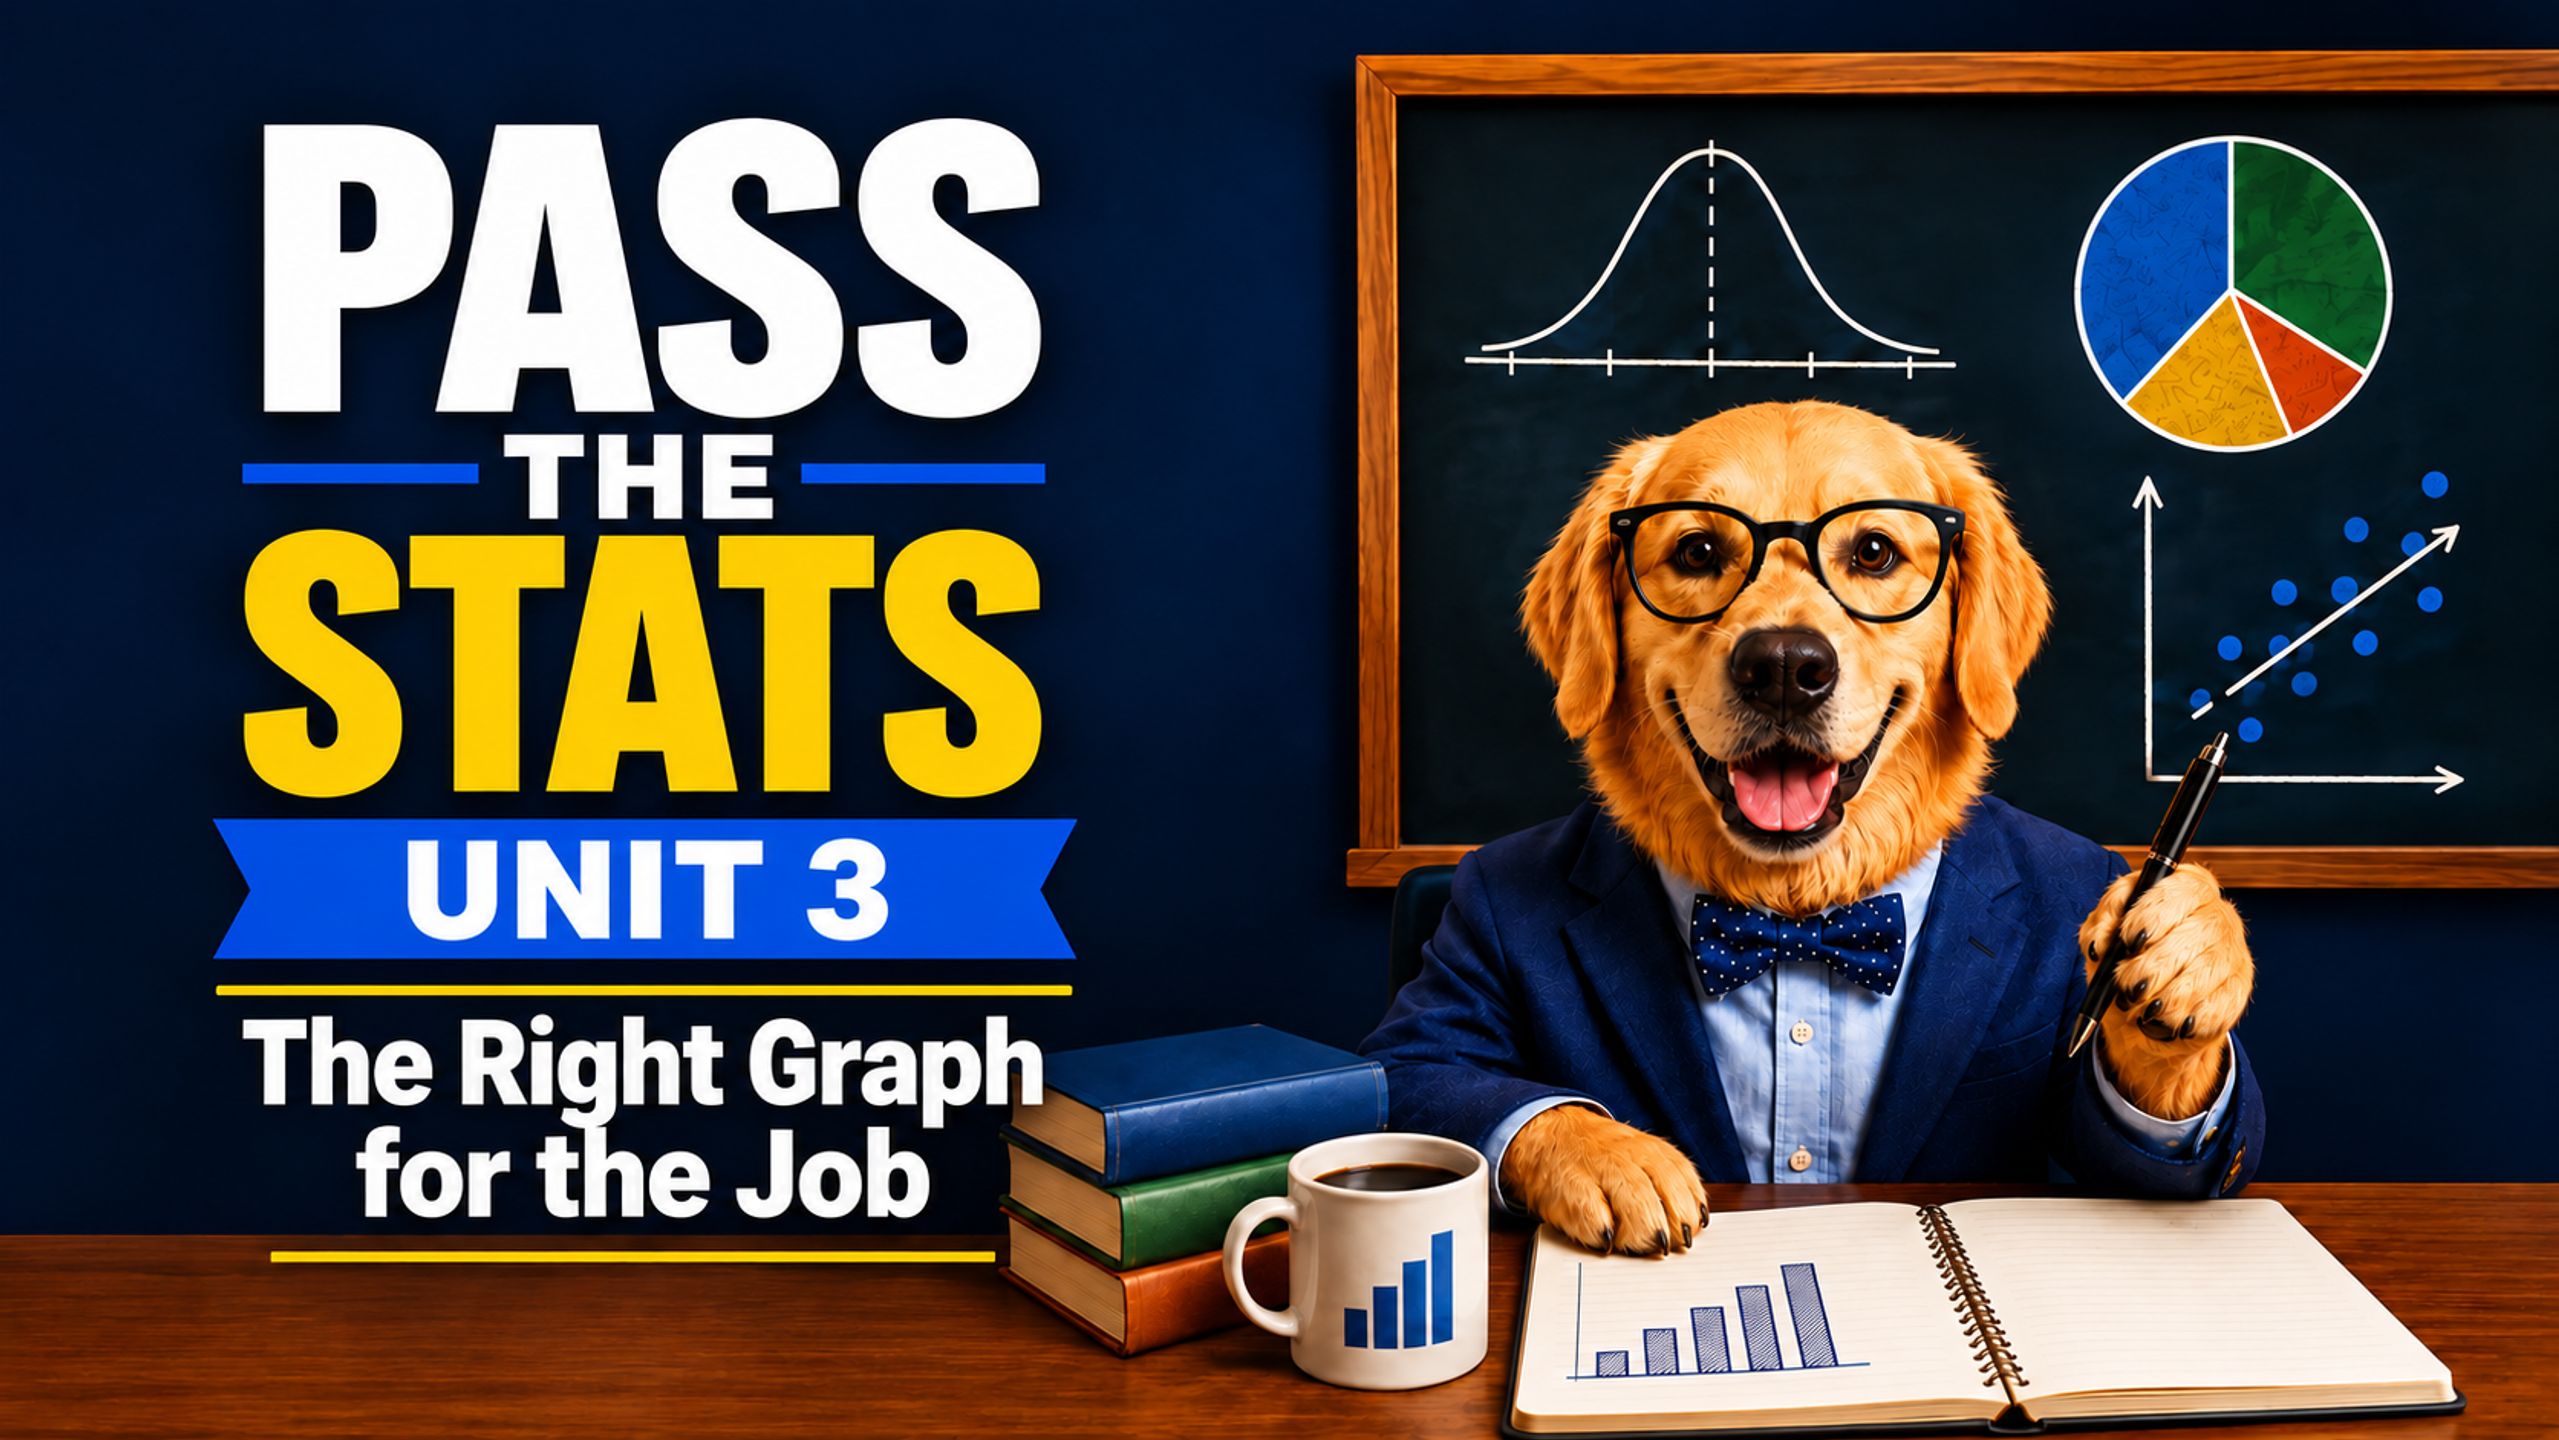
Graphs & Data Displays
Bar Chart or Histogram? Choose the Right Graph Before Your Next Test
Do Graphs and Data Displays Have You Feeling Lost?
Bar graphs, pie charts, histograms, line graphs. Which one do you use, and what does it tell you? You need explanations that make sense before the next quiz or assignment.
Build Your Understanding and Confidence Before Test Day
Graphs & Data Displays Made Easy helps you match the right graph to the right type of data and explain what you see.
Inside, you’ll get:
• An easy-to-follow workbook with plain-English explanations.
• Help understanding frequency tables and discrete versus continuous data.
• Clear explanations of bar graphs, pie charts, histograms, and line graphs.
• Examples showing how to interpret each display.
• Practice questions with answers and explanations.
Learn at your own pace and review whenever you need another look.
But There’s Something Else We Want You to Have…
When you purchase this lesson, we’ll send you our exclusive Graphs & Data Displays Test Prep FREE!
You’ll receive 15 additional test-style questions with answers and explanations. Practice choosing and reading graphs BEFORE your grade is on the line.
What is it worth to feel prepared and confident? We can’t put a price on that. Get the workbook and video lesson for just $4.97, one payment, and receive this extra test preparation FREE with your purchase.
Get your lesson and claim your FREE Test Prep today. Start practicing now so you can walk into your test feeling confident you’ll succeed!