Dual SMT Indicator by Pogiest
Plotting SMTs & Hidden SMTs in Real-Time.
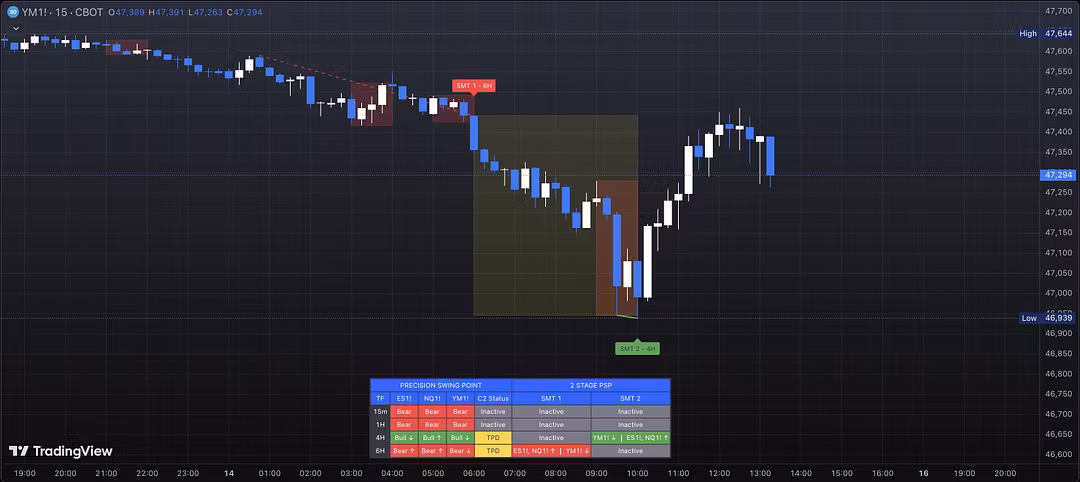
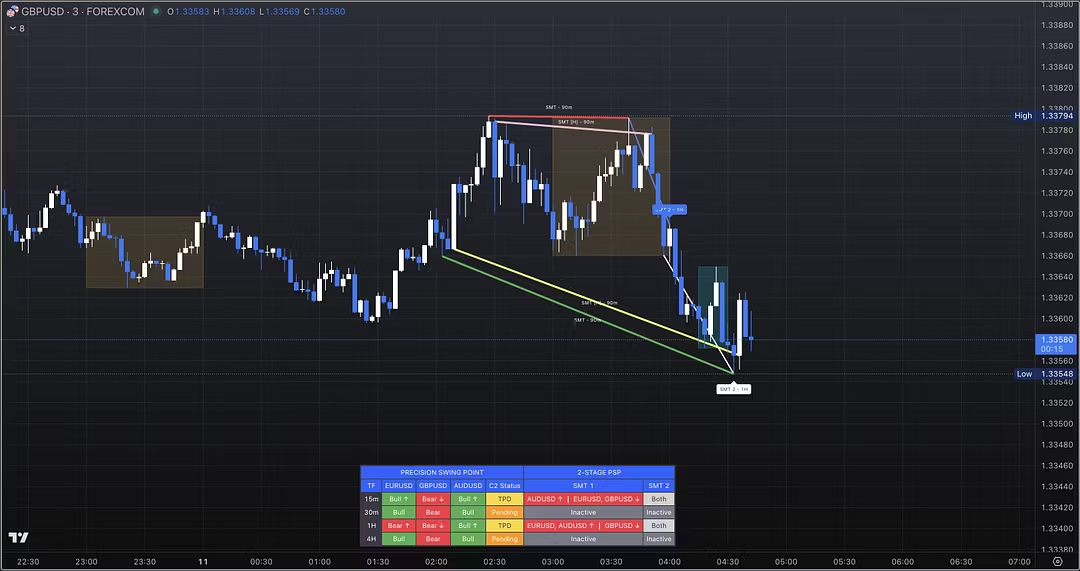
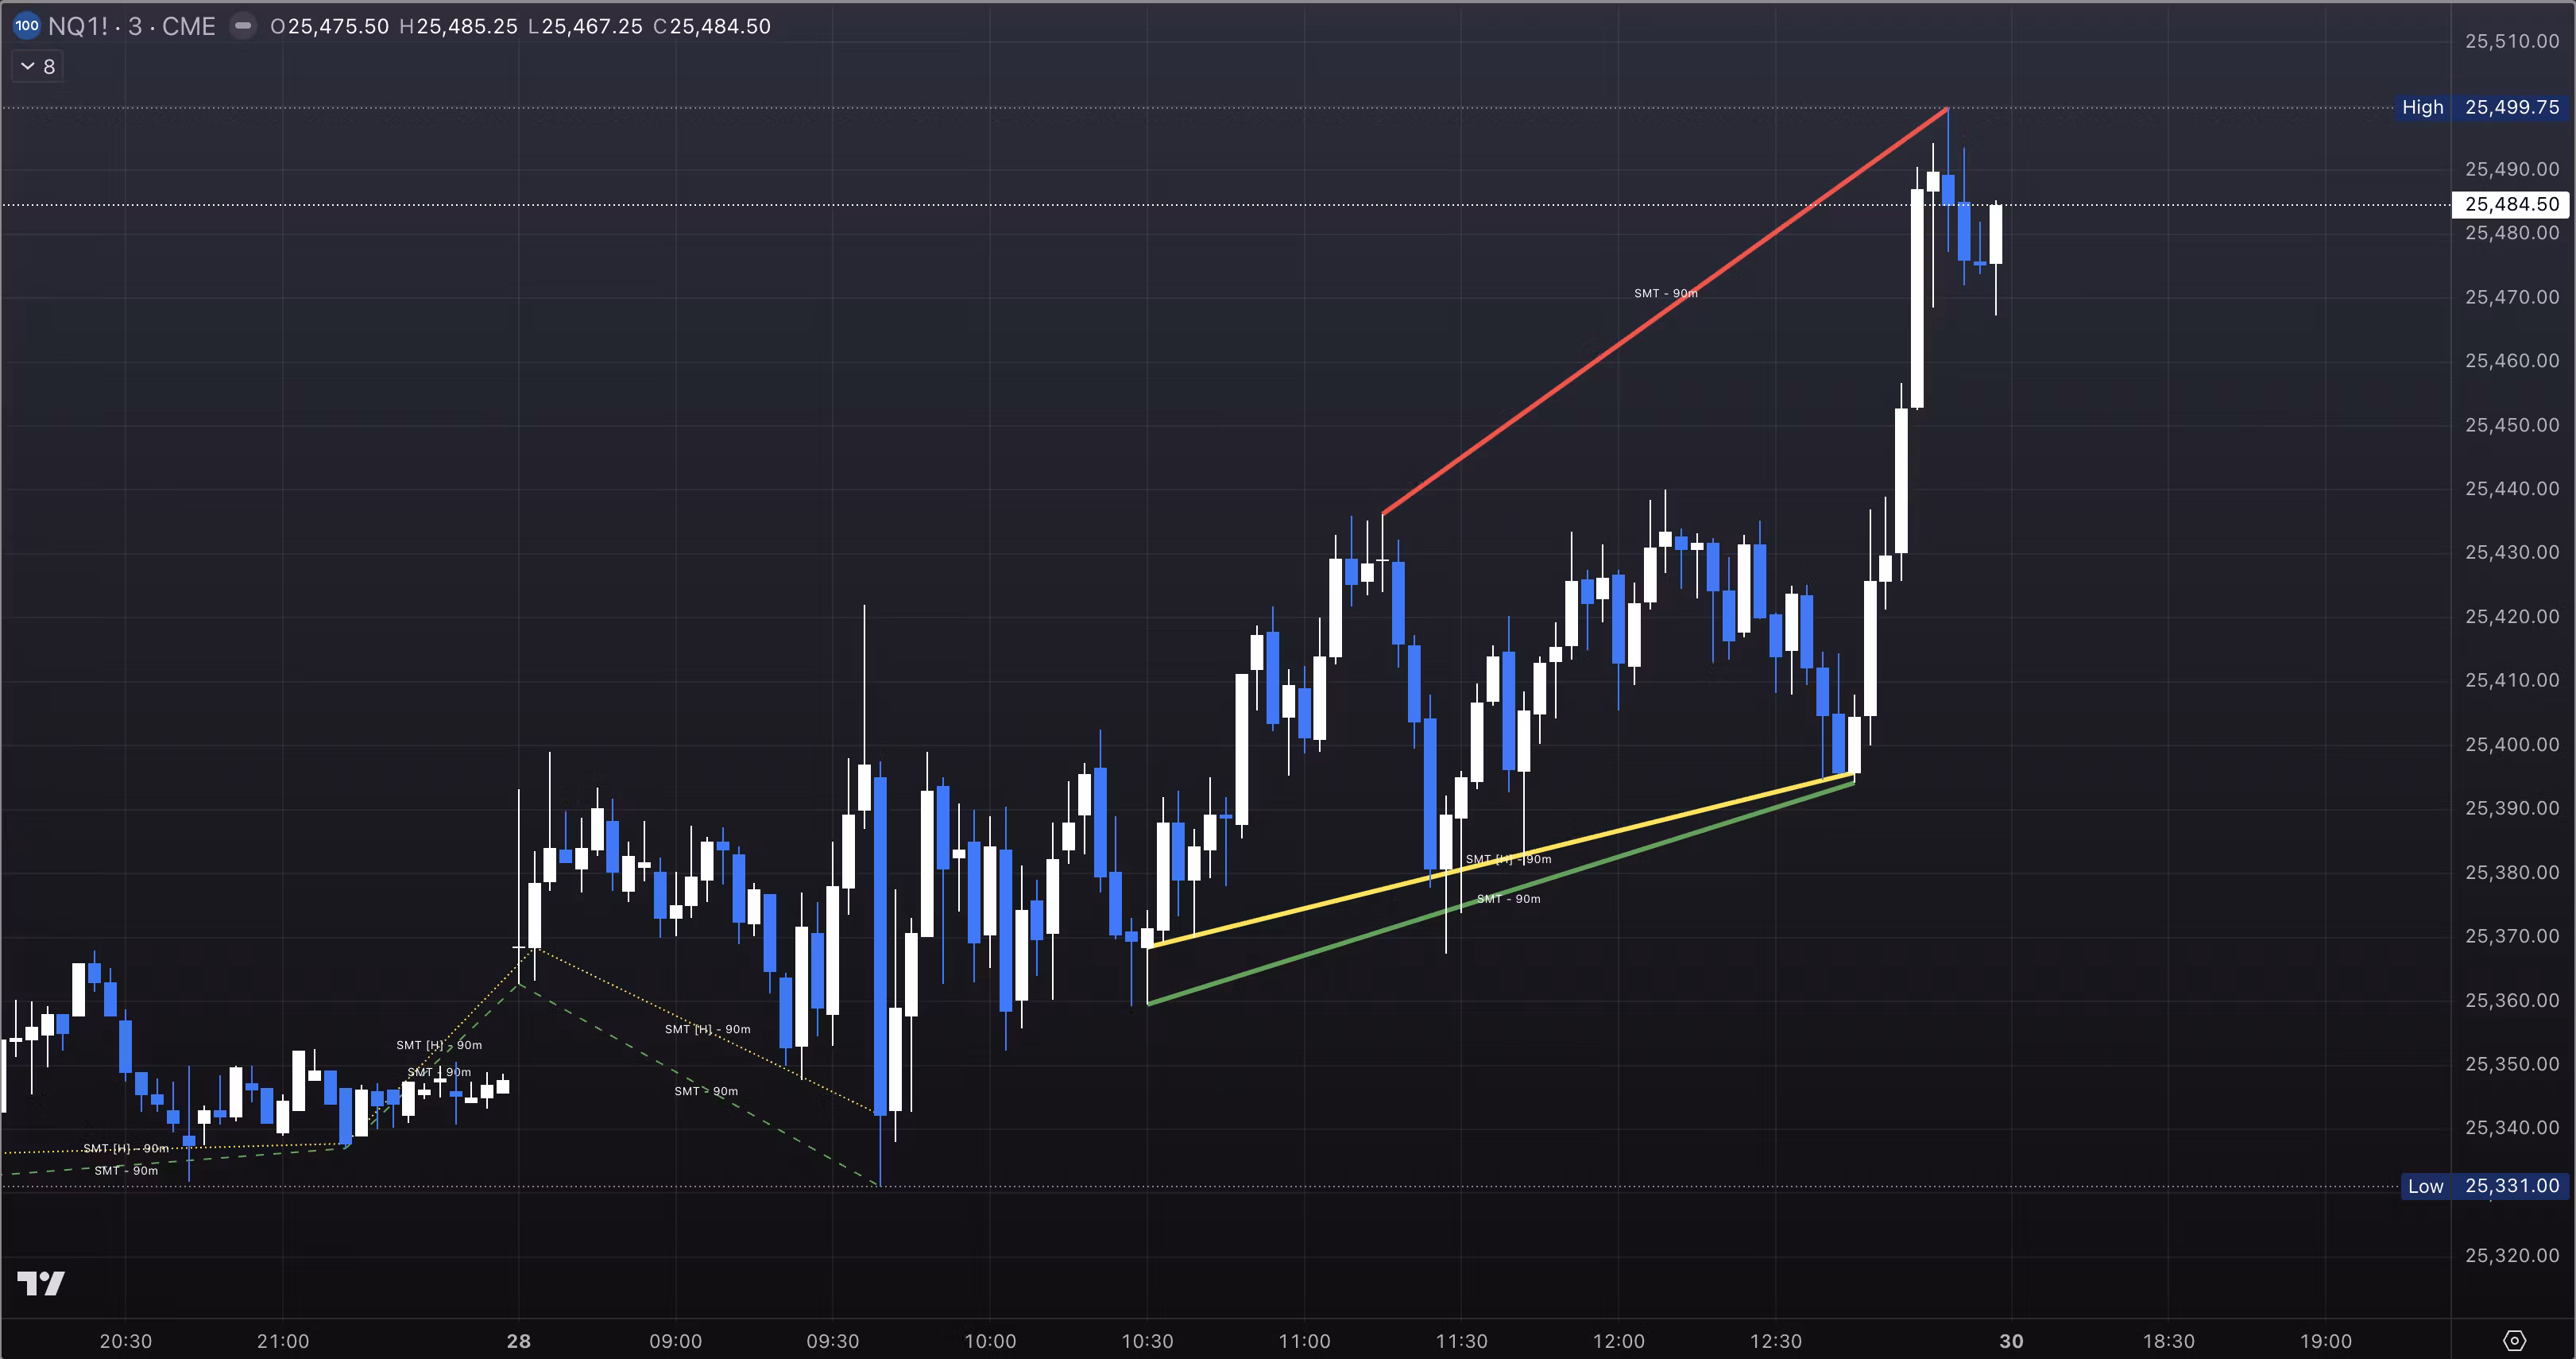
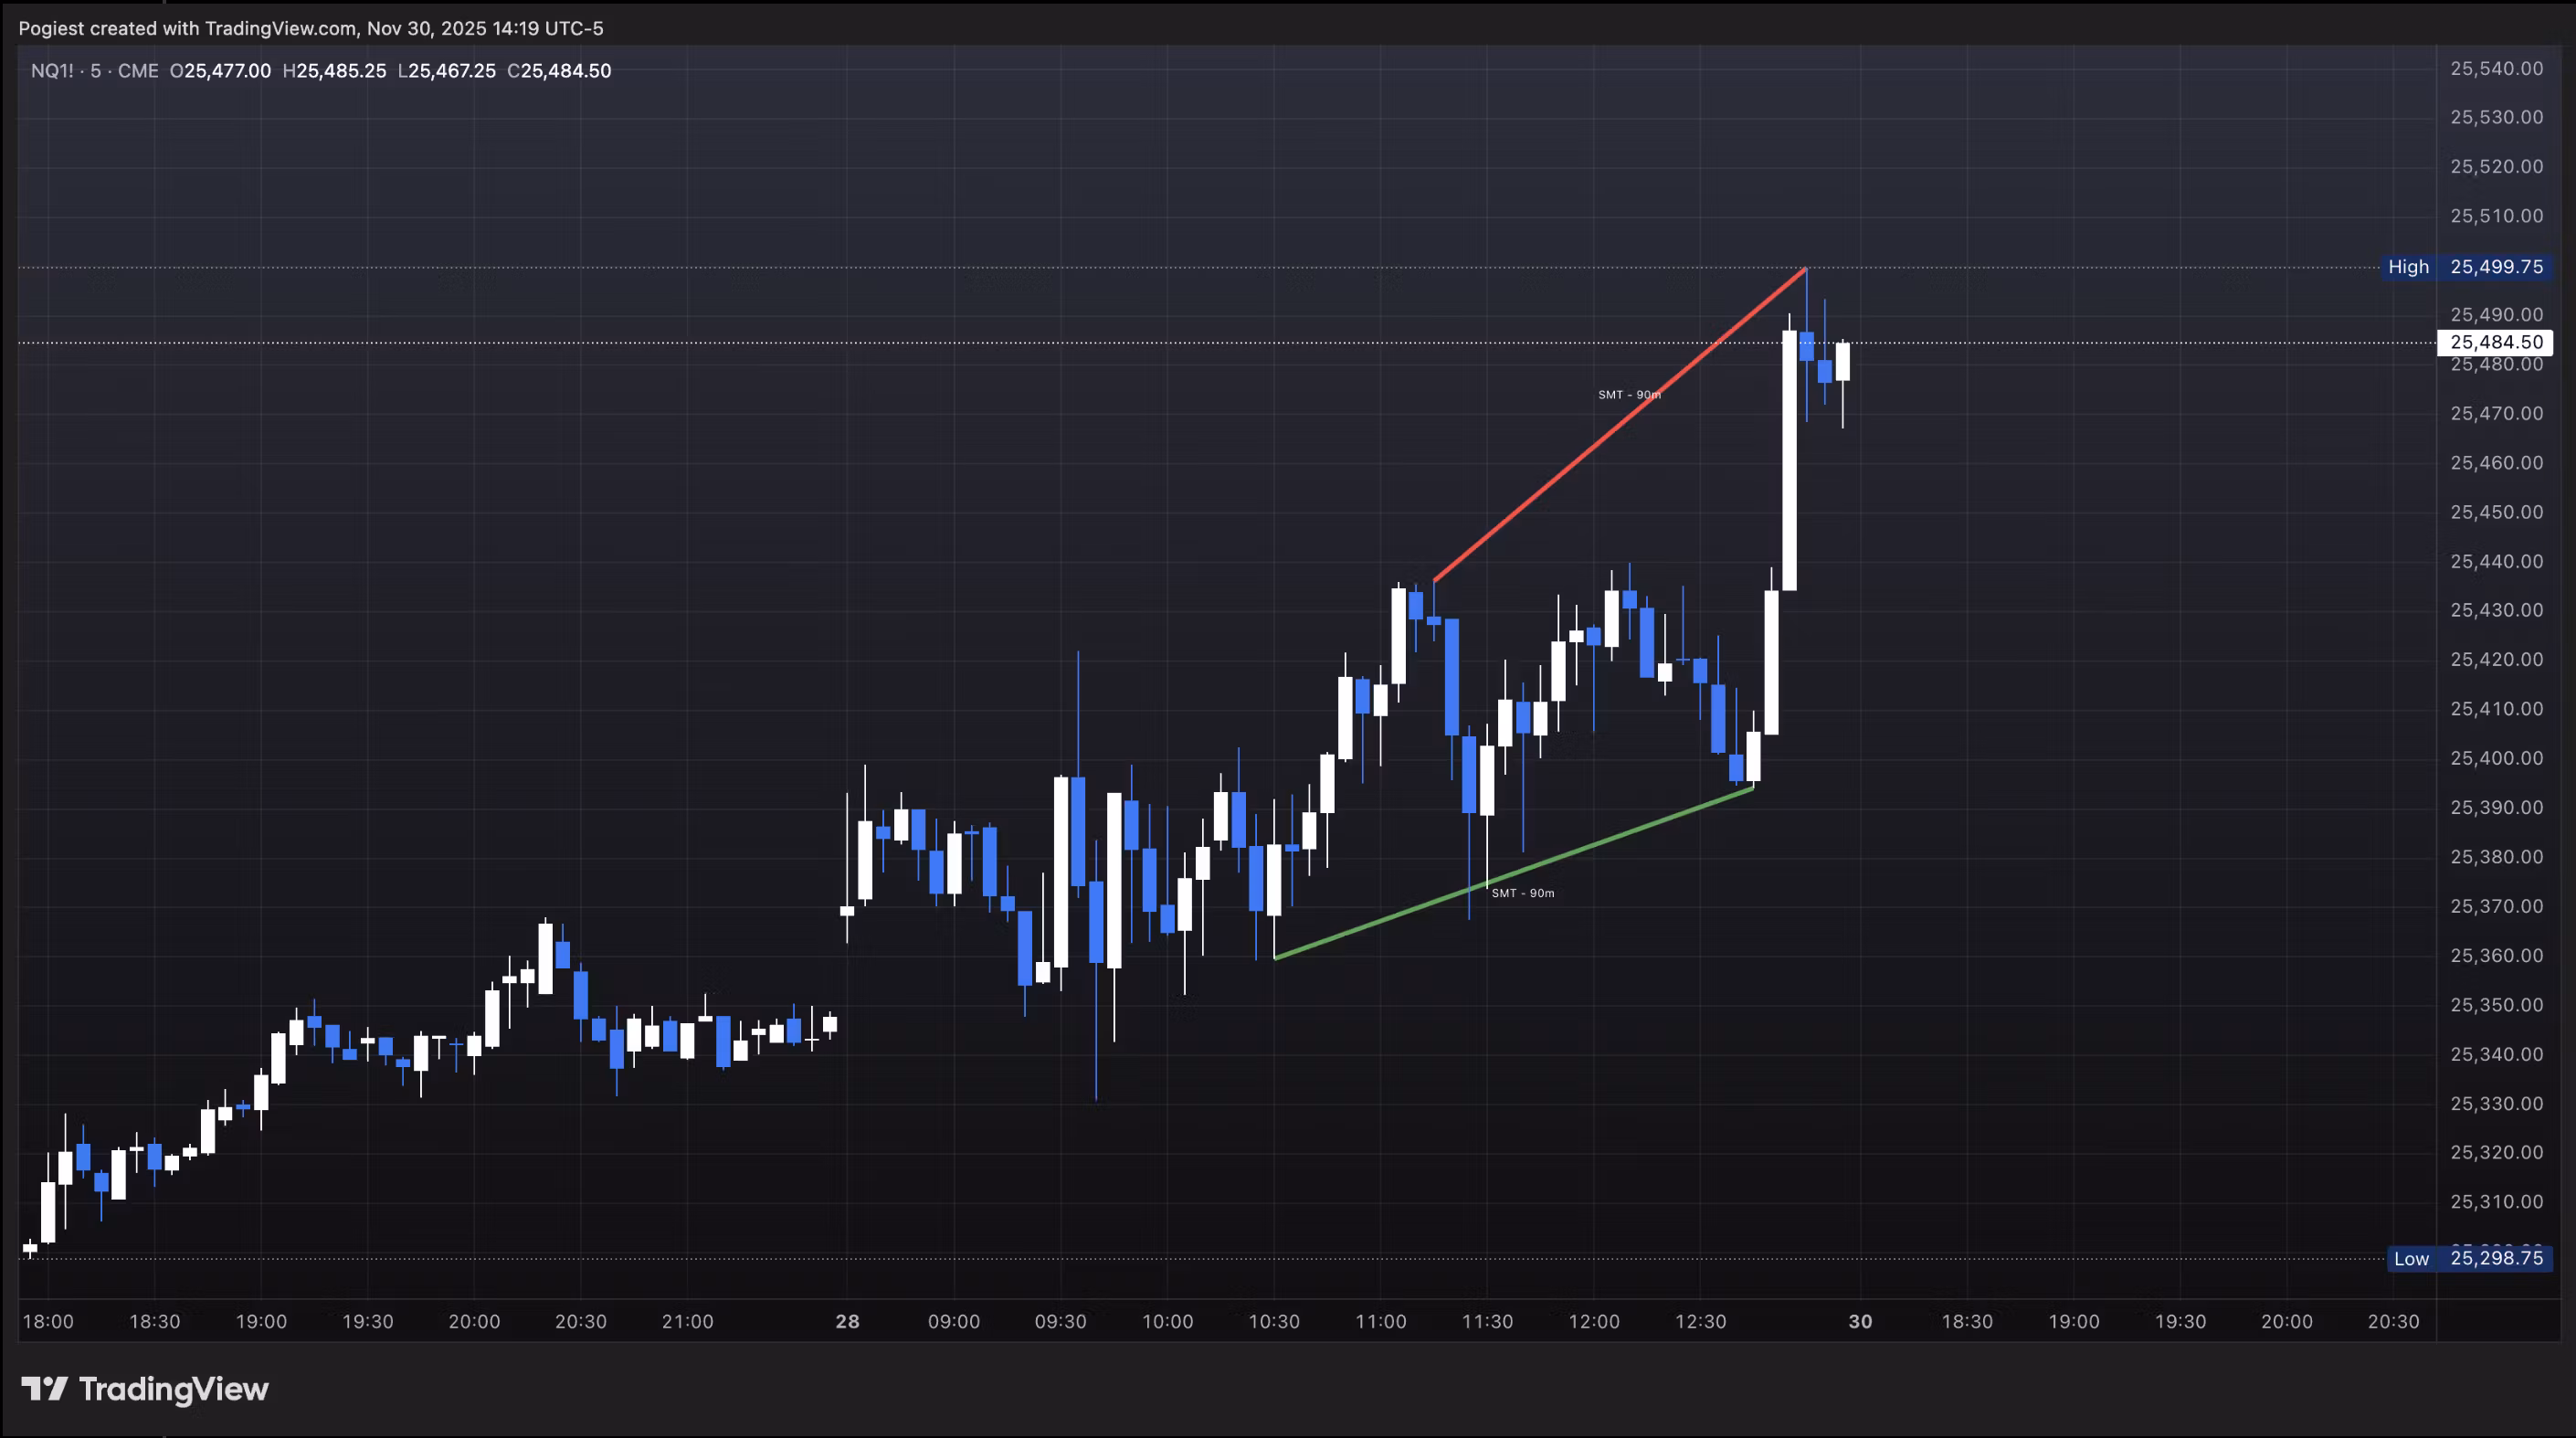
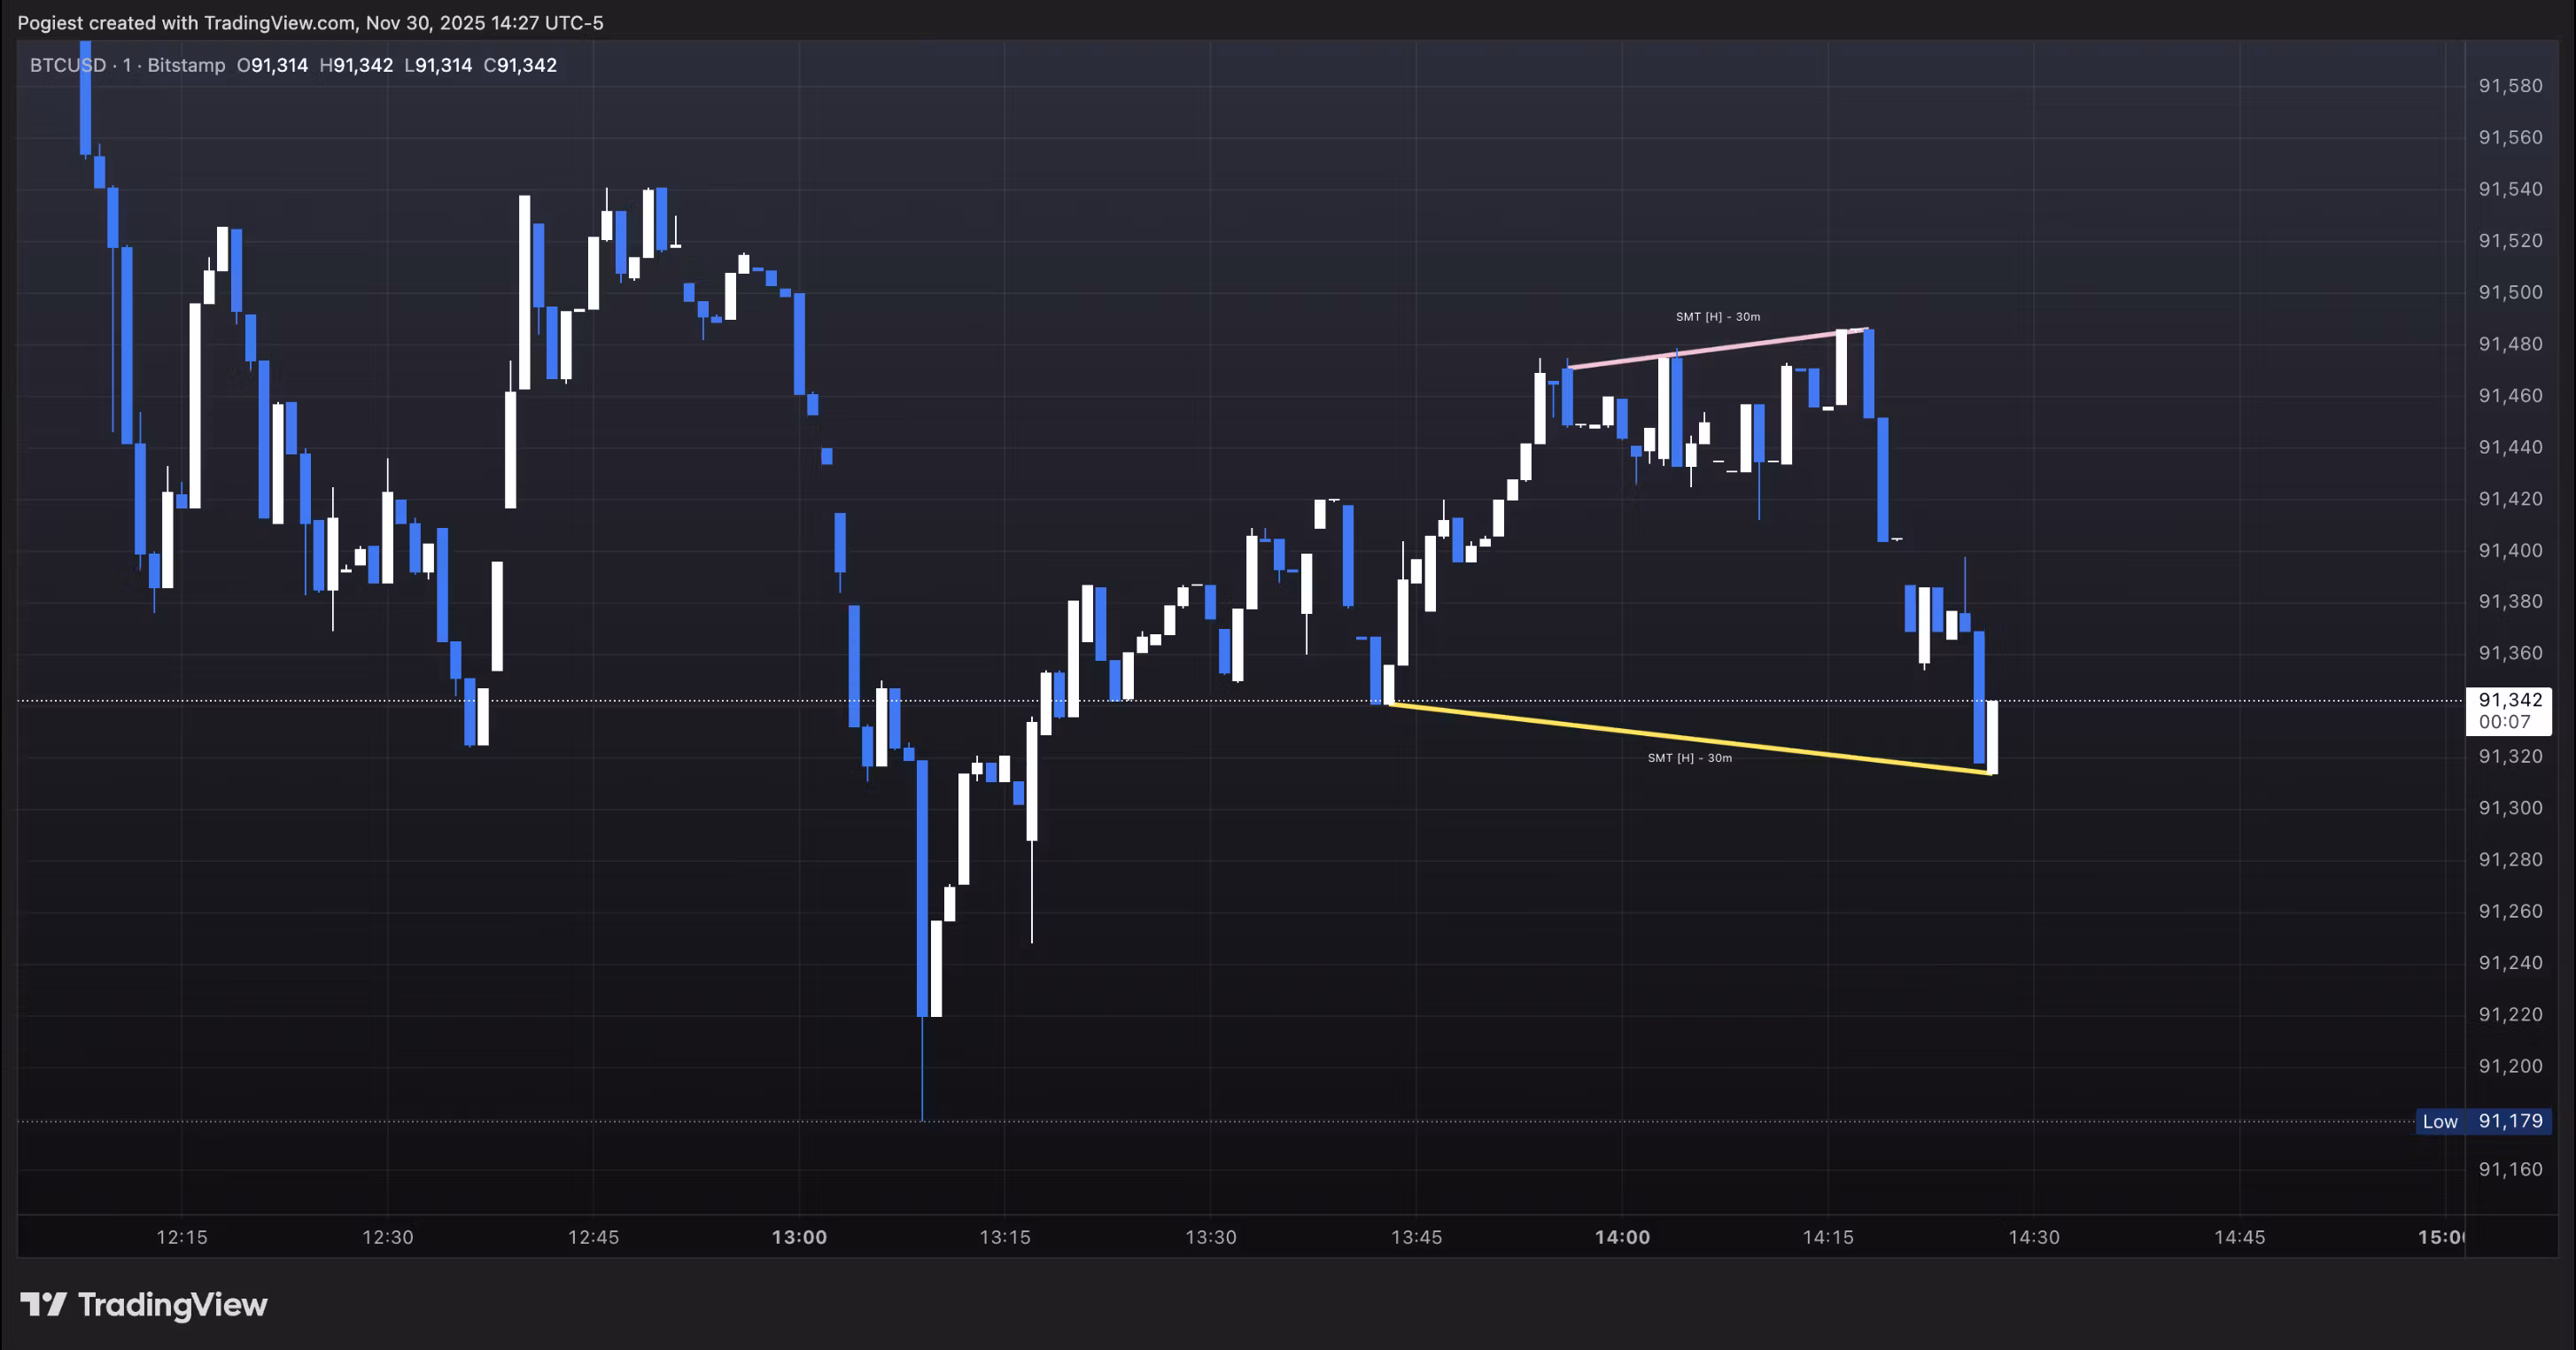
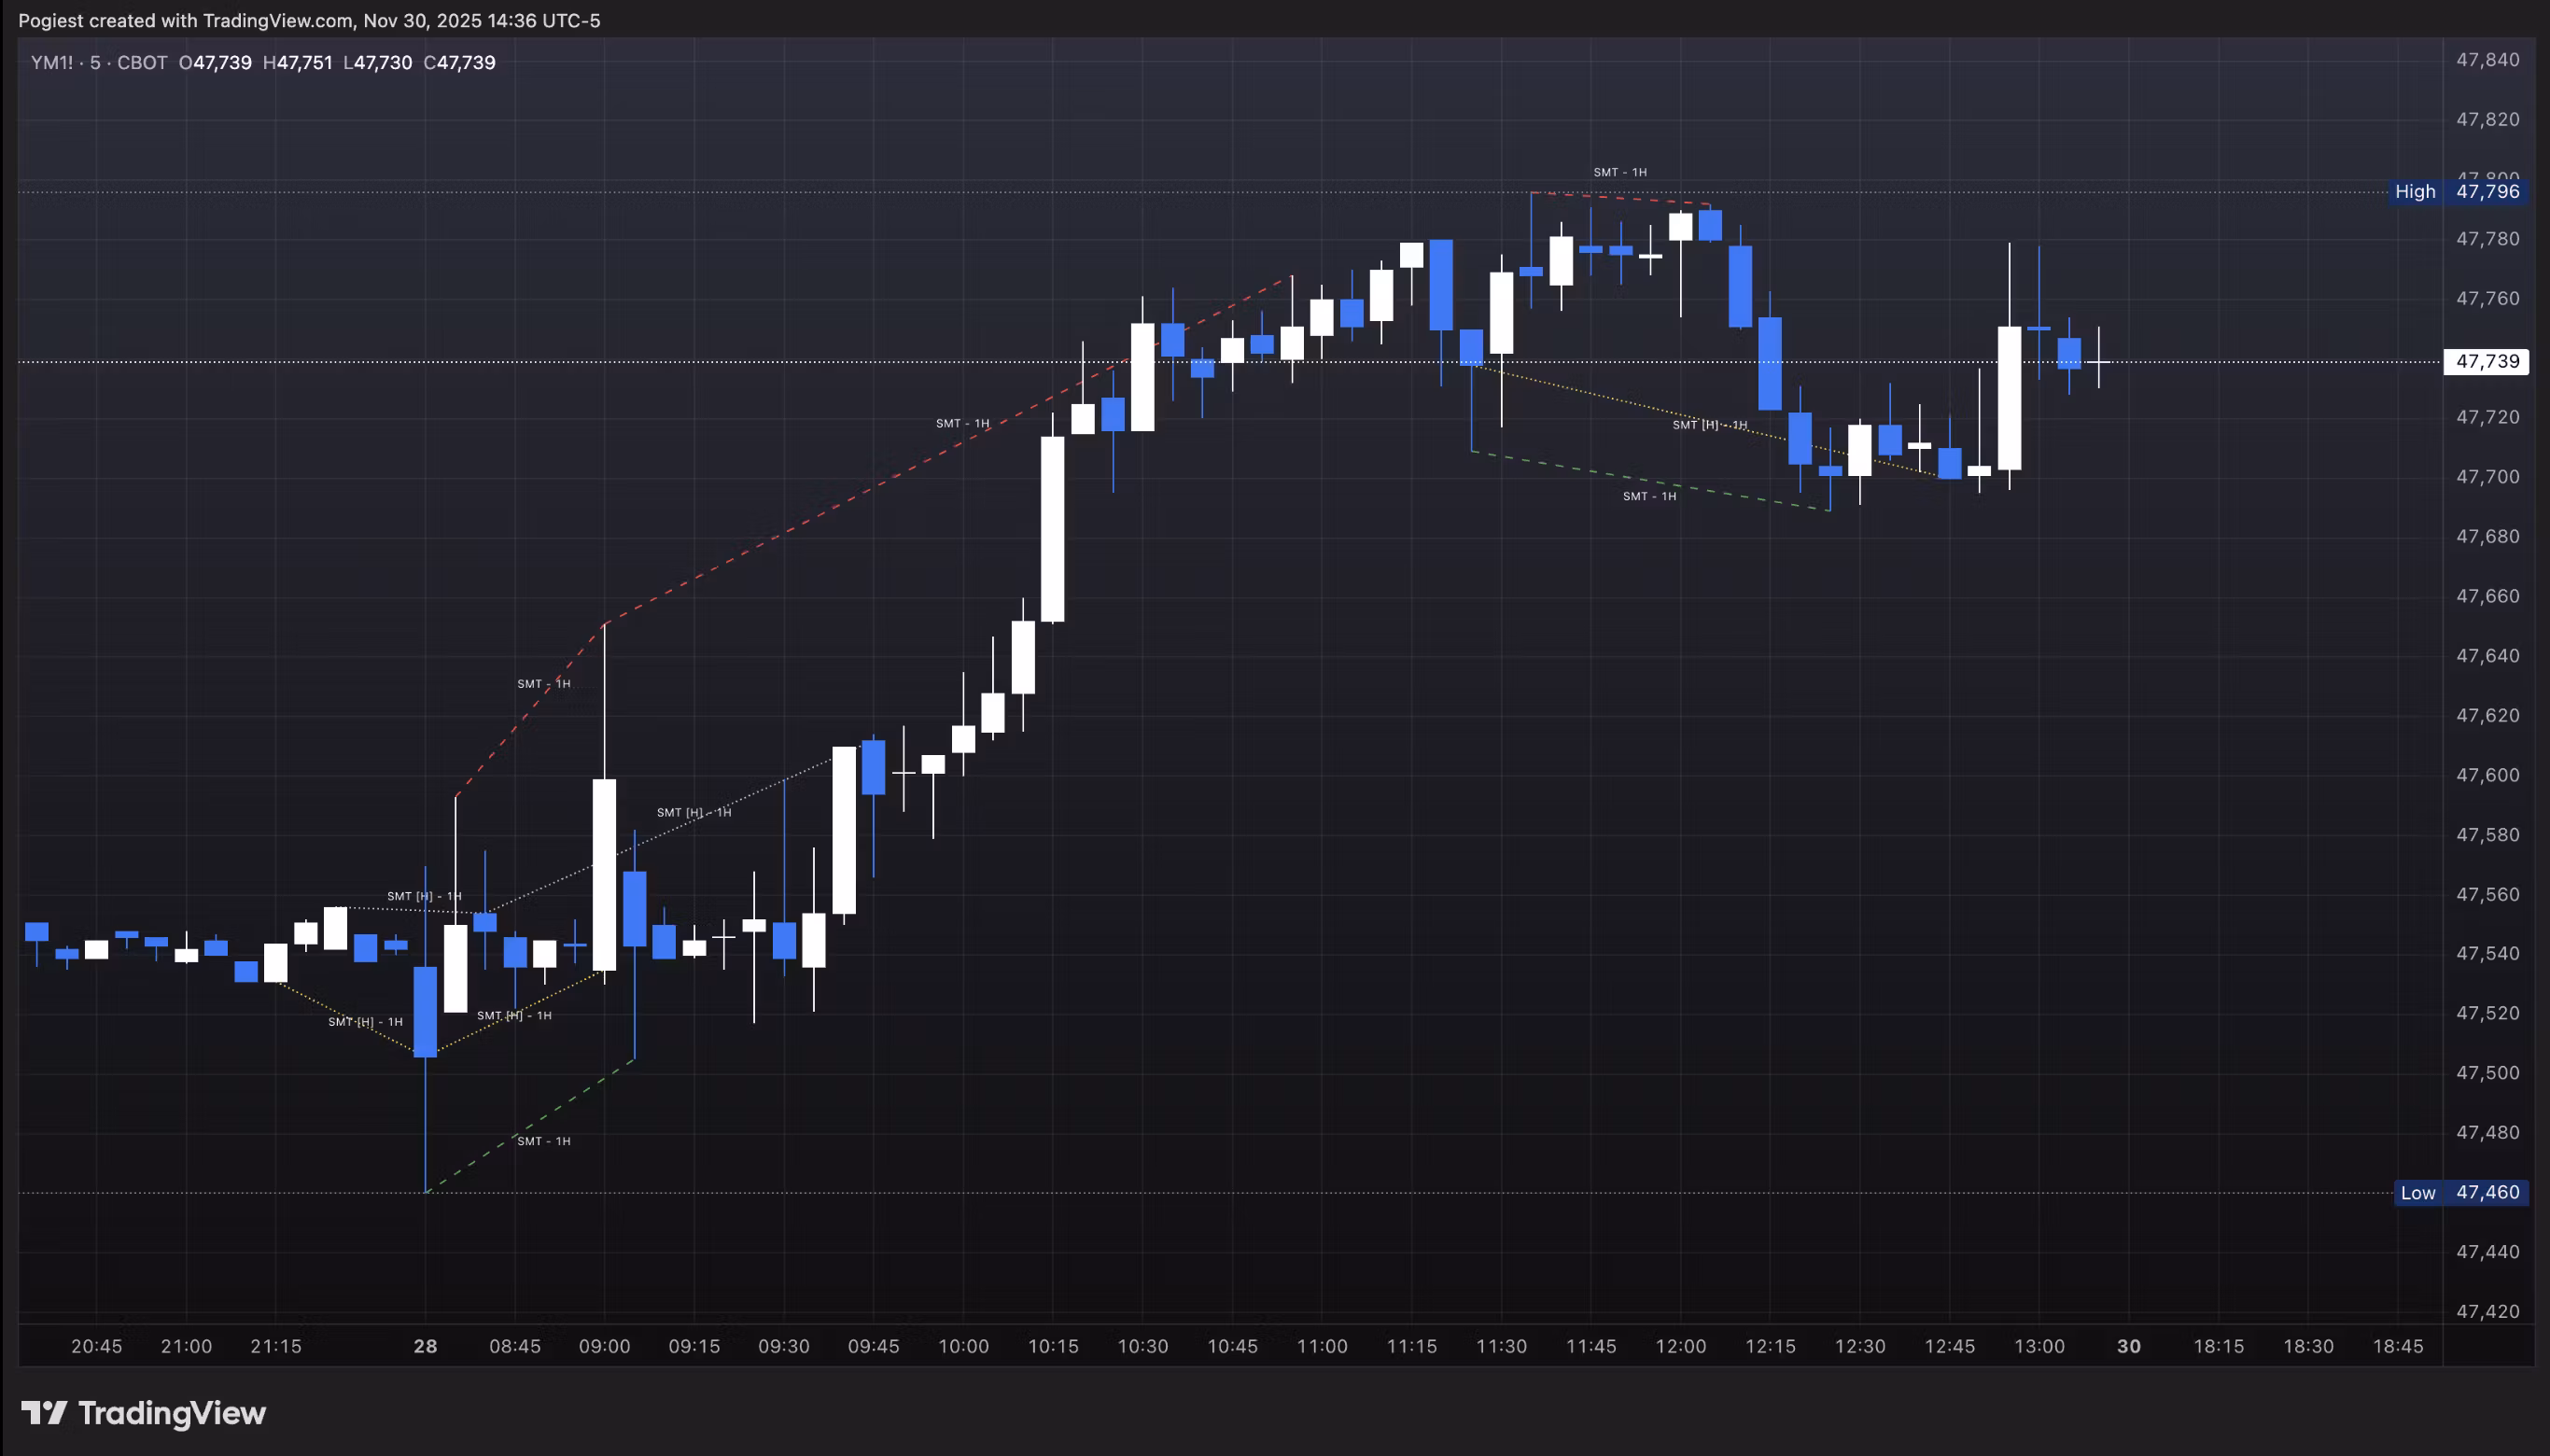
Smart Money Technique (SMT) involves identifying divergences in a correlated asset triad to predict new phases of price, a shift in market sentiment, and also potential trend reversals. An SMT occurs when one or two assets makes a new high or low, but the other asset or assets does not, signaling a potential shift in market direction. A Hidden SMT occurs when one or two assets’ closing price closes higher or lower than the other one or two assets’ closing price. However, with potential gaps in price, an opening price can also be the extreme when comparing assets for divergences. Hidden SMT compares the candle bodies while a Standard SMT compares the highs and lows. Both types of SMTs are considered to be cracks in correlation and can be used to identify potential new phases of price whether it be a reversal, retracement, consolidation, and continuation.
Charts depicted above are from TradingView.
Risk Disclaimer: This indicator is for educational and informational purposes only and does not constitute financial advice. All trading and investment decisions remain solely the responsibility of the user. Trading involves a high degree of risk, and past performance is not indicative of future results. Always conduct your own research and consult with a qualified financial professional before making any trading decisions. By using this indicator, users acknowledge they understand these risks and accept full responsibility for their trading decisions and outcomes.
- 5 months ago