
QANTS Expected Move & Breakeven — TradingView Pine (AR/EN)
Daily and weekly expected-move bands plus optional strike breakevens.
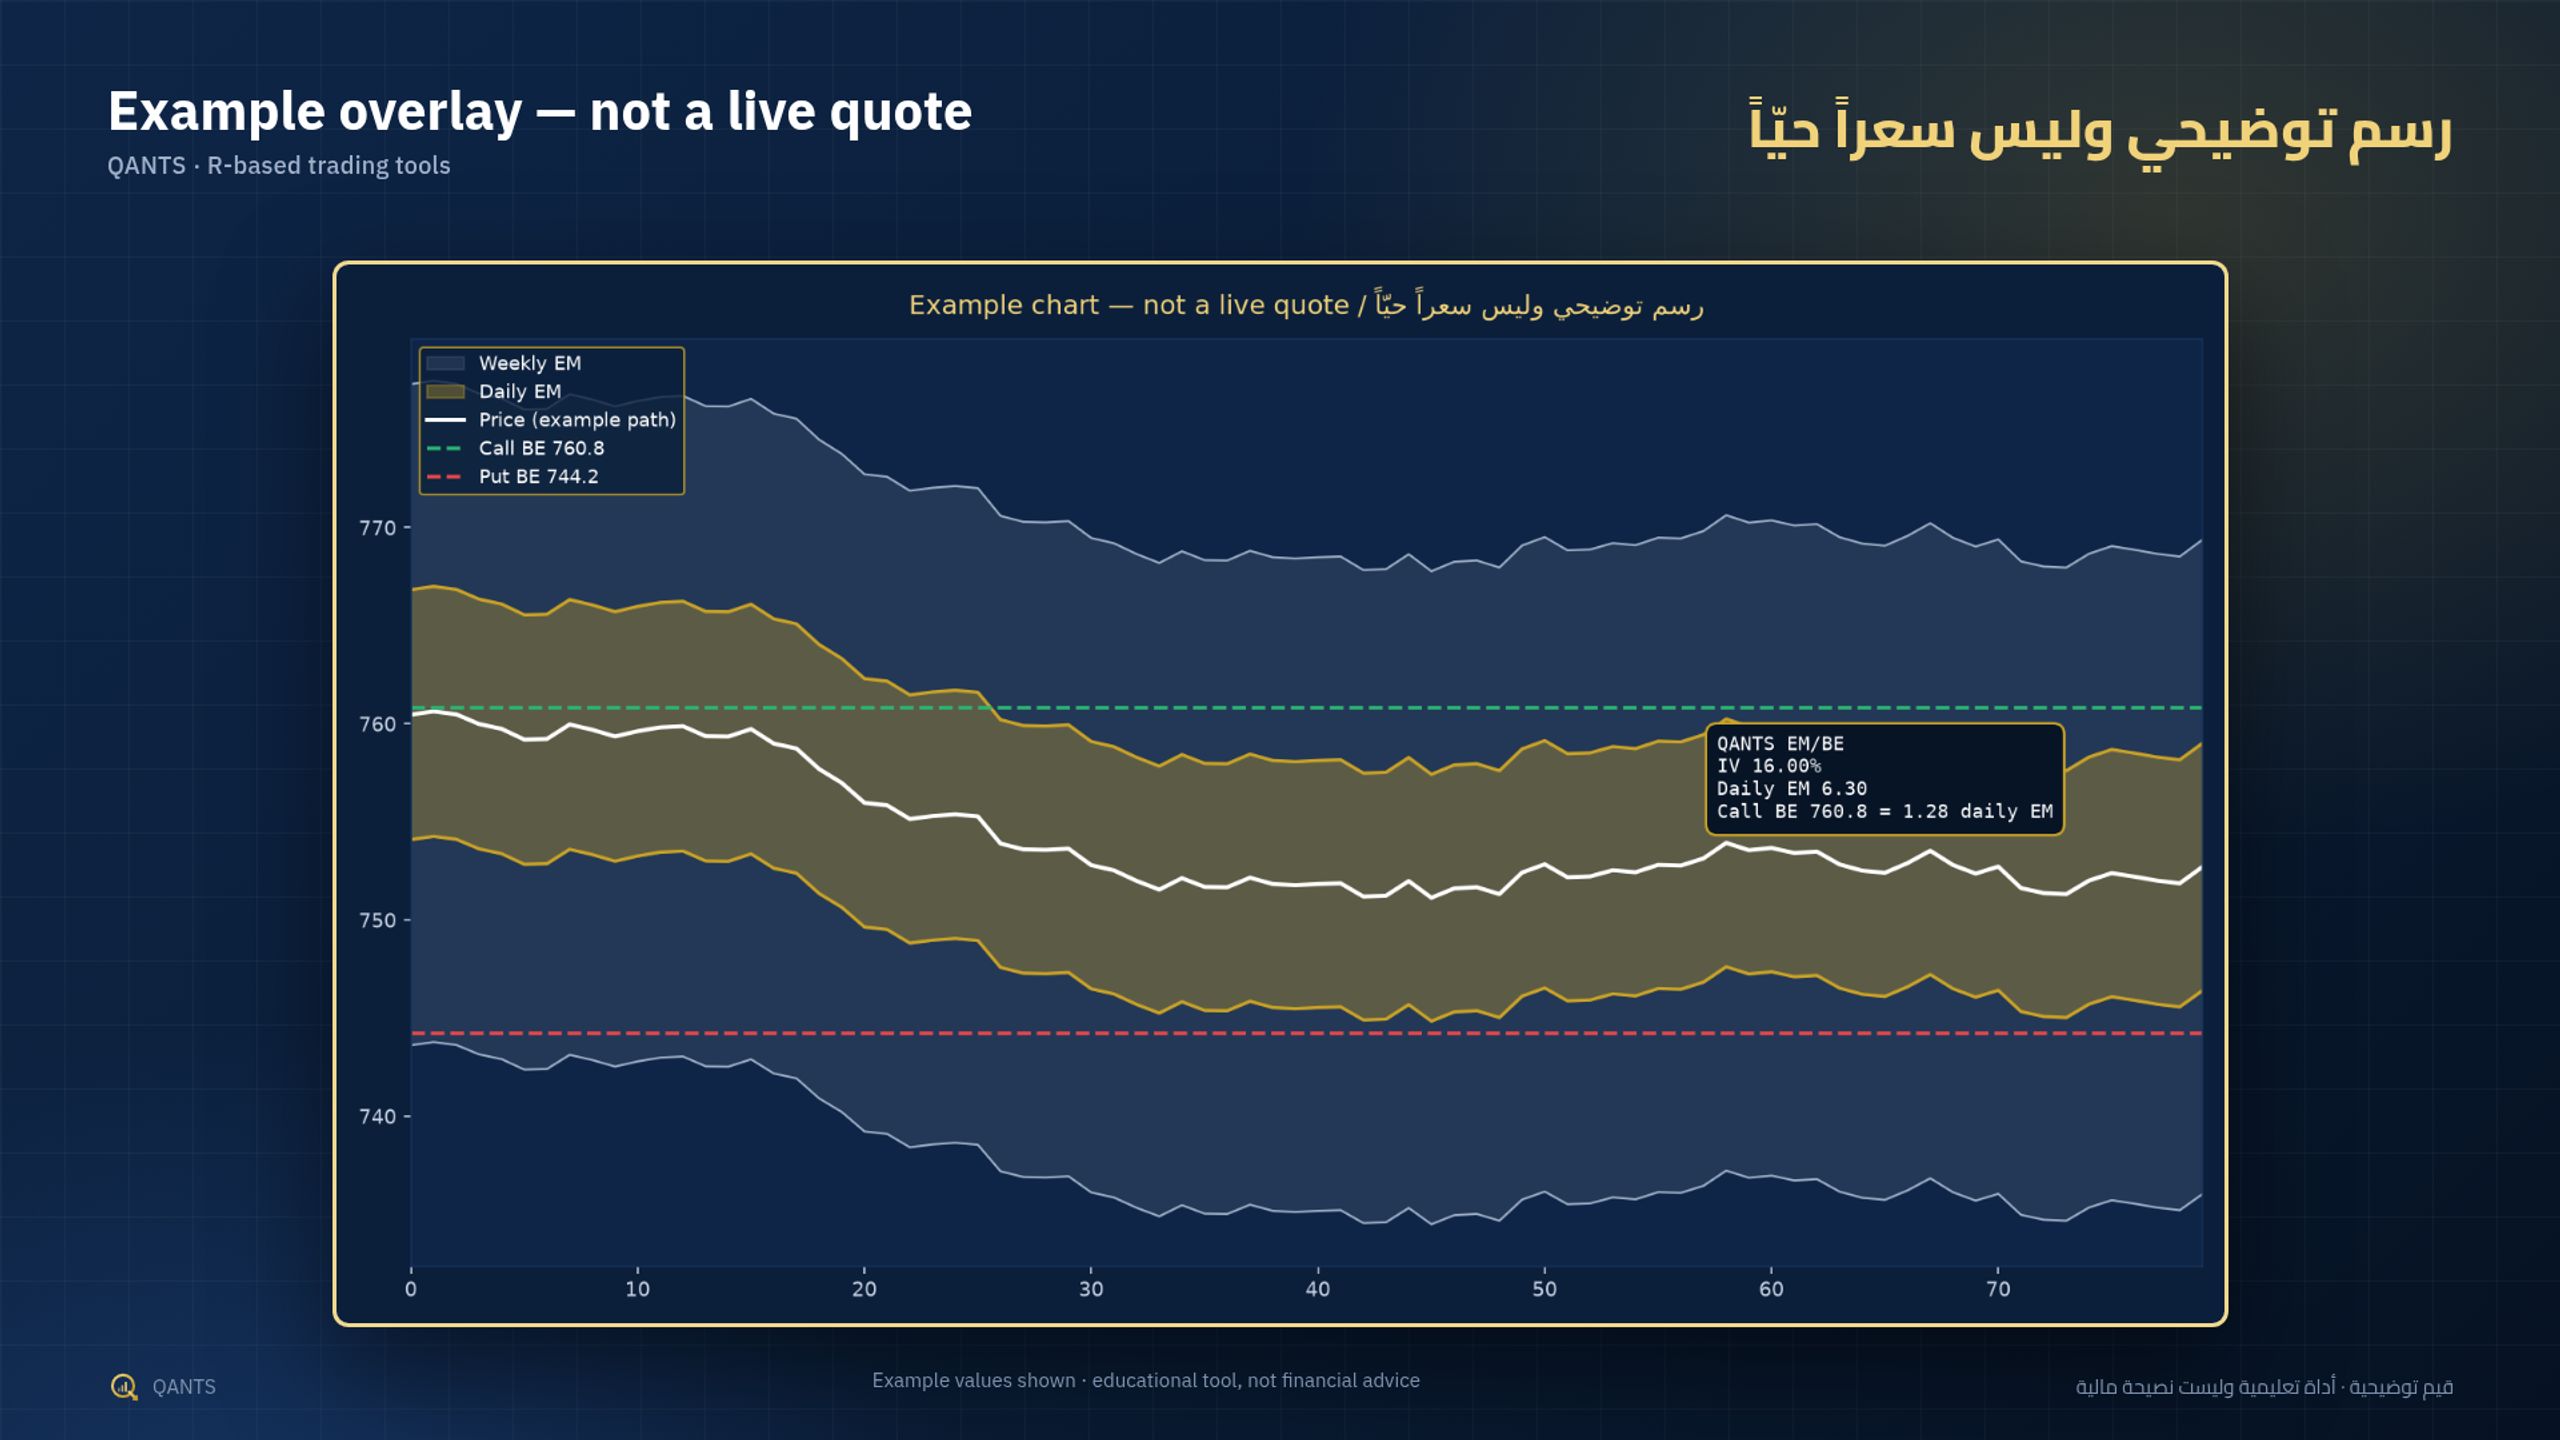
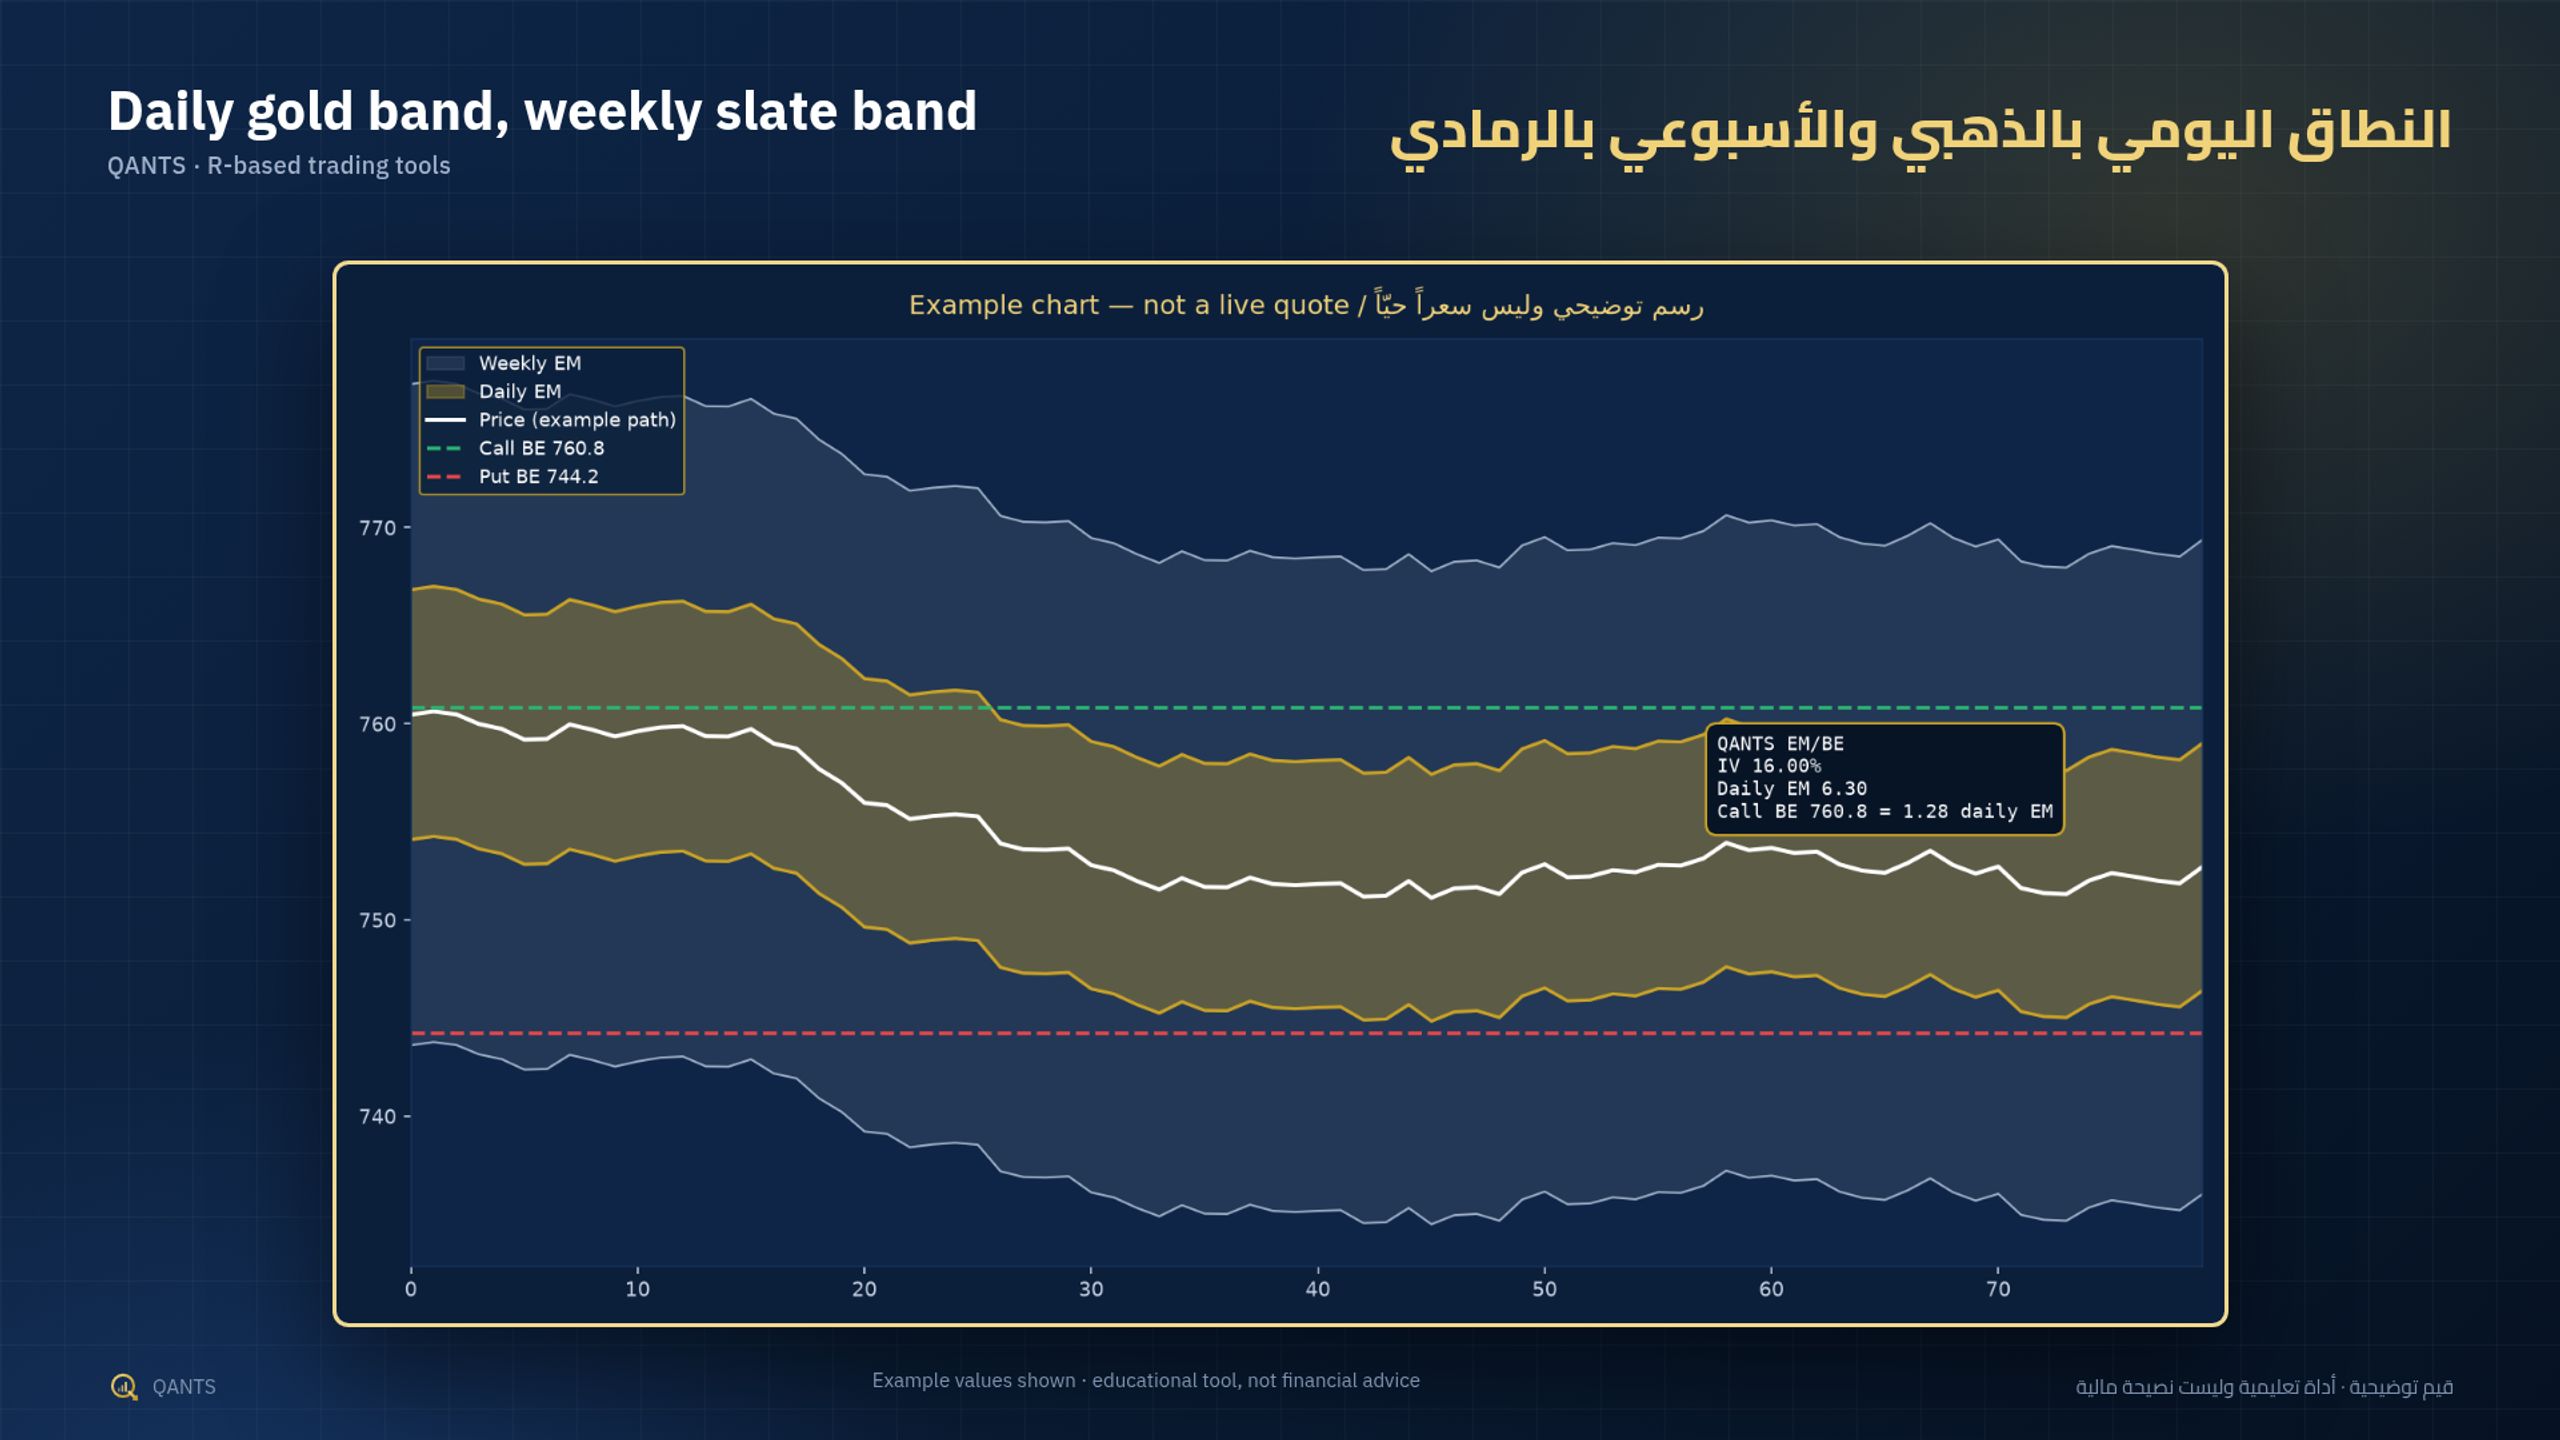
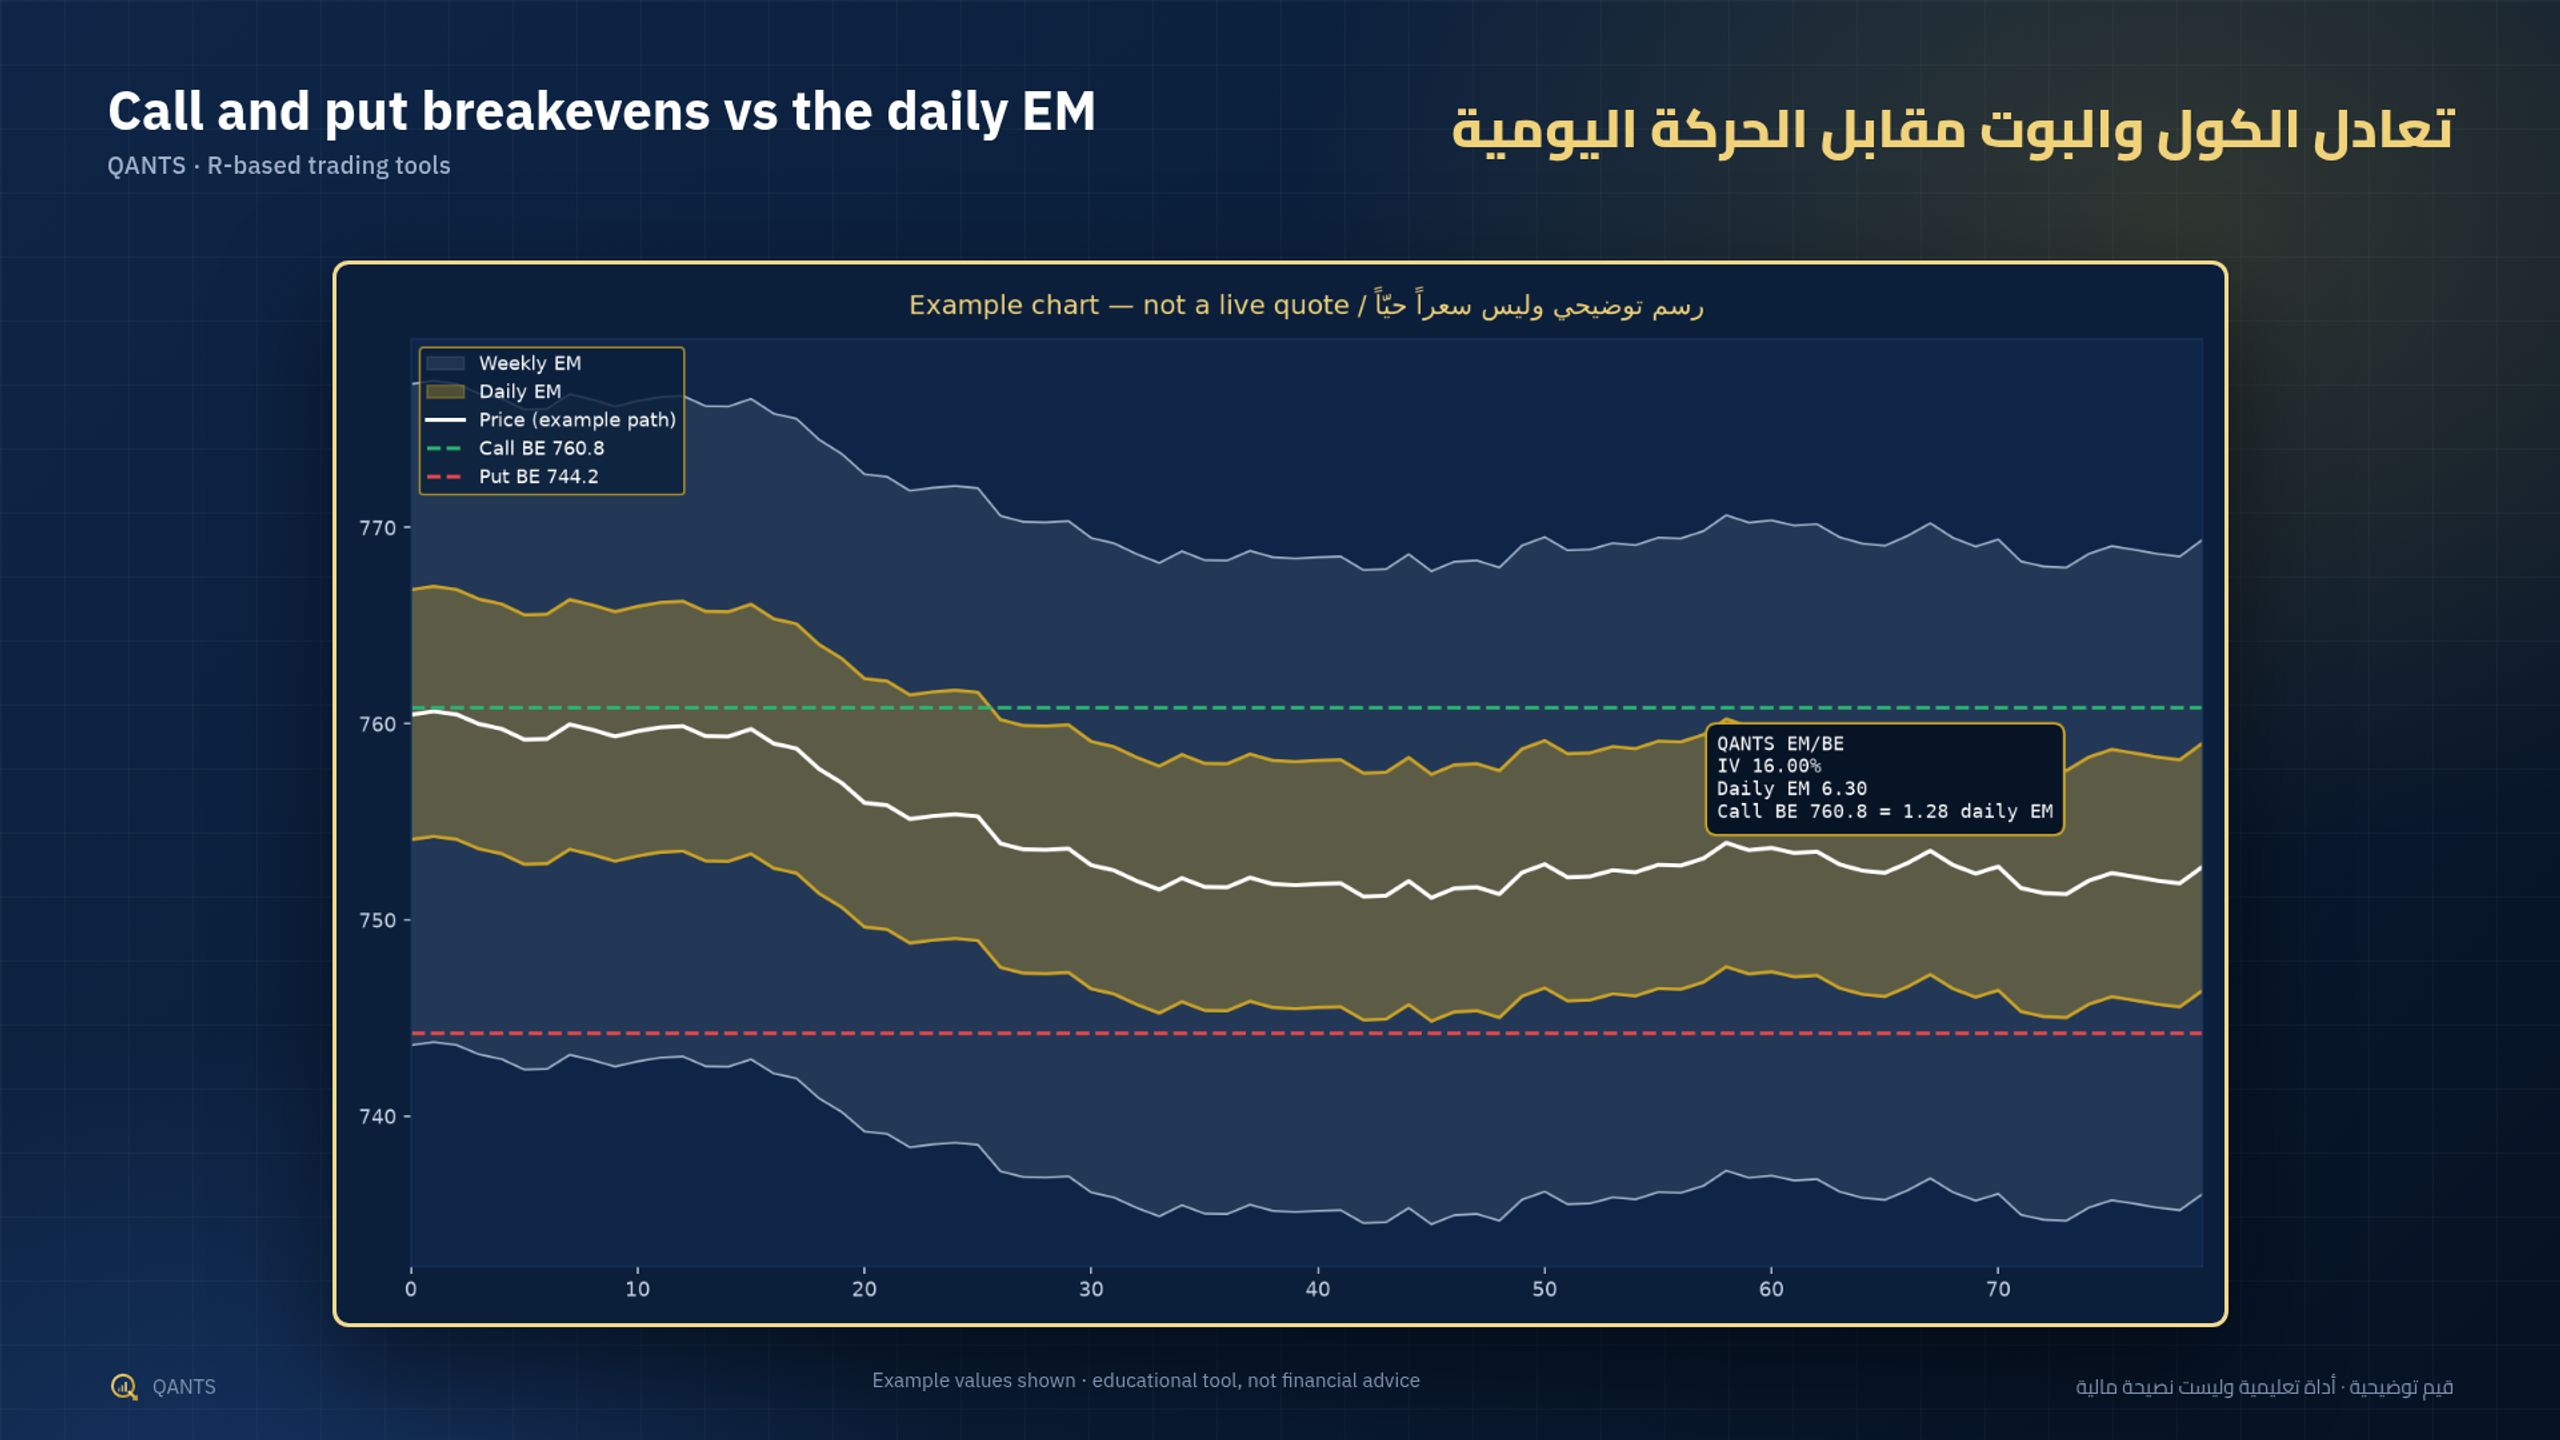
A TradingView Pine v5 overlay that plots daily and weekly expected-move bands from an implied-volatility figure you type (or an optional VIX-based stand-in for SPY). You can also enter a call or put strike and per-share premium to draw the long breakeven and see how many daily expected moves sit between the price and that line.
Formula: EM = S × IV × √(calendar days / 365). Call BE = strike + premium. Put BE = strike − premium. Anchor bands on the close, the session open, or the previous close.
Includes the .pine file plus a bilingual PDF guide and README (Arabic first) with install steps and limits. Works on a free TradingView plan — it is an indicator, not a strategy. There is no TradingView compiler in this package; the script was written conservatively for Pine v5 and reviewed by hand.
مؤشر باين: نطاق يومي وأسبوعي للحركة المتوقعة من تقلب تدخله أنت، مع خطوط اختيارية لتعادل شراء الكول أو البوت ومسافة التعادل بوحدات الحركة اليومية. مع دليل تثبيت بالعربي والإنجليزي.
Disclaimer: Educational charting tool only — not financial advice or a recommendation to buy or sell any option. VIX mode is an approximate 30-day stand-in for SPY/SPX, not the implied volatility of an arbitrary symbol. Trading involves substantial risk of loss.