
R Expectancy & Drawdown Simulator — Excel (AR/EN)
See the drawdowns your strategy can produce before your account does.
A positive expectancy is not enough — risk per trade decides whether you survive the bad streaks.
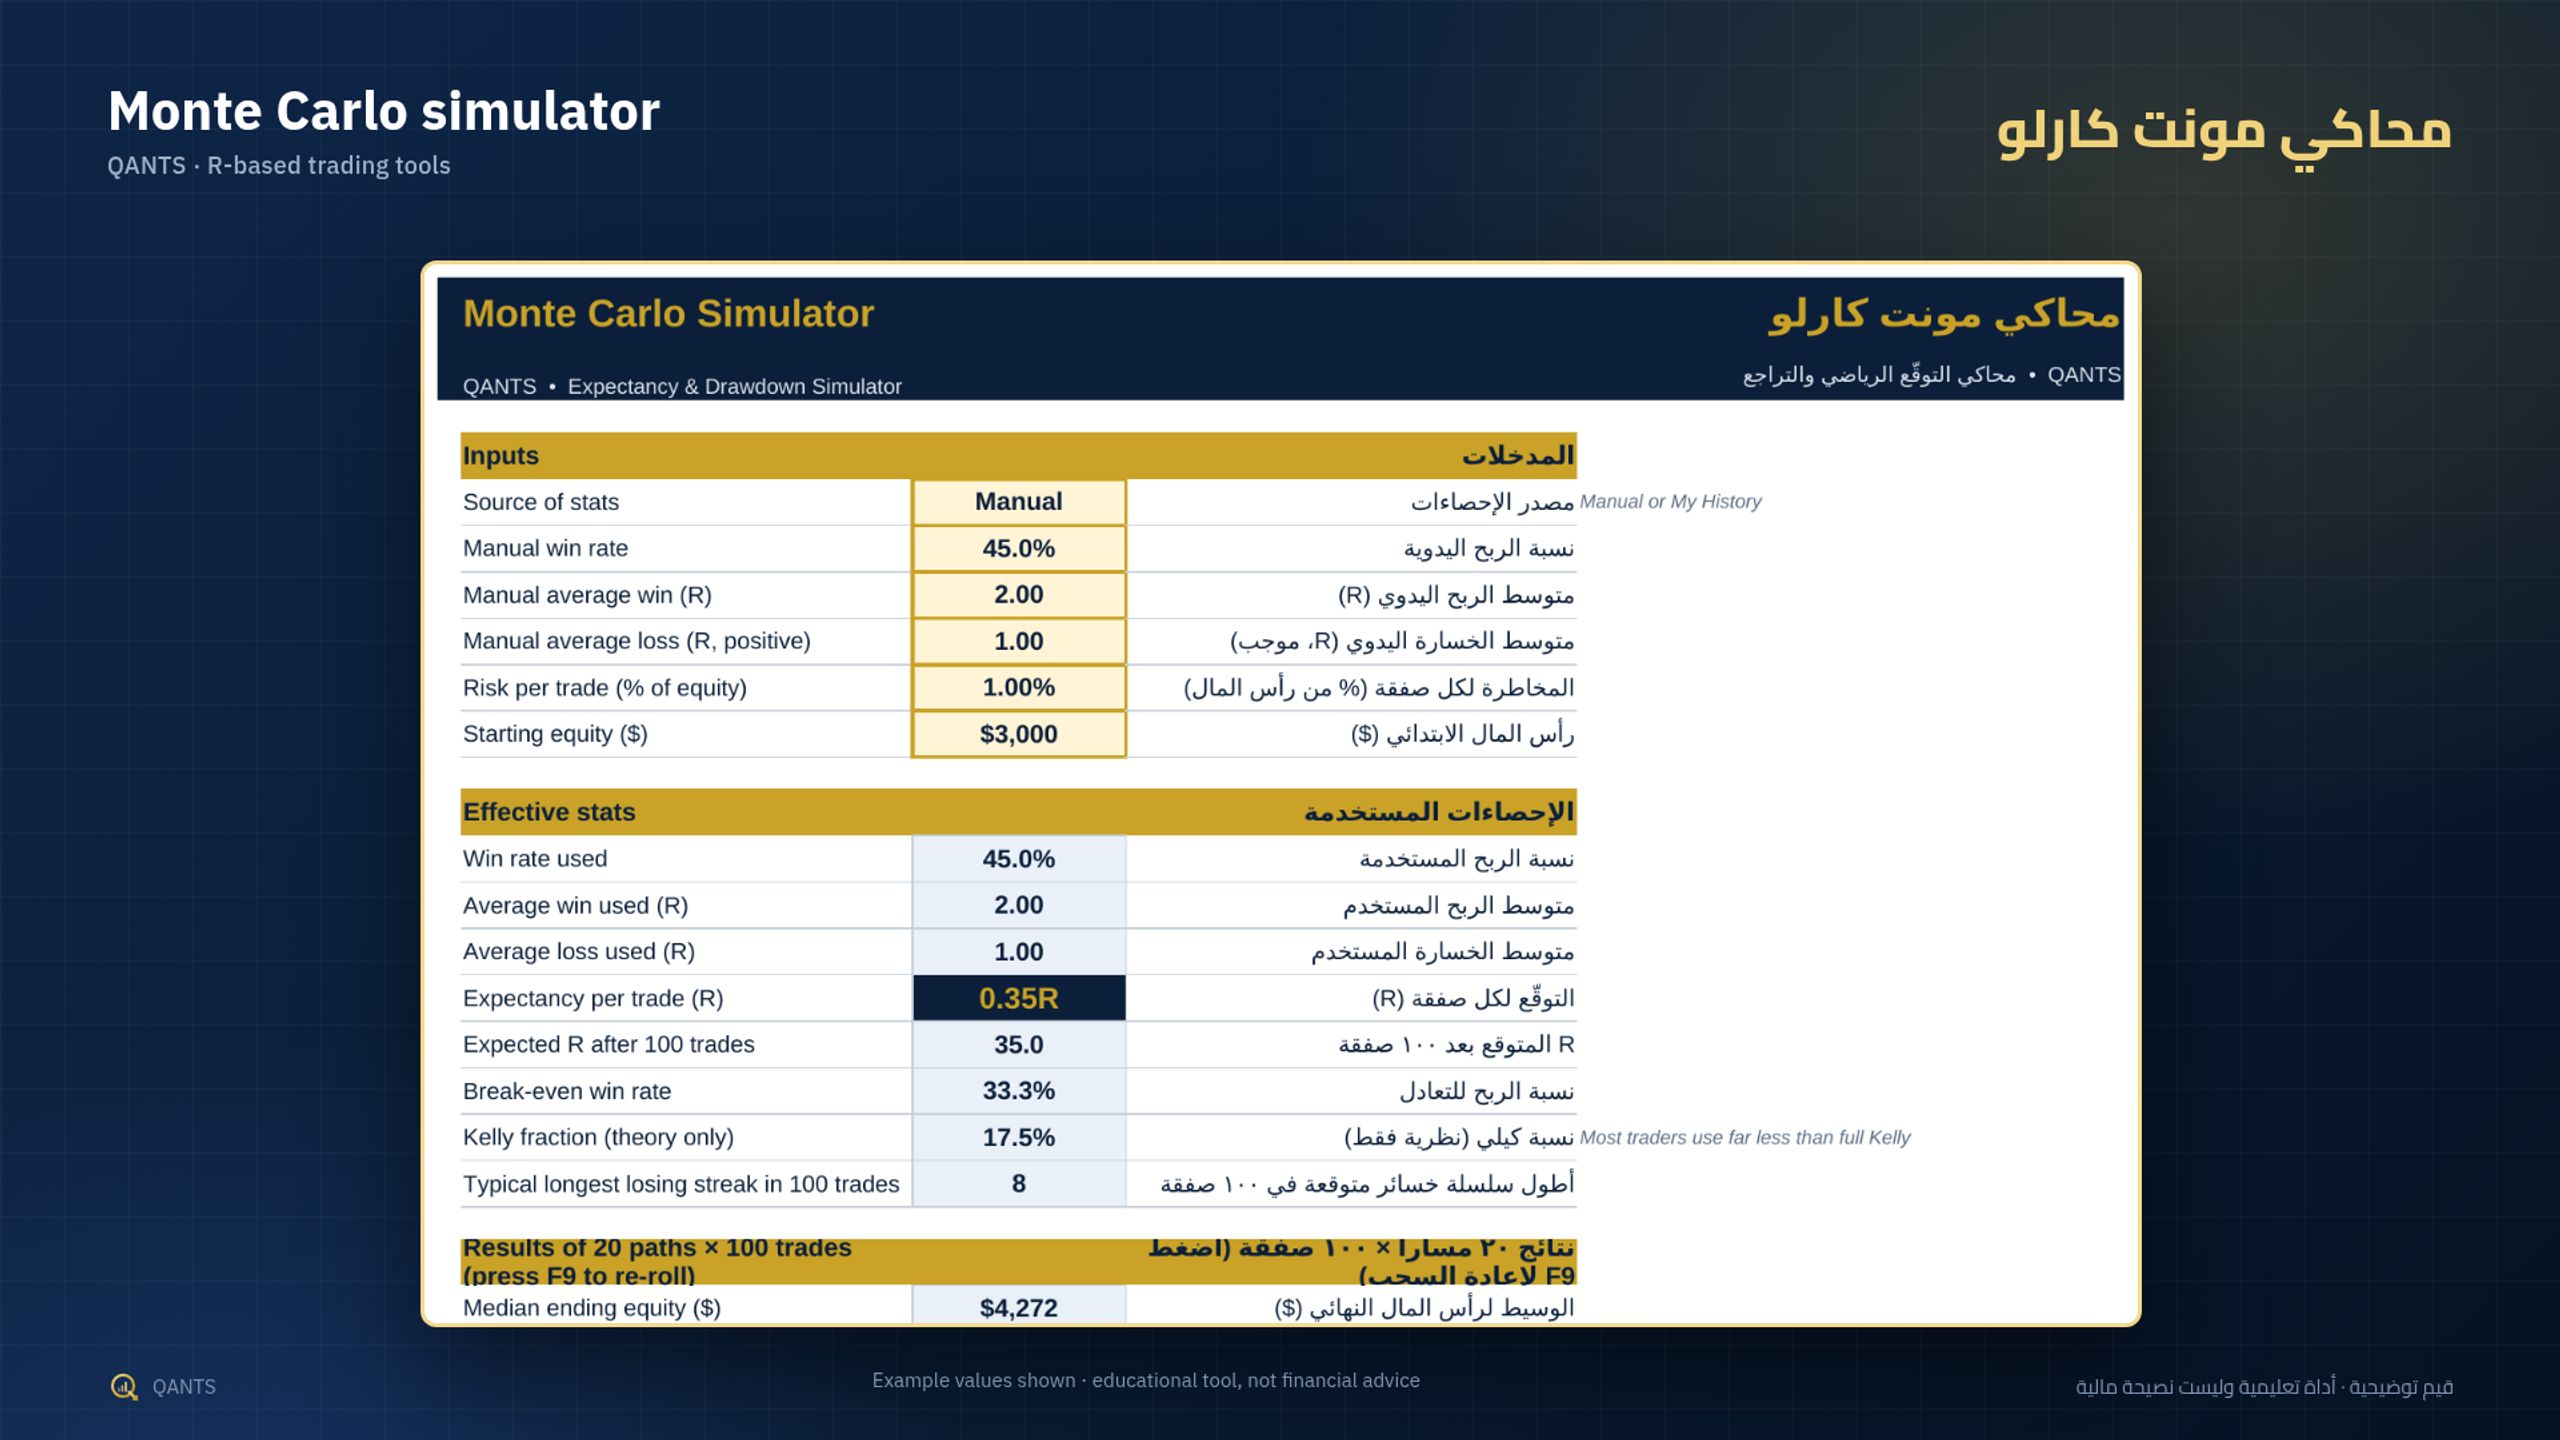
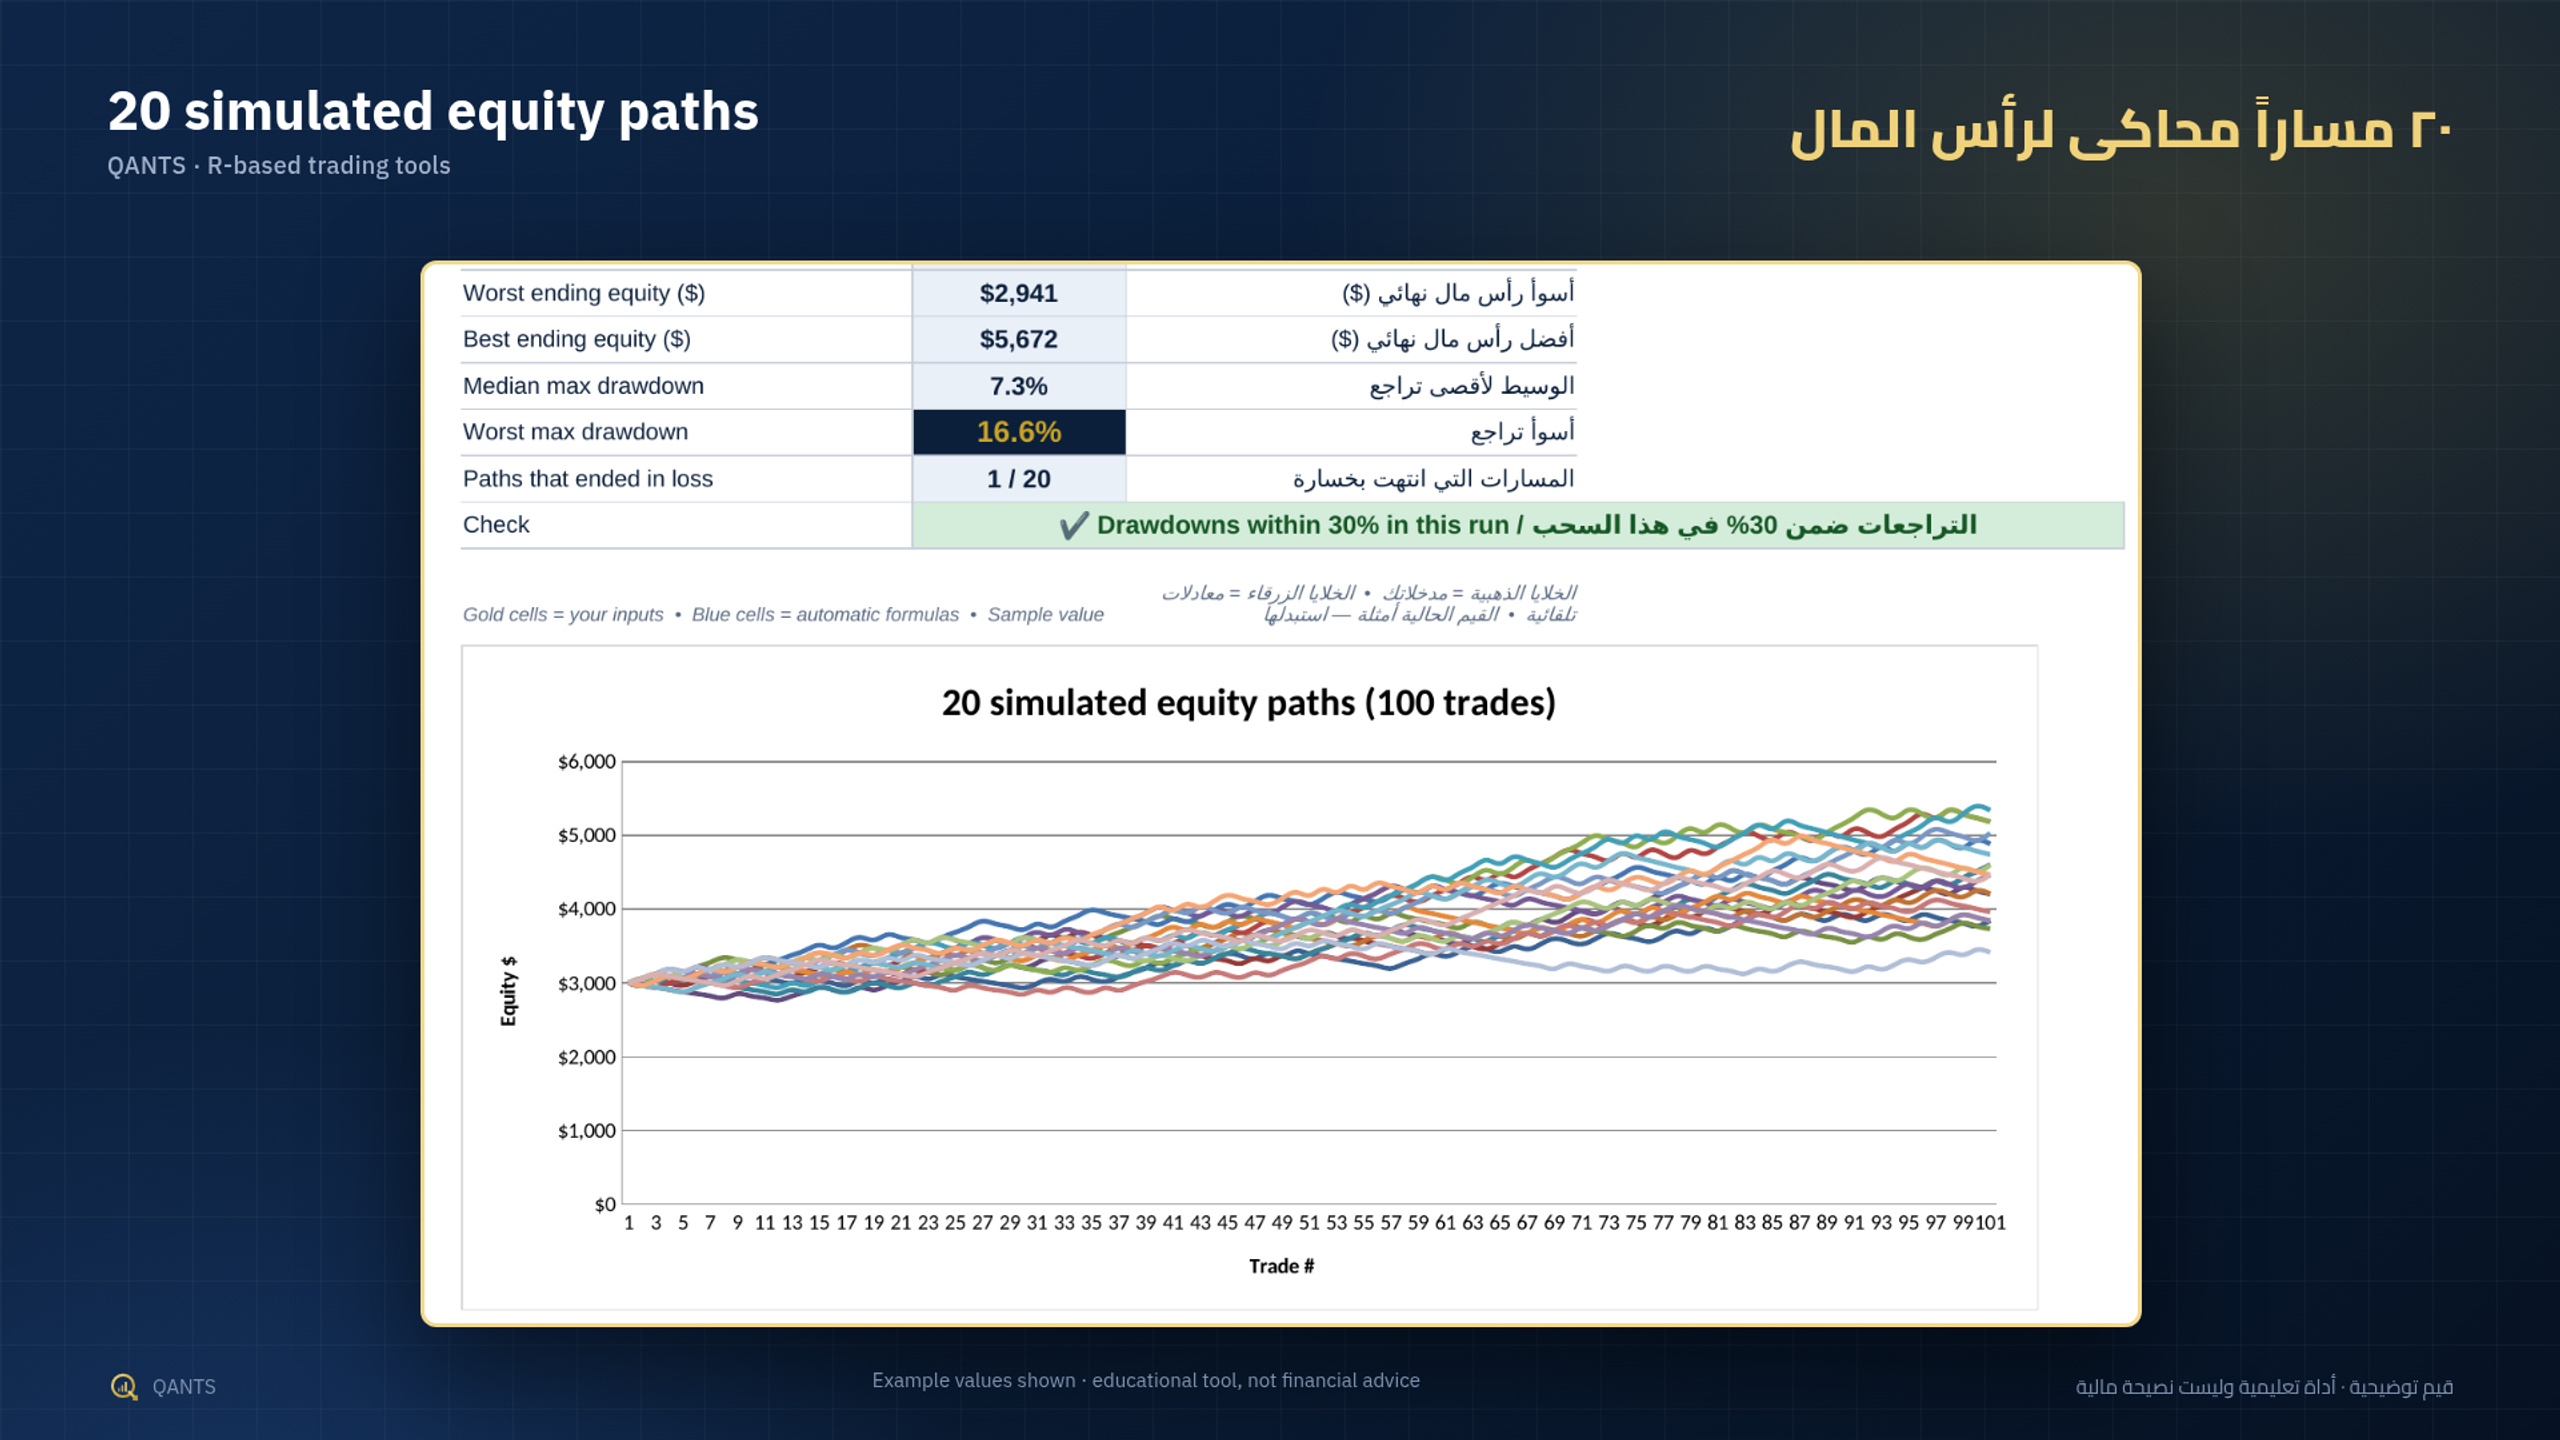
Paste the R result of your closed trades (up to 500) and get your real win rate, average win/loss, expectancy, profit factor, max drawdown in R and longest losing streak. Then run 20 Monte Carlo paths of 100 trades from your stats (or manual inputs) at your chosen risk %: median, worst and best ending equity, median and worst max drawdown, with a chart of every path. A losing-streak table shows how much of the account 1–20 losses in a row remove at 0.25%–3% risk.
Excel + Google Sheets, Arabic RTL + English, no macros, formulas tested.
محاكي عربي/إنجليزي: الصق نتائج صفقاتك بوحدات R لتعرف التوقّع الحقيقي وأقصى تراجع وأطول سلسلة خسائر، ثم شغّل ٢٠ مسار مونت كارلو بنسبة المخاطرة التي تختارها.
Disclaimer: Planning tool, not a forecast or financial advice. Simulations assume independent trades; real results can be worse. Trading involves substantial risk of loss.