Rotation Model
The engine — "bet on the fastest horse"
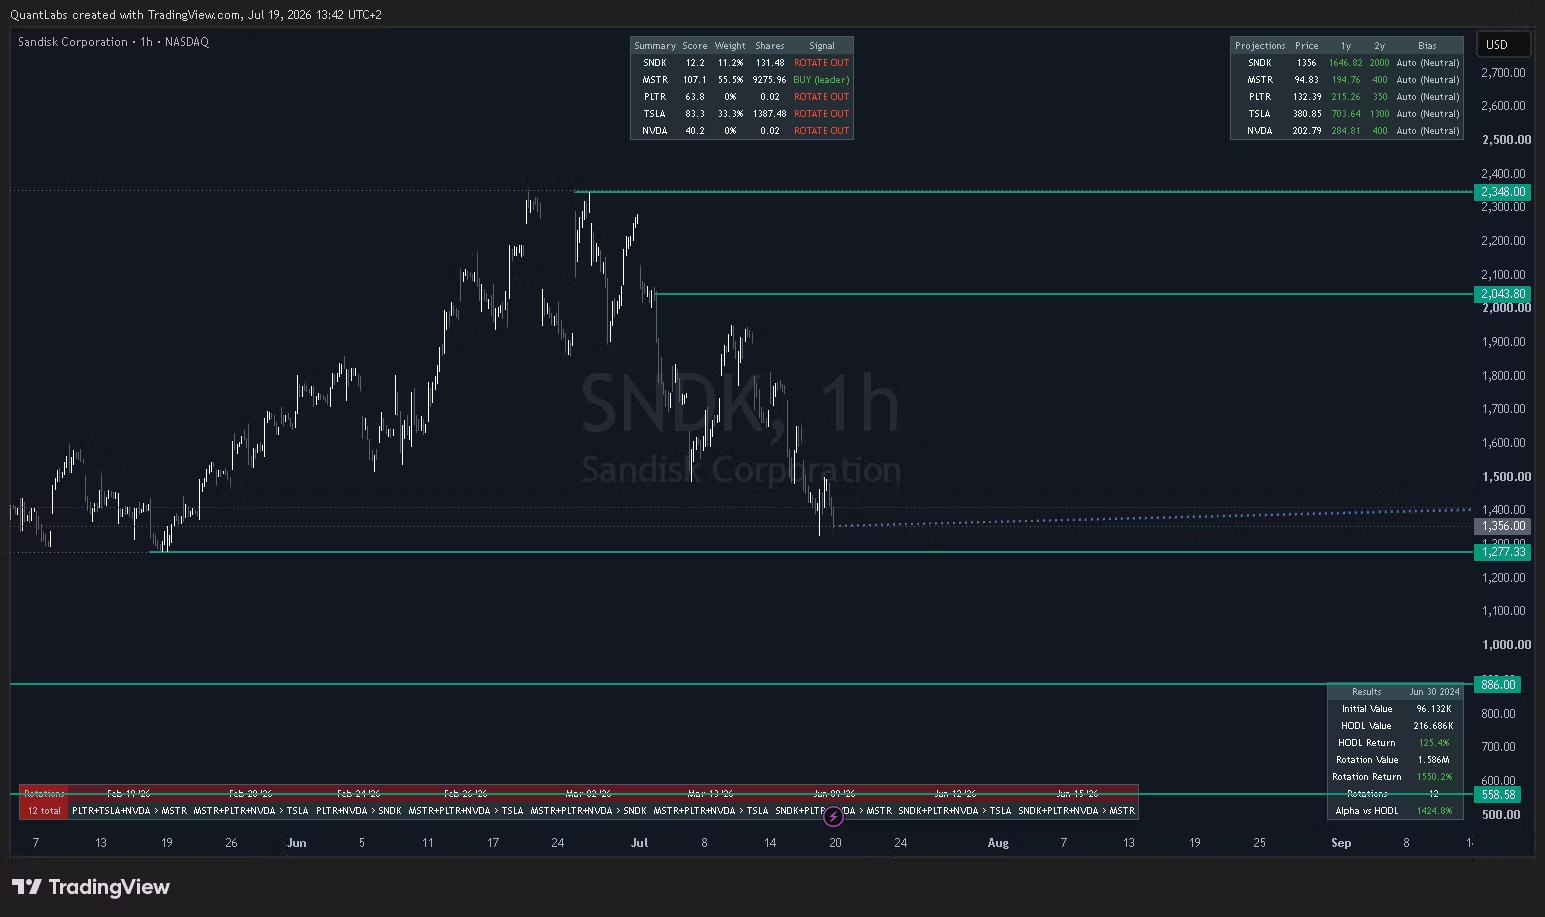
Asset 1 is always the chart symbol (like the demo pulling in HIMS), plus up to 4 more symbols (defaults: MSTR, PLTR, TSLA, NVDA — the video's lineup). Each has shares held, sell %, projection bias, and optional manual price target. Duplicate symbols throw the same "Asset X and Y have the same symbol" error shown in the demo.
Price projections: from your anchor date (the yellow dashed line; default lookback ~recommended 2 years), each asset gets a log-growth trend → 1y and 2y price targets shown in the Projections table. Set bias per asset (More/Slightly Bullish/Bearish tilts the growth rate, like tilting Tesla 425 → 747 in the video) or hard-code a 2y target.
Rotation: each asset's score = projected annual growth + momentum kicker. When a new leader emerges by more than the aggressiveness threshold, laggards are sold down by their Sell % (keep retention by lowering it — e.g. sell 80 / retain 20) and proceeds rotate into the leader. Trade Aggressiveness (Conservative → Maximum) controls both the score gap required and the cooldown between rotations.