
Pro Trading Journal — Excel / Google Sheets Template
Starter Excel/Sheets journal: you log P&L; a dashboard totals seven figures.
Pro Trading Journal is a four-sheet workbook for recording trades in Excel or Google Sheets. You type each trade, including P&L, and the Dashboard adds up seven figures. It is not a full analytics platform. Generic sheet (symbol, direction, prices, quantity, P&L, tags, notes). Not built for prop-firm challenge rules, FX lot sizes, or futures/options multipliers.
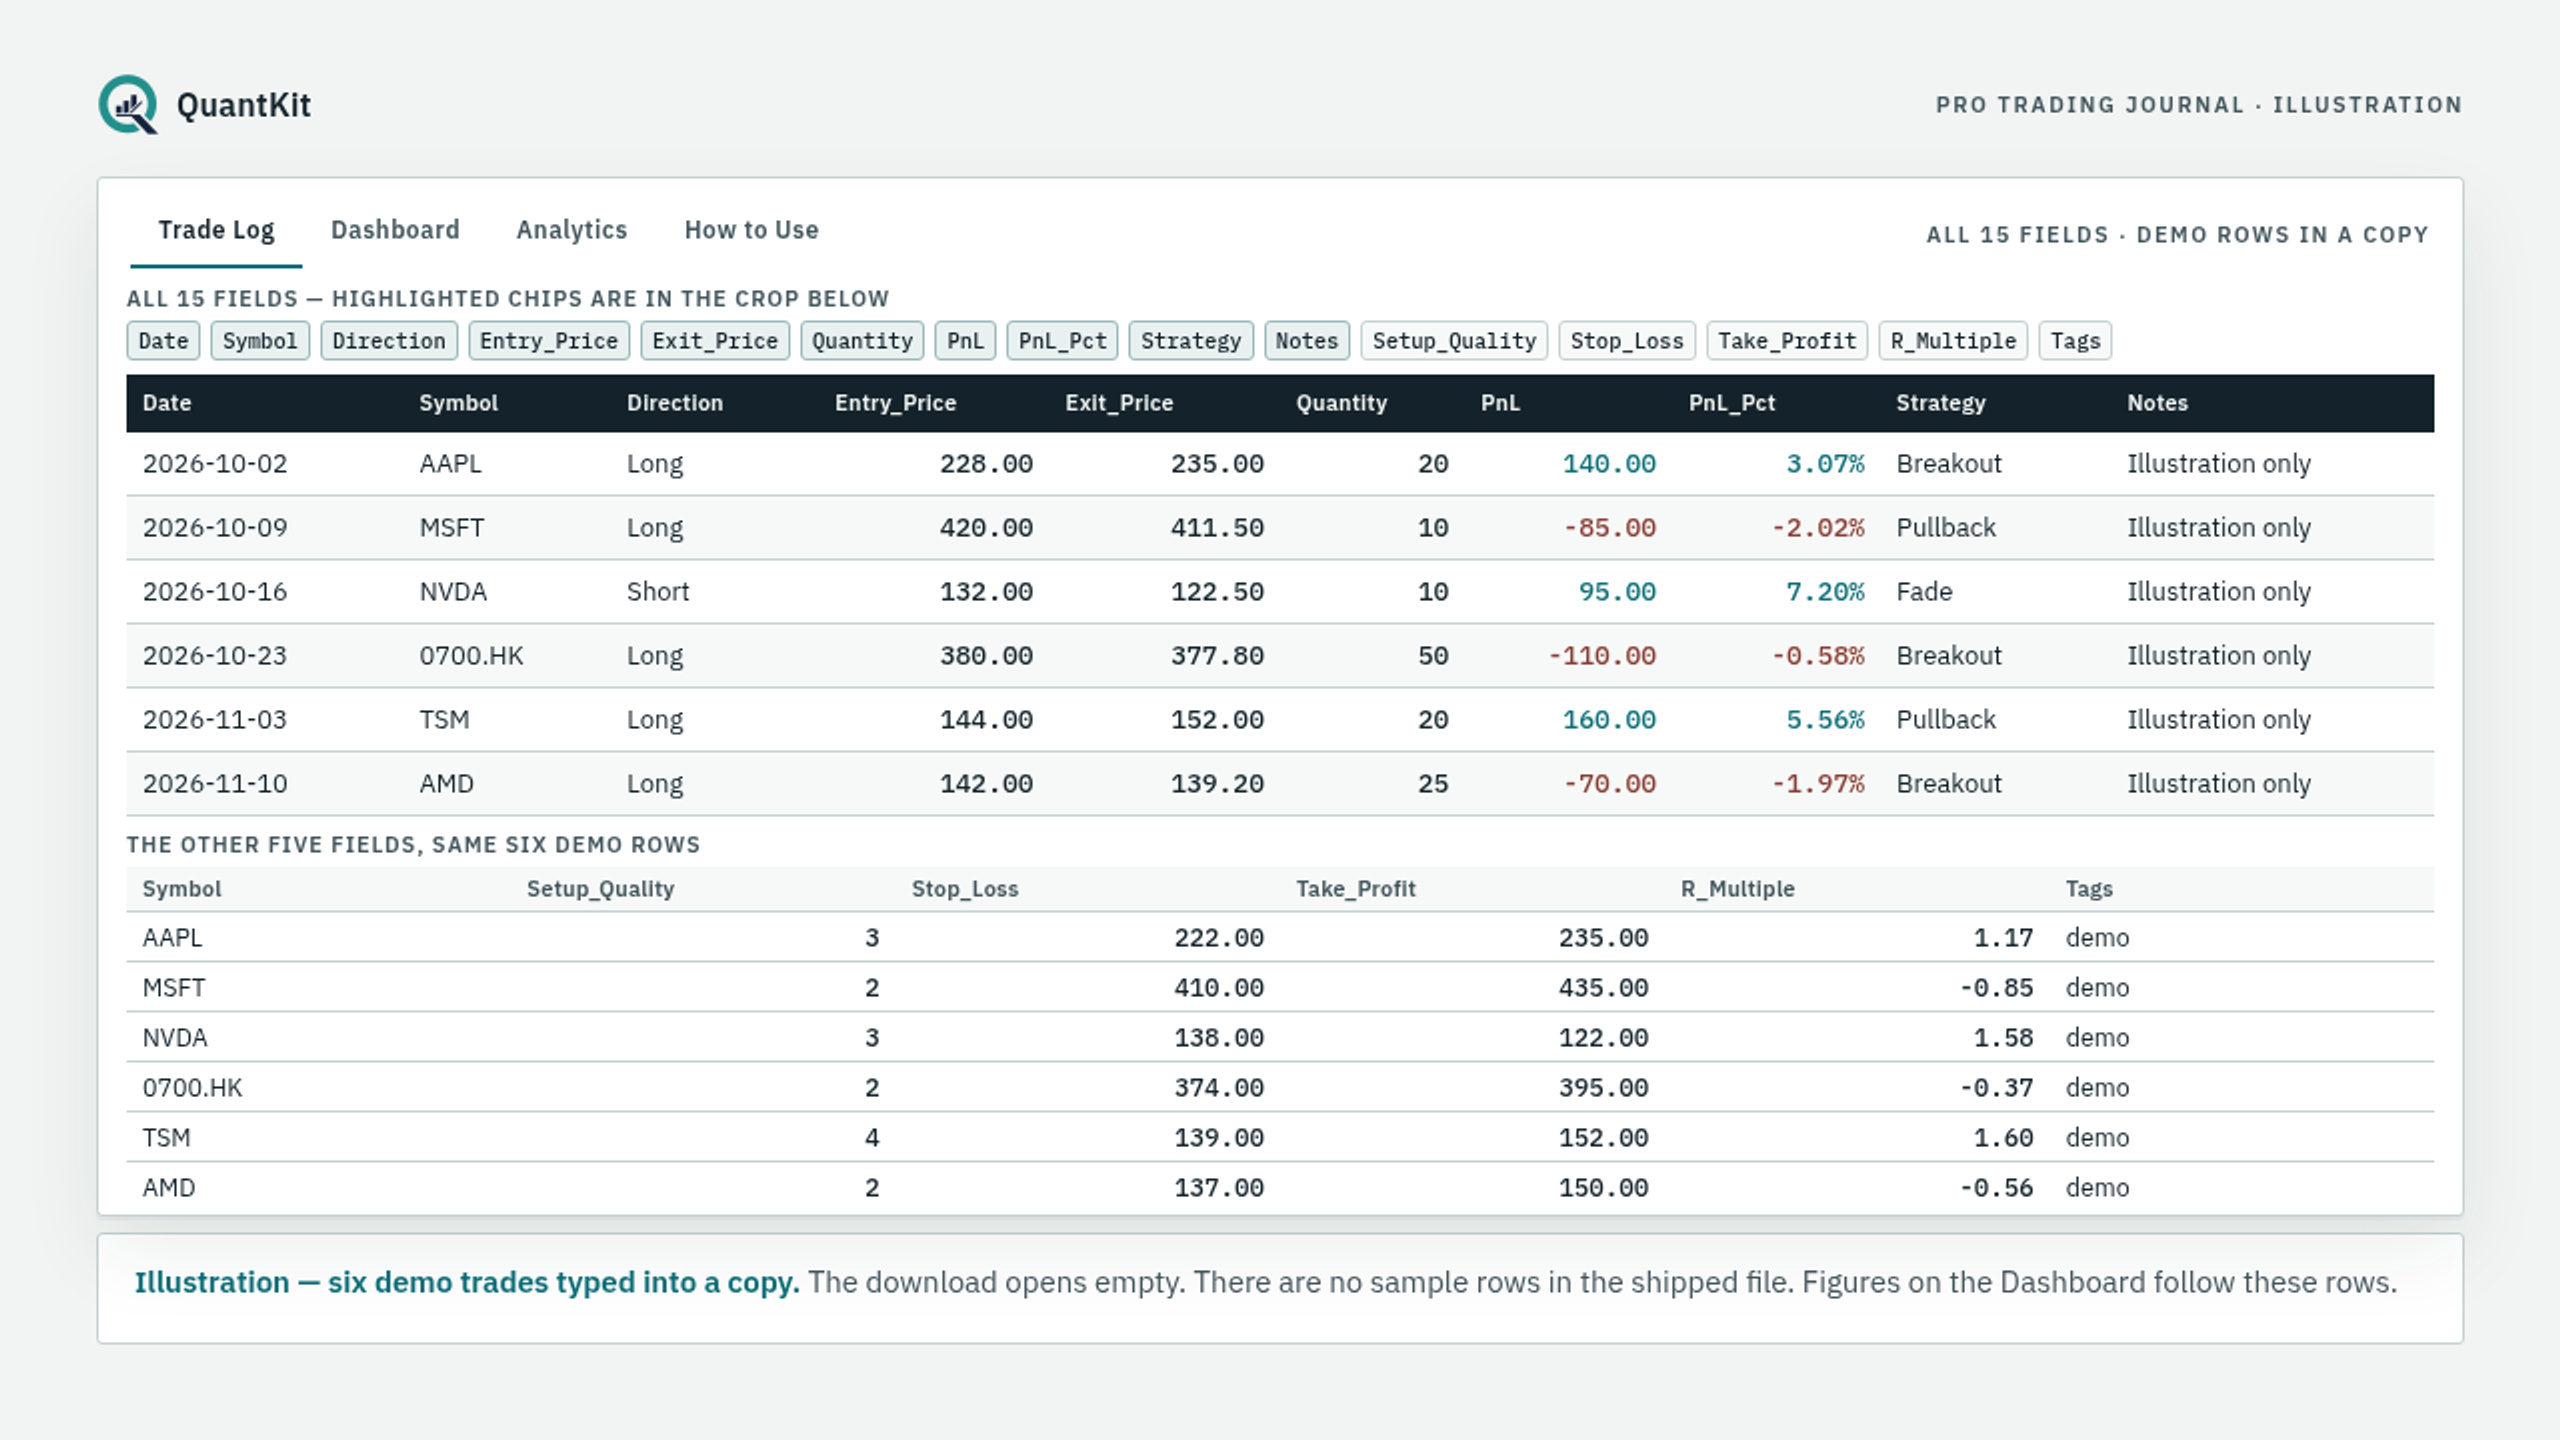
Open the .xlsx in Excel, or convert it in Google Drive to Google Sheets. Enter trades in date order with no blank rows. Fill P&L yourself — the Trade Log does not calculate P&L, P&L_Pct, or R_Multiple from entry, exit, and quantity. The Dashboard reads Date and PnL. After a Sheets conversion, check that the Dashboard still calculates; that check is on you and has not been pre-run.
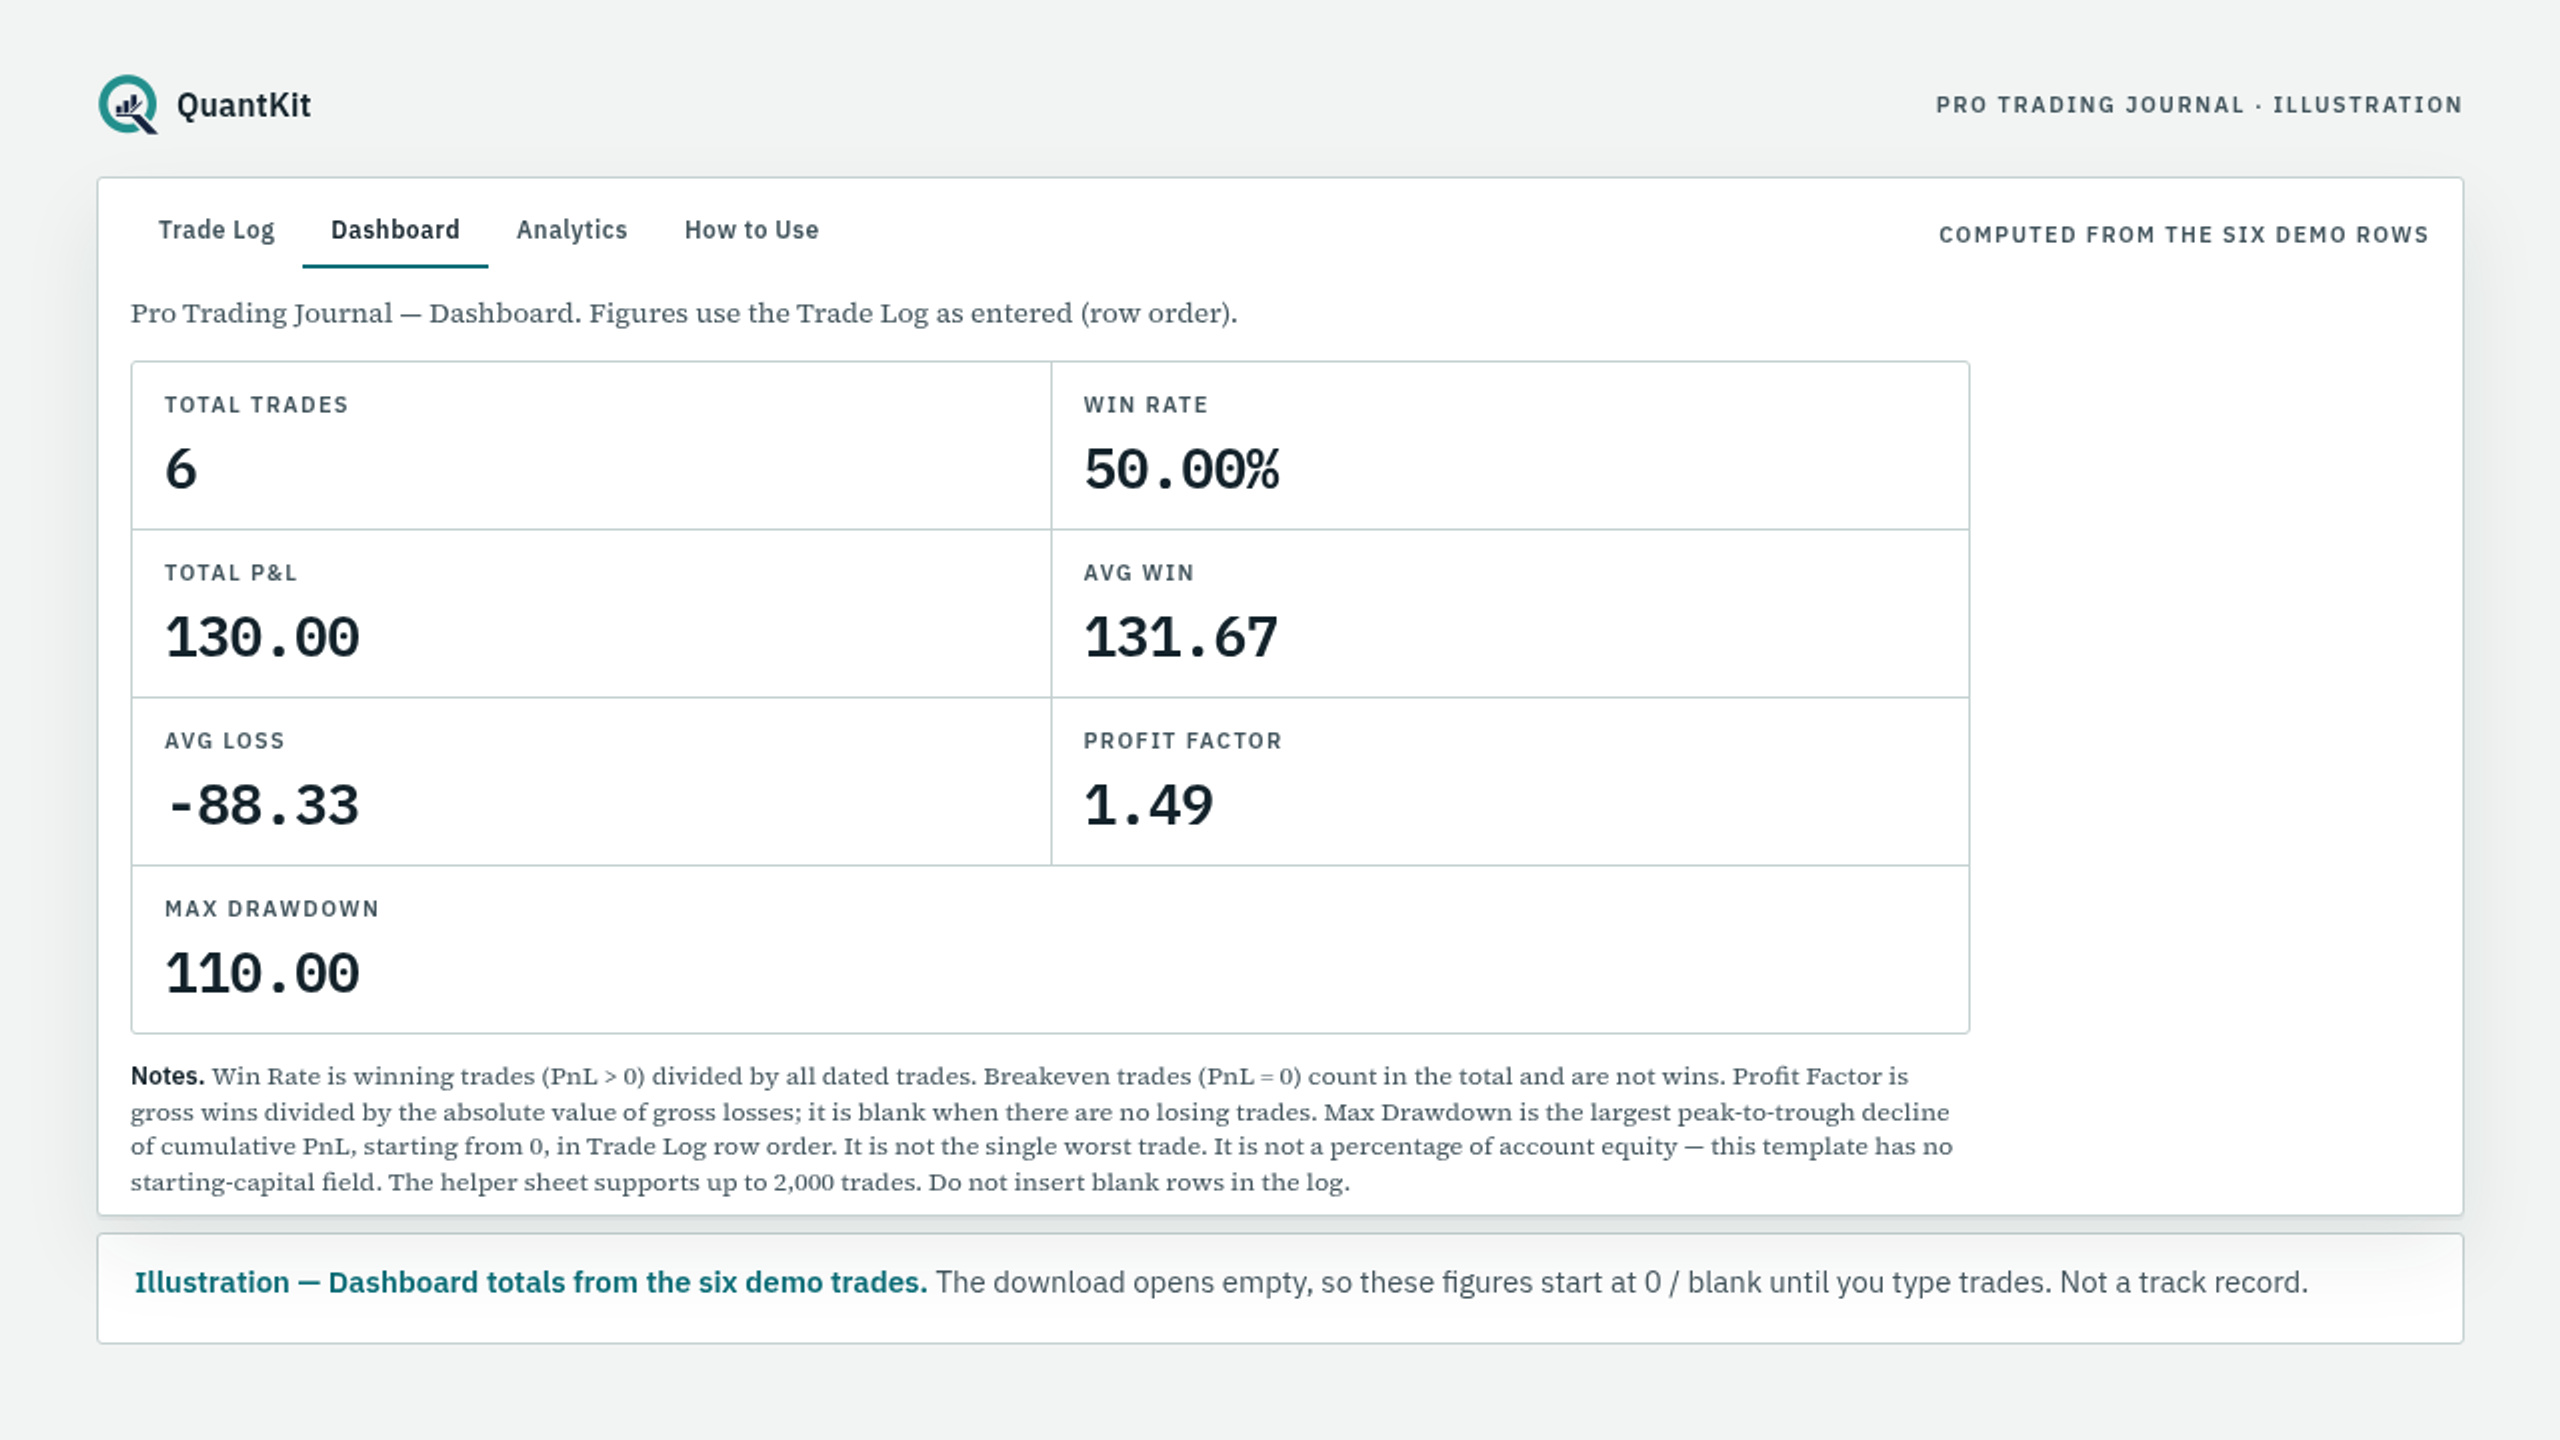
Trade Log: 15 header fields (Date through Notes, listed in the workbook); no sample trades. Dashboard: total trades, win rate, total P&L, average win, average loss, profit factor, and max drawdown (largest peak-to-trough decline of cumulative P&L from 0, in row order; not the worst trade, and not a % of account equity — no starting-capital field). Helper sheet supports up to 2,000 trades. Analytics: header row only (Strategy, Trades, Win Rate, Total P&L, Avg R); does not auto-fill.
Requirements: Microsoft Excel, or a Google account to convert to Google Sheets. Not a 50-metric analytics system. No charts, Sharpe ratio, position sizer, or pre-loaded example trades. Until you log dated P&L, Dashboard figures stay at zero or blank.