
Python Trading Toolkit — Screener, Technicals, Options Helper, and P&L Printer
Four short Python scripts for equity and options sketches. Not a backtest.
Python pack for sketching equity and options work from the command line: four scripts, an example positions CSV, a sample watchlist JSON, and a multi-market ticker note. Written for US, Hong Kong, and A-share equities, plus a US-style options-chain helper — not CFD, FX, or prop-firm workflow.
Python 3.8+; pip install -r requirements.txt (yfinance, pandas, numpy, requests).
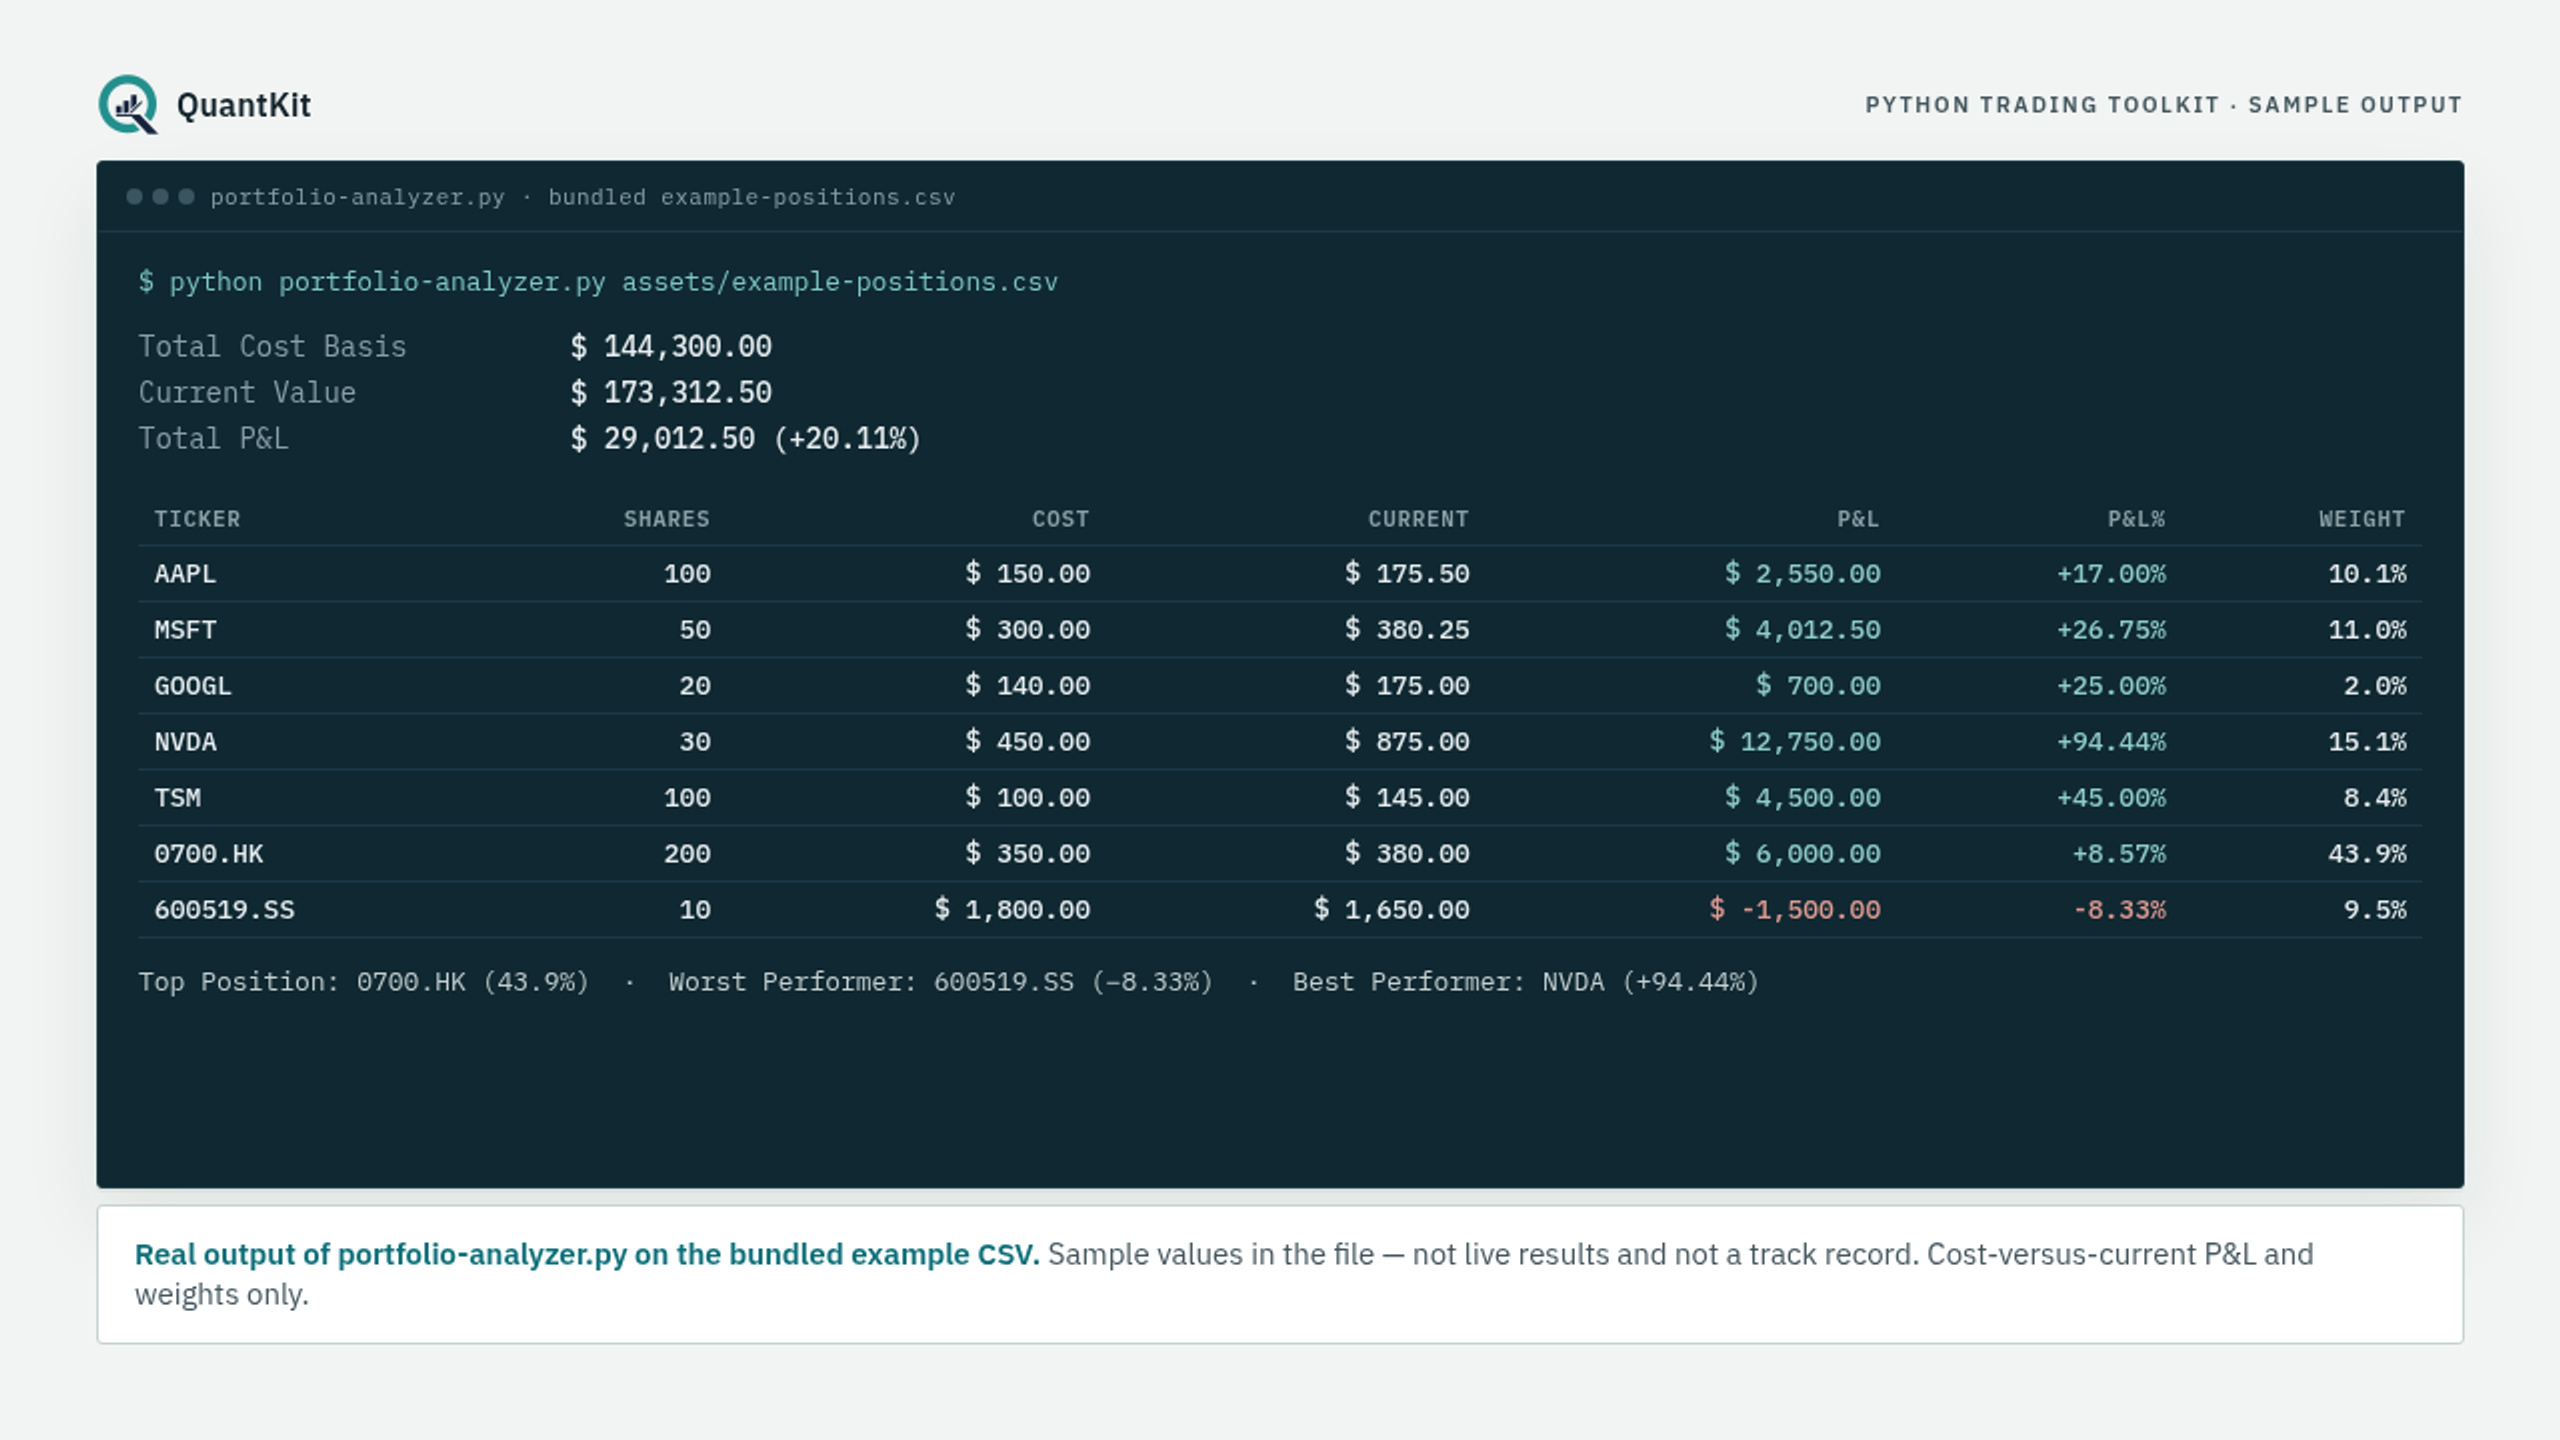
screener.py — Yahoo volume, market cap, trailing P/E (–tickers, watchlist JSON, or a built-in default). --min-revenue-growth is accepted and printed but not applied in the filter. A price-alert helper in the file is not wired to the CLI. technical.py — SMA 20/50, EMA 12/26, RSI (14), MACD, Bollinger Bands, 20-day volume z-score, plus a short signal list (crosses, RSI, volume-z, Bollinger, MACD-histogram). Optional --sina for A-share/HK. options_analyzer.py — Yahoo options chain; put/call volume and OI ratios; flags volume > 2× open interest; simplified max-pain strike; no IV surface. portfolio-analyzer.py — 57-line printer from ticker, shares, cost_basis, current_price (uses that column; no live quotes; no Sharpe, VaR, beta, or drawdown). example-positions.csv holds sample figures, not live results.
Requires Python 3.8+, yfinance, pandas, numpy, and requests. Not a backtest engine, Fama-French toolkit, or correlation-matrix / position-sizer package. No risk or factor modules from some older marketing. Trust the four Python files, not the bundled README and SKILL.md, which still over-describe them.