
Risk Interval Pro
Know Key Market Levels Before Price Gets There.
RISKi is a Risk-based Trading indicator designed to give traders a clear, map of where price is likely to react throughout the trading session.
Rather than relying on unreliable and subjective levels, RISKi uses real market data and our Risk Interval methodology to calculate dynamic volatility levels at the institutional level.
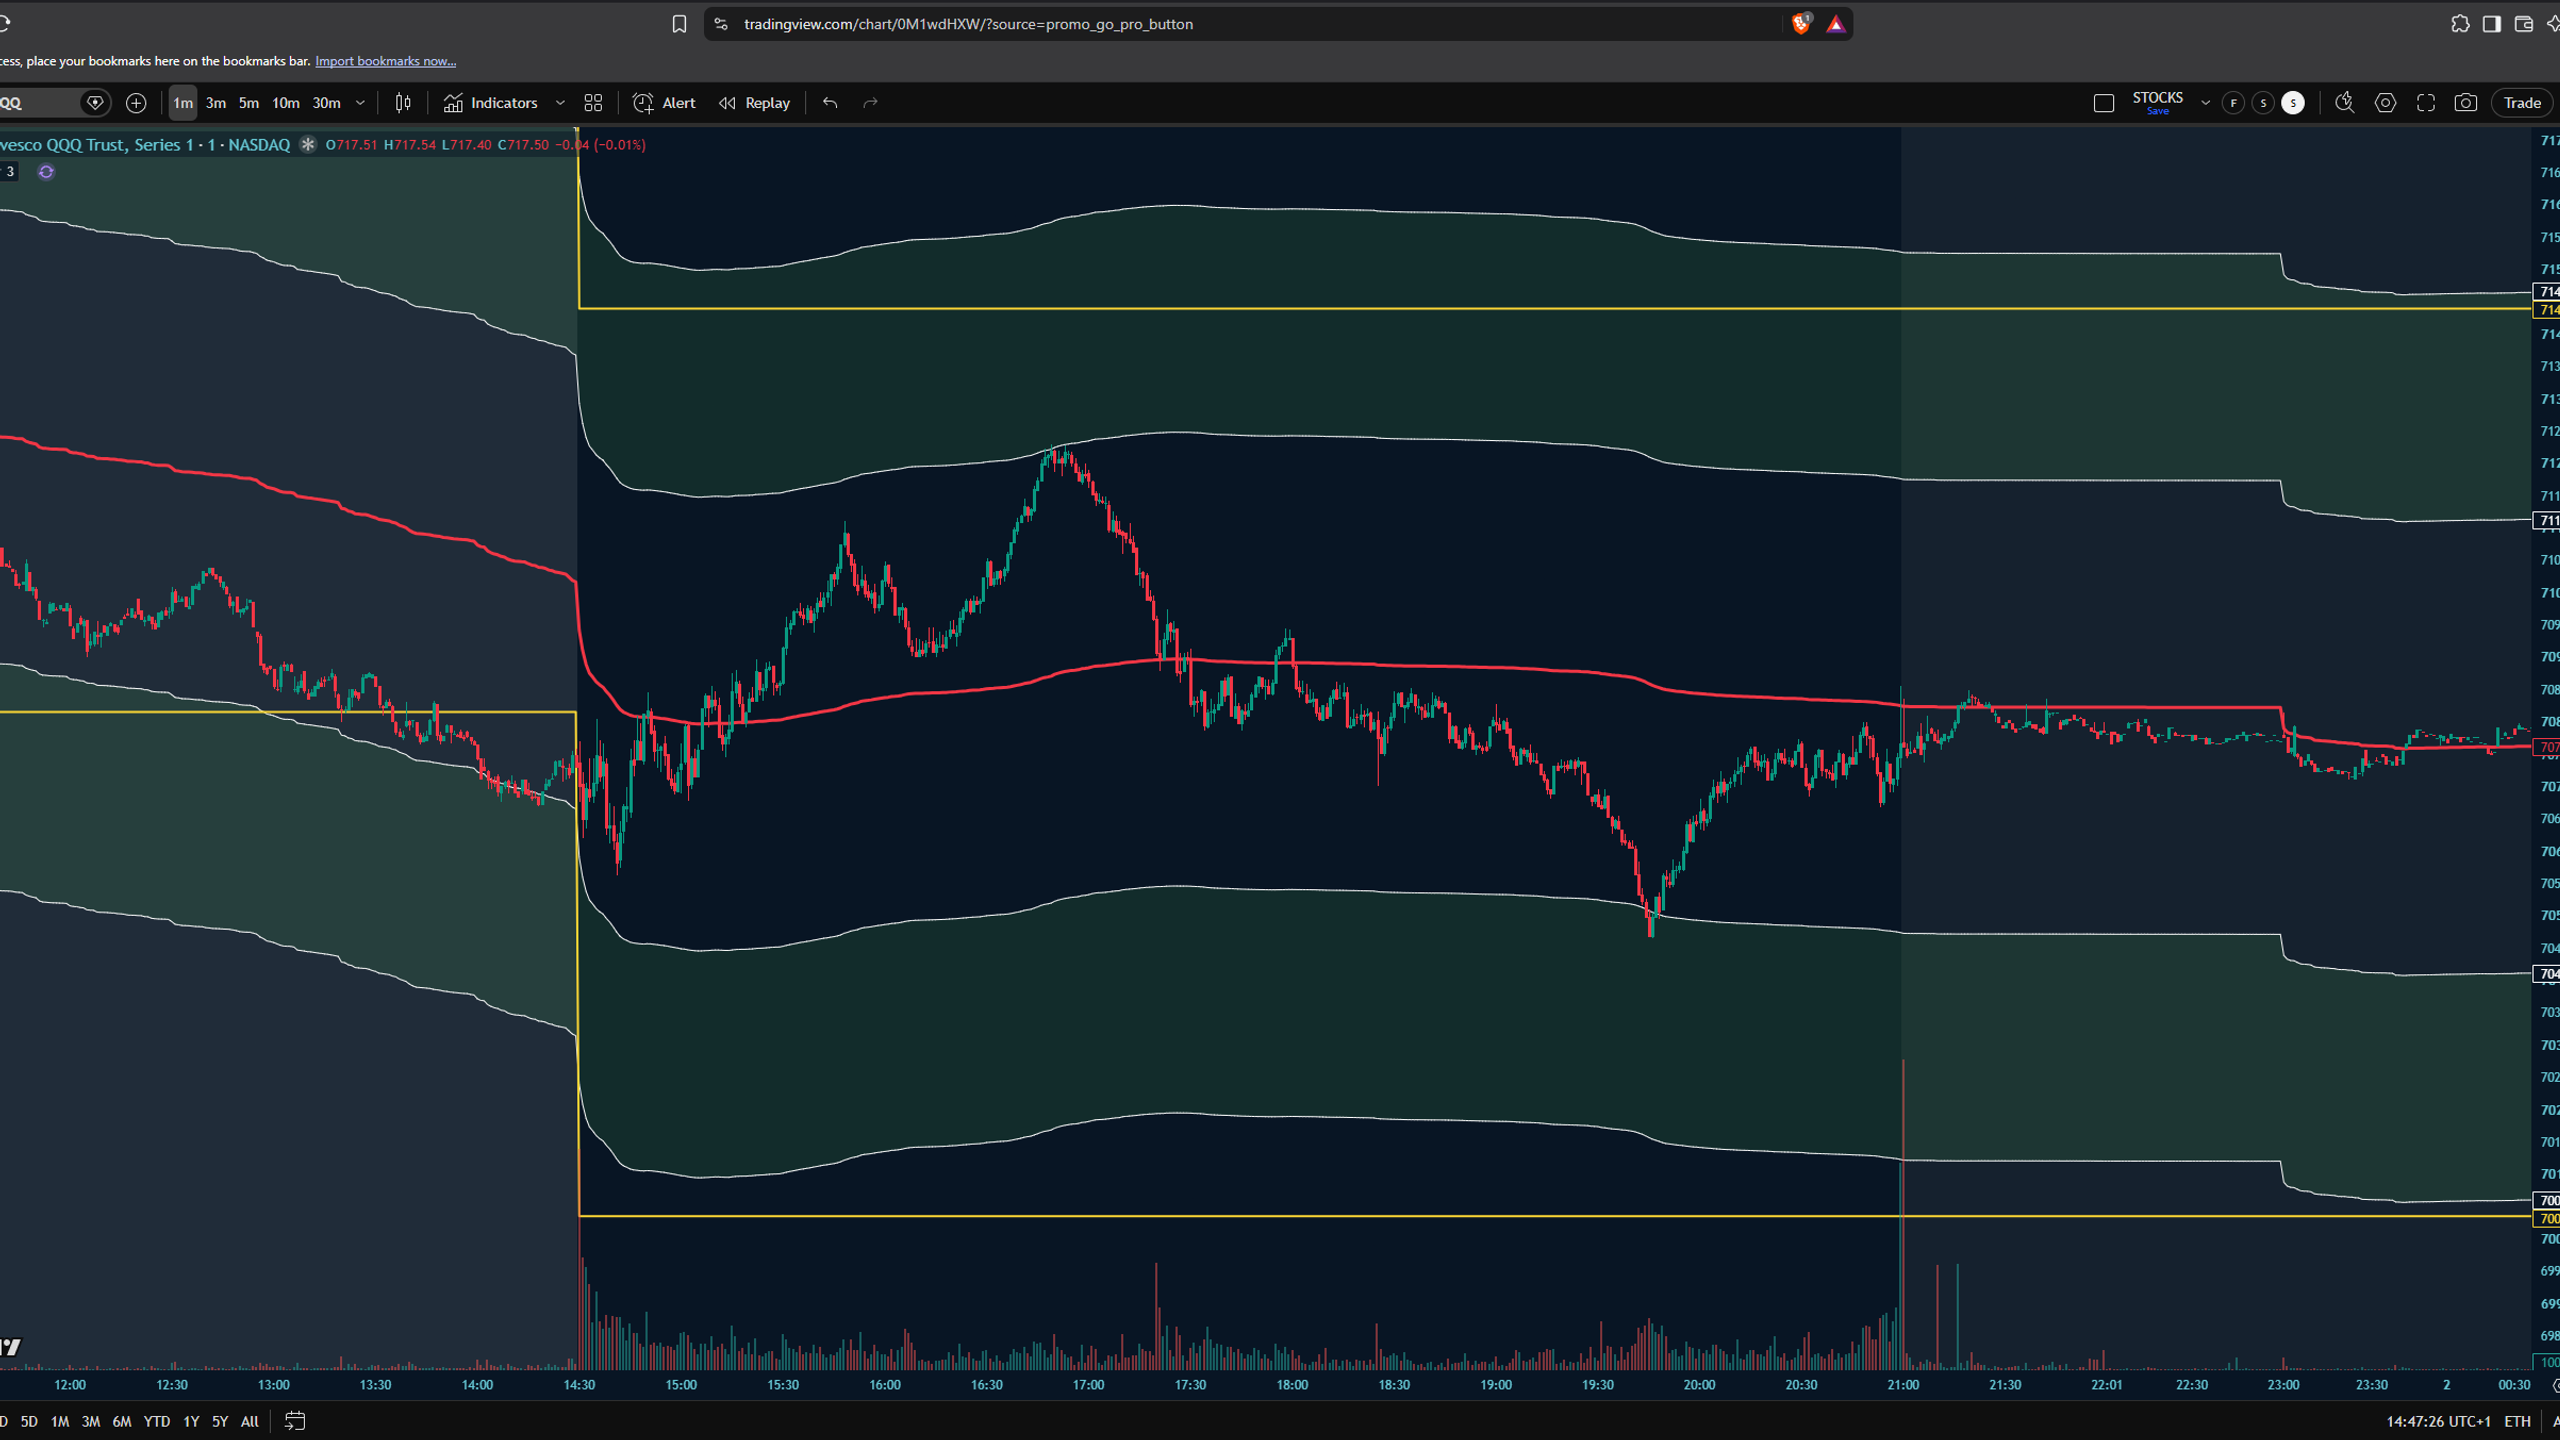
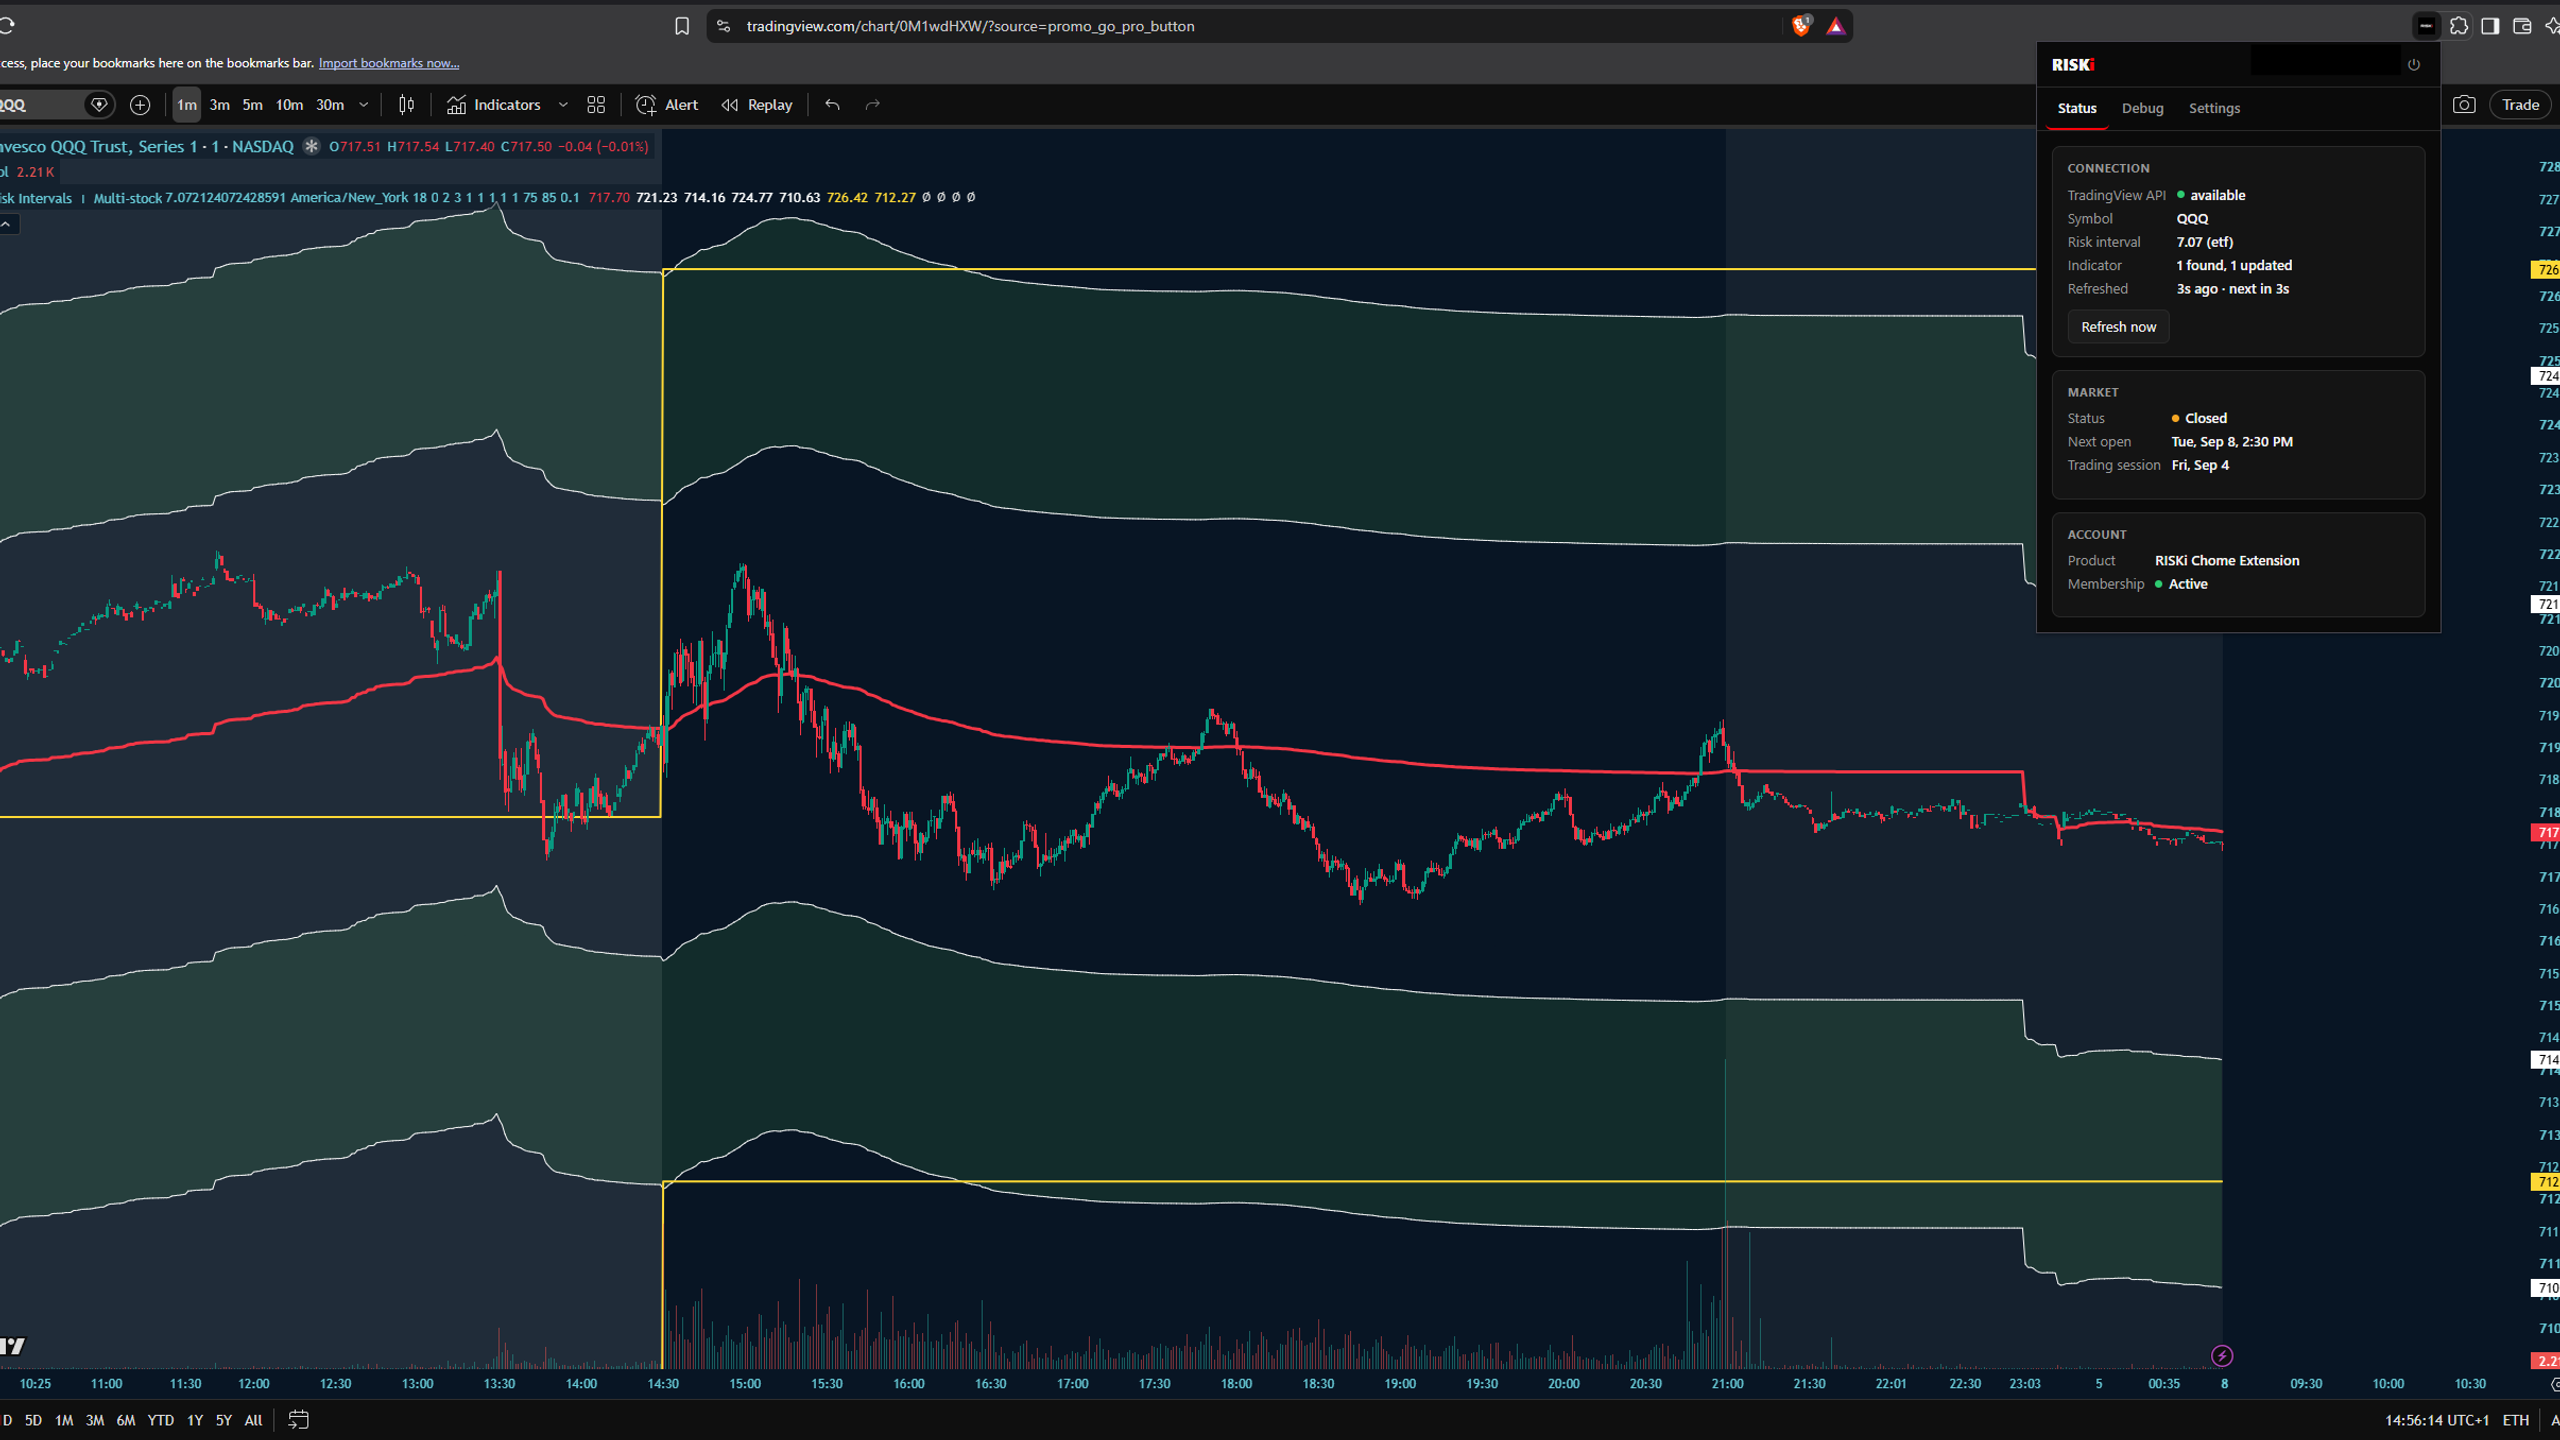
The indicator plots:
VWAP — the session’s central reference point
± ½ Risk Interval — key intraday decision and reaction zones
± 1 Risk Interval — outer volatility levels for larger extensions
± 1 Risk Interval Static — yellow static bands which look for 1 RI off open price.
RISKi is designed to help identify rejections, breakouts, retests, reversals and potential price targets while giving you a structured framework for understanding where price sits within its expected volatility range.