Roboquant AI

Roboquant is a fully End to End quant trading platform that lets you develop, backtest and execute all in one platform with fully automated...
Nicosia, CY
•Created byProfile pictureGabriel
Profile picture
GabrielProfile picture@ventos99·7h

Same trades. Different drawdown.

The same trades can produce different drawdowns.


Hypothetical fixed-dollar example: +200, −100, +200, −100 finishes at +$200 with a maximum closed-trade drawdown of $100. Reorder it to −100, −100, +200, +200 and it still finishes at +$200, but the maximum decline from a running peak, including starting equity, is $200.


Roboquant’s Monte Carlo view uses random reshuffles of the historical trade sequence to explore alternative paths. This examines sequence risk; it does not invent new market regimes or guarantee a maximum loss. Random shuffling can also remove real dependencies between trades.


Use the analysis alongside trade-sample quality, cost assumptions and sizing. Availability varies by plan.


Discussion: Do you review the possible path of losses as well as total profit?

Profile picture
GabrielProfile picture@ventos99·1d

The alert fired. Why no position?

The alert fired. Why is there no position?


Check three separate events: delivery, broker acceptance and execution. TradingView’s official documentation notes that webhooks may fail to reach the destination; its alert log exposes Webhook status. A delivered instruction is still not proof of an accepted or filled order.


Verify the account, instrument, quantity and order status. A working, partially filled, rejected or canceled order needs a different response. Check the current state before resending an instruction.


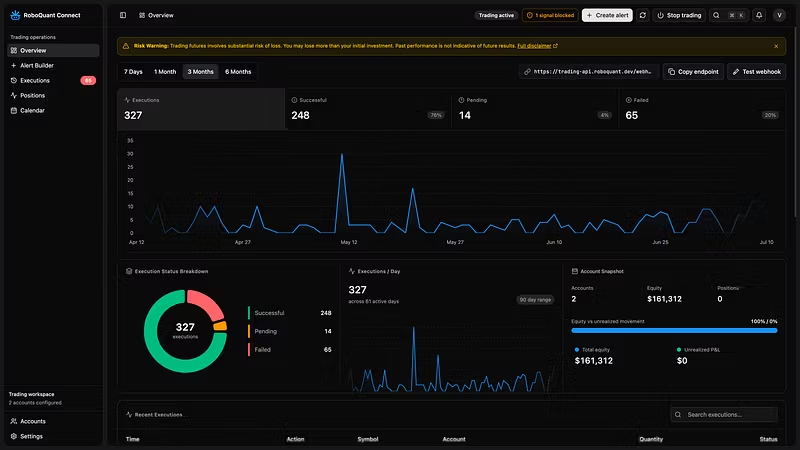
Roboquant Connect routes supported TradingView webhook instructions to supported execution accounts. Test the configured route in Demo before considering Live. Plan, broker and account requirements apply. No system guarantees delivery or fills.


Discussion: Which execution checkpoint has caught you out before?

Profile picture
GabrielProfile picture@ventos99·2d

Profitable overall. Losing recently.

Profitable overall, losing recently: what changed?


Start by separating the result into clearly defined periods while keeping the rules fixed. Inspect trade frequency, average payoff, sizing and execution assumptions. A change in market behavior is one possible explanation; implementation changes and ordinary sample variation are others.


Roboquant keeps backtest results and the trade list in the strategy workflow, helping you investigate the trades behind a summary return. Review drawdown duration as well as depth.


Record a hypothesis before retuning. Repeatedly adjusting rules to explain the latest losses can turn diagnosis into another form of fitting the past.


Explore the evidence at Historical results do not guarantee future returns.


Discussion: What do you investigate first when a strategy starts losing?

Profile picture
GabrielProfile picture@ventos99·3d

Better strategy, or fewer trades?

Did the filter improve the strategy, or just remove most of its trades?


In a hypothetical example, 60 wins from 100 trades is a 60% win rate. Fourteen wins from 20 is 70%. The second number is higher, but the sample is smaller and tells us nothing by itself about payoff, net profit or drawdown.


Use Roboquant to preserve a baseline and test one recorded rule change. Keep dates, sizing and costs consistent; compare the full trade list and risk metrics, not only win rate.


If the filter was selected after studying the test period, that period helped develop the rule. Freeze the choice and evaluate untouched data next. Keep all experiments in the research record.


Discussion: Which metric would you inspect after adding a filter?

Profile picture
GabrielProfile picture@ventos99·4d

Works on ES. Fails on NQ. Why?

A strategy can work on ES and struggle on NQ. That alone does not prove it is broken—or that it has a durable instrument-specific edge.


Start with a fair comparison. Keep signal logic and evaluation windows comparable, but make sizing, contract values and costs explicit. A ten-point move is $500 on one ES contract and $200 on one NQ contract before costs. Equal points are not equal risk.


Roboquant includes historical CME data for supported instruments, so you can run each market separately and inspect its trades, drawdown and net results in the same workflow. No separate data-feed connection is needed. History and fill-mode access vary by plan and instrument.


Investigate why results differ, then test that explanation on untouched data.


Discussion: What changes when you test the same idea on another instrument?

Profile picture
GabrielProfile picture@ventos99·5d

AI wrote your strategy. What next?

AI makes a trading idea easier to implement. It does not tell you whether that idea has an edge.


Start with explicit entry, exit, sizing and session rules. State whether decisions happen on completed bars or intrabar, then inspect actual entries and exits. A script can compile successfully and still implement a different rule from the one you intended.


Roboquant connects AI-assisted strategy building, compilation and native backtesting in one workflow. Use the time saved on setup to check behavior, costs and untouched evaluation data. Keep your baseline before making revisions.


Start with one precise rule at Features and allowances vary by plan. Historical results do not guarantee future returns.


Discussion: Which part of an AI-written strategy do you check first?

Profile picture
GabrielProfile picture@ventos99·Sep 30

From backtest to deployment

A backtest does not complete the execution workflow. Market data, strategy decisions, order requests and broker fills are separate stages.


Roboquant can deploy the same compiled strategy artifact used in your backtest to supported Tradovate Demo or Live accounts. Native deployments are available on eligible plans and supported strategy configurations. CME data is provided through the platform; execution accounts are separate.


Before launch, check the account, instrument and quantity. Configure maximum order size, maximum position size, order-rate limits and daily-loss limits. Then monitor orders, positions, logs, P&L and deployment status.


Start in Demo to review behavior and the execution chain. Demo fills and historical tests do not guarantee live outcomes. Risk controls do not make a strategy risk-free or guarantee a cap on realized loss.


Explore the browser-based strategy workflow at roboquant.dev. Broker fees and account requirements still apply.


#Roboquant #TradingAutomation #Backtesting #Tradovate

Profile picture
GabrielProfile picture@ventos99·Sep 29

ES or MES: contract sizing

One ES and one MES track the same index, but they do not carry the same dollar exposure.


ES: $50 per index point and $12.50 per 0.25-point tick. MES: $5 per point and $1.25 per tick. NQ: $20 per point and $5 per tick. MNQ: $2 per point and $0.50 per tick.


A 10-point adverse move on one ES represents $500 before costs; on one MES it represents $50. Ten MES contracts match one ES in point exposure, but fees, liquidity, fills and margin treatment can differ. A stop is not a guaranteed maximum loss.


Roboquant’s native engine uses instrument specifications in sizing and P&L calculations. Test the contract and quantity you actually intend to use, with the relevant costs and available history. MES and MNQ launched in May 2019; earlier ES history is not historical MES trading.


CME history access varies by plan and instrument. Explore at roboquant.dev.


#Roboquant #CME #MES #ES #FuturesTrading

Profile picture
GabrielProfile picture@ventos99·Sep 28

Explore parameter stability

The top-ranked parameter set is a starting point for investigation.


For example, three stop distances and three target distances create nine combinations. Define the range before the search, keep data, dates, size and costs comparable, and retain every trial.


If nearby settings behave very differently, investigate sensitivity. A broad area of acceptable results can be more informative than one isolated winner, but apparent stability still does not prove an edge. Searching more trials also creates more opportunities to select luck.


Roboquant’s integrated optimizer runs parameter trials and keeps results connected to the strategy. Supported plans provide IS/OOS or walk-forward validation so you can examine held-out performance too.


Explore Optimize at roboquant.dev. Search modes, trial limits and validation access vary by plan. The visuals are conceptual; no platform performance results are invented.


#Roboquant #Optimization #Backtesting #QuantResearch

Profile picture
GabrielProfile picture@ventos99·Sep 27

Validate beyond the tuning period

An impressive backtest can be a fit to the past.


Separate the period used to develop the strategy from a later period reserved for evaluation. Define that split before searching parameters, freeze the strategy, and compare the held-out result with the training result. If you keep revising the strategy after looking at the held-out data, that period is influencing development too.


Roboquant provides IS/OOS controls and training-versus-test statistics in the optimizer. Eligible plans also support rolling walk-forward validation. Supported modes and combinations vary by plan.


Read more than profit: look at drawdown, trade count, costs, market conditions and the number of experiments you tried. A holdout is useful evidence, not proof that a strategy will work live.


Explore the strategy workflow at roboquant.dev.


#Roboquant #Backtesting #Overfitting #StrategyValidation