


API Dashboard – Excel & Sheets
Analyze API Errors, Latency & Service Health — In One Clear Dashboard
🧠 API DASHBOARD FOR EXCEL & GOOGLE SHEETS
Turn raw API log data into clear KPIs, trends and performance insights — without macros, VBA or external connections.
📊 MAIN API DASHBOARD
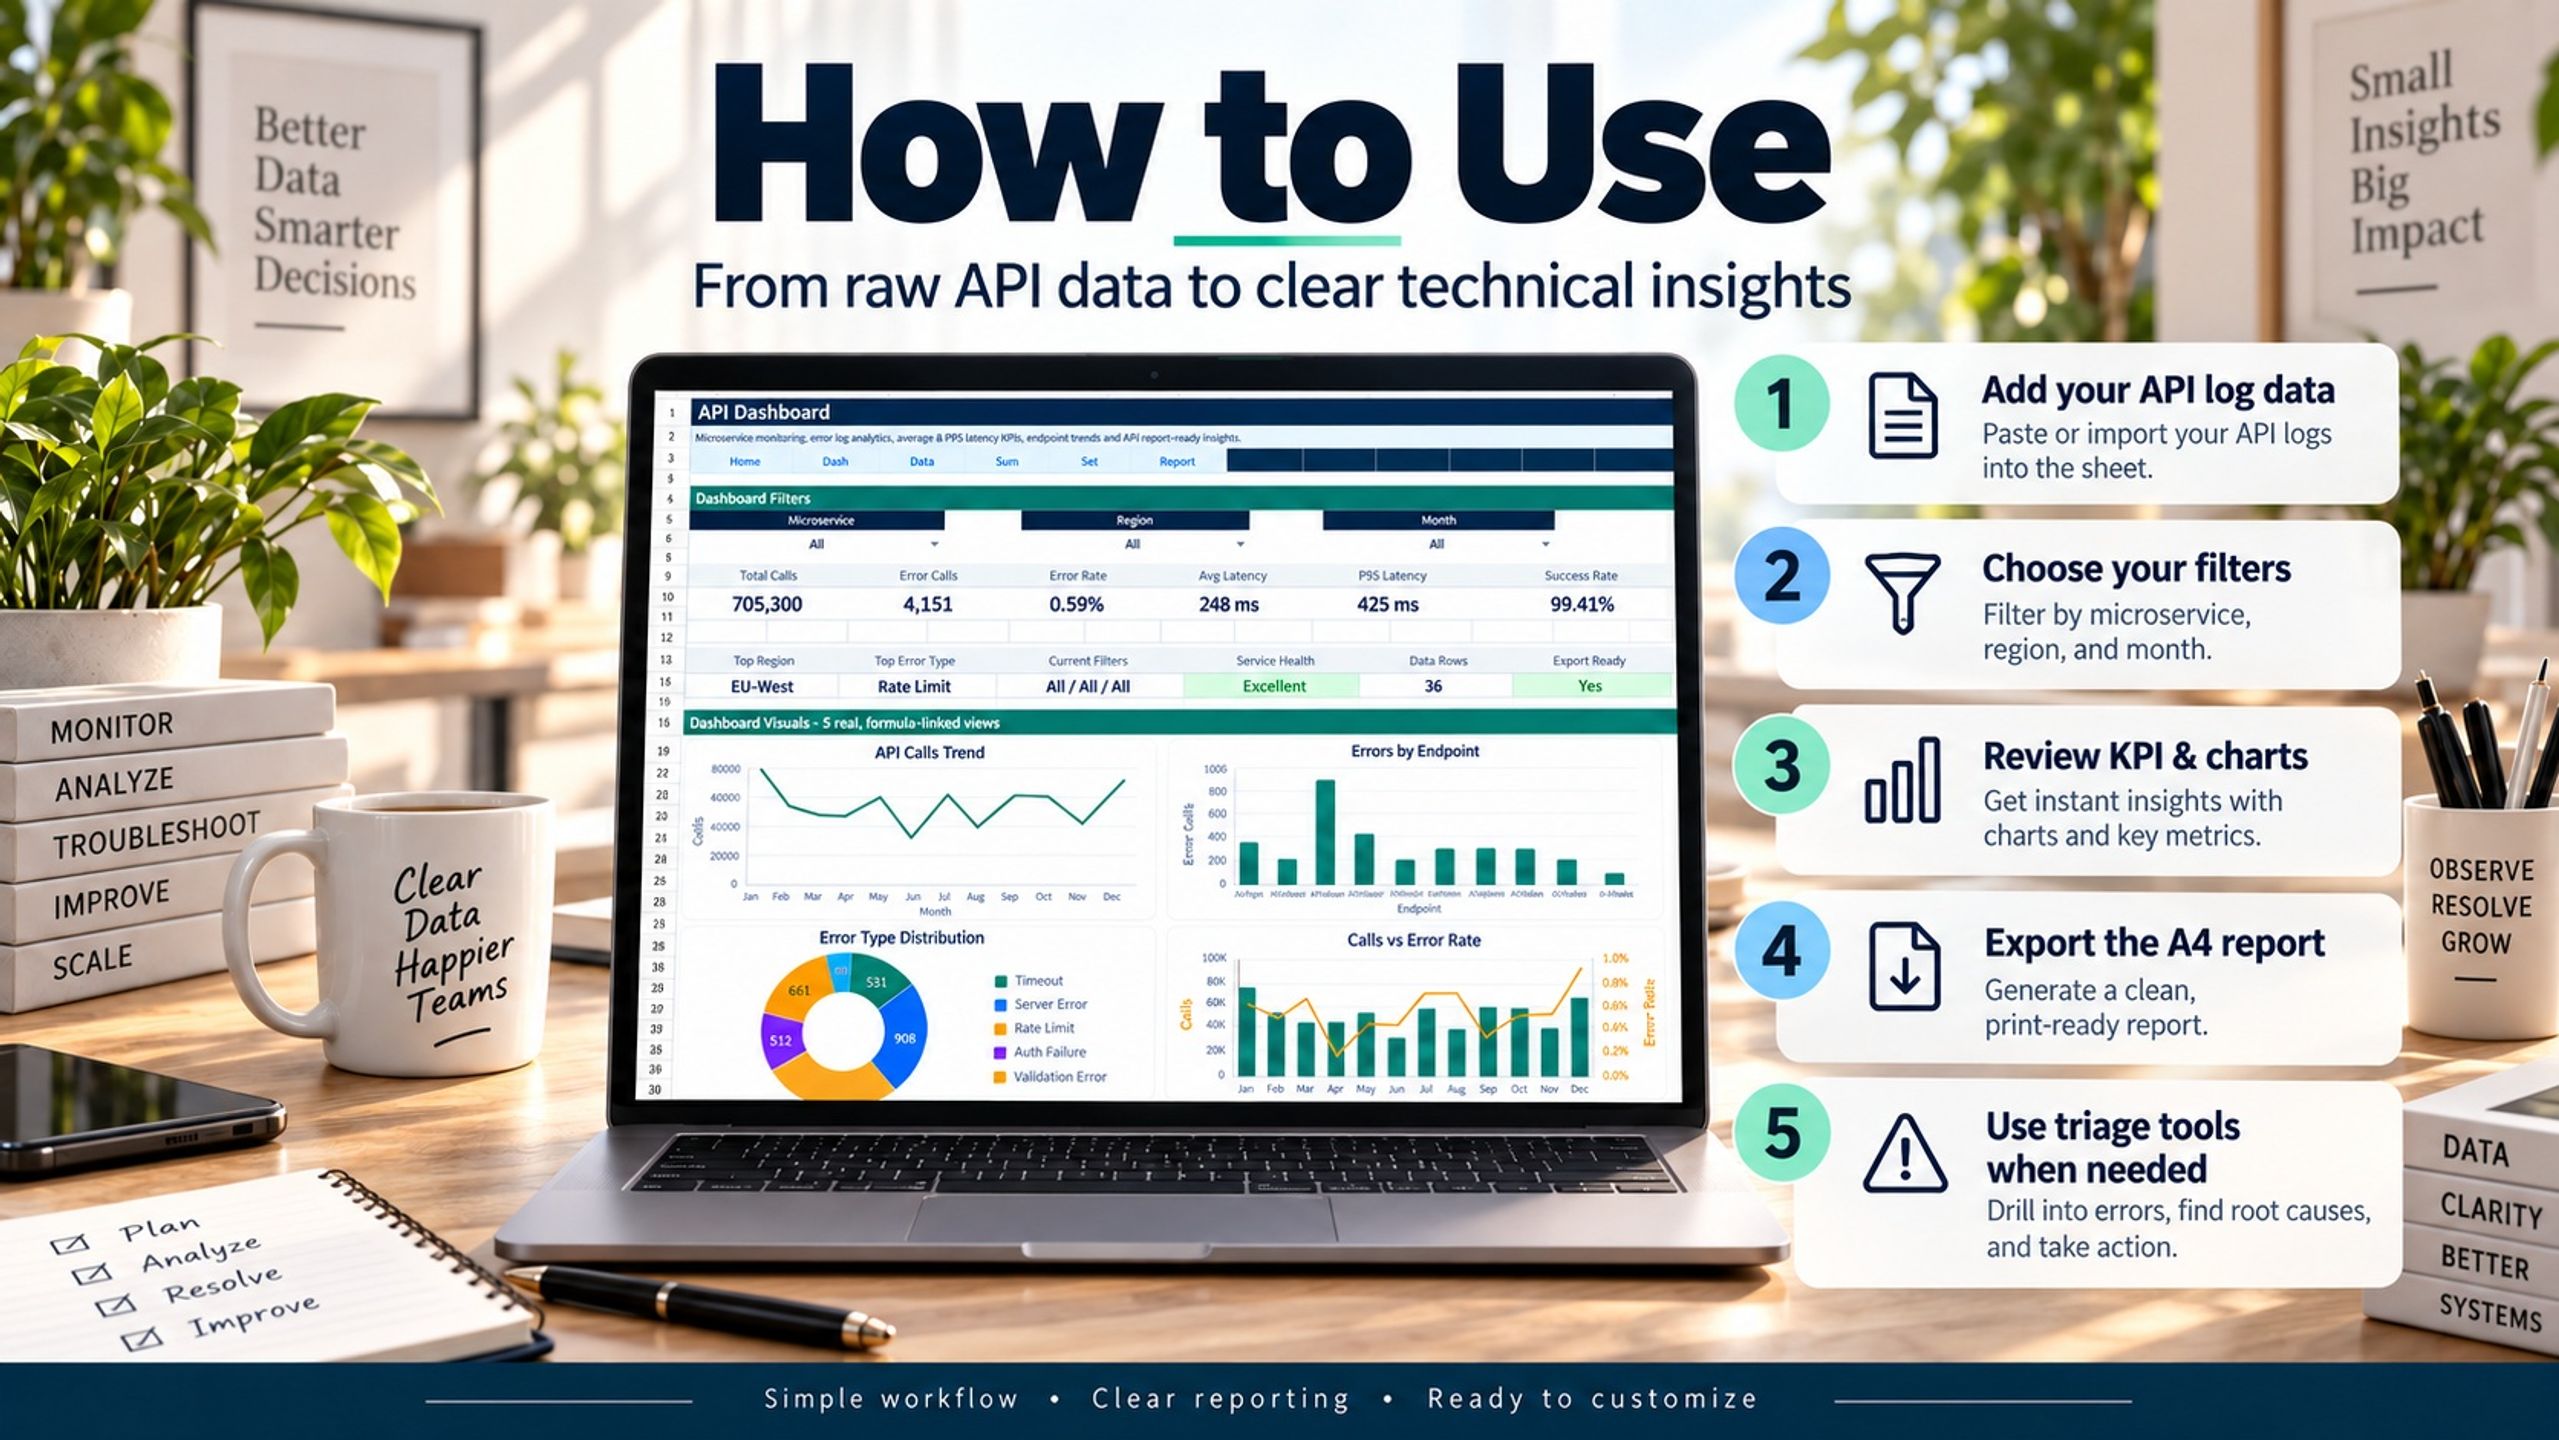
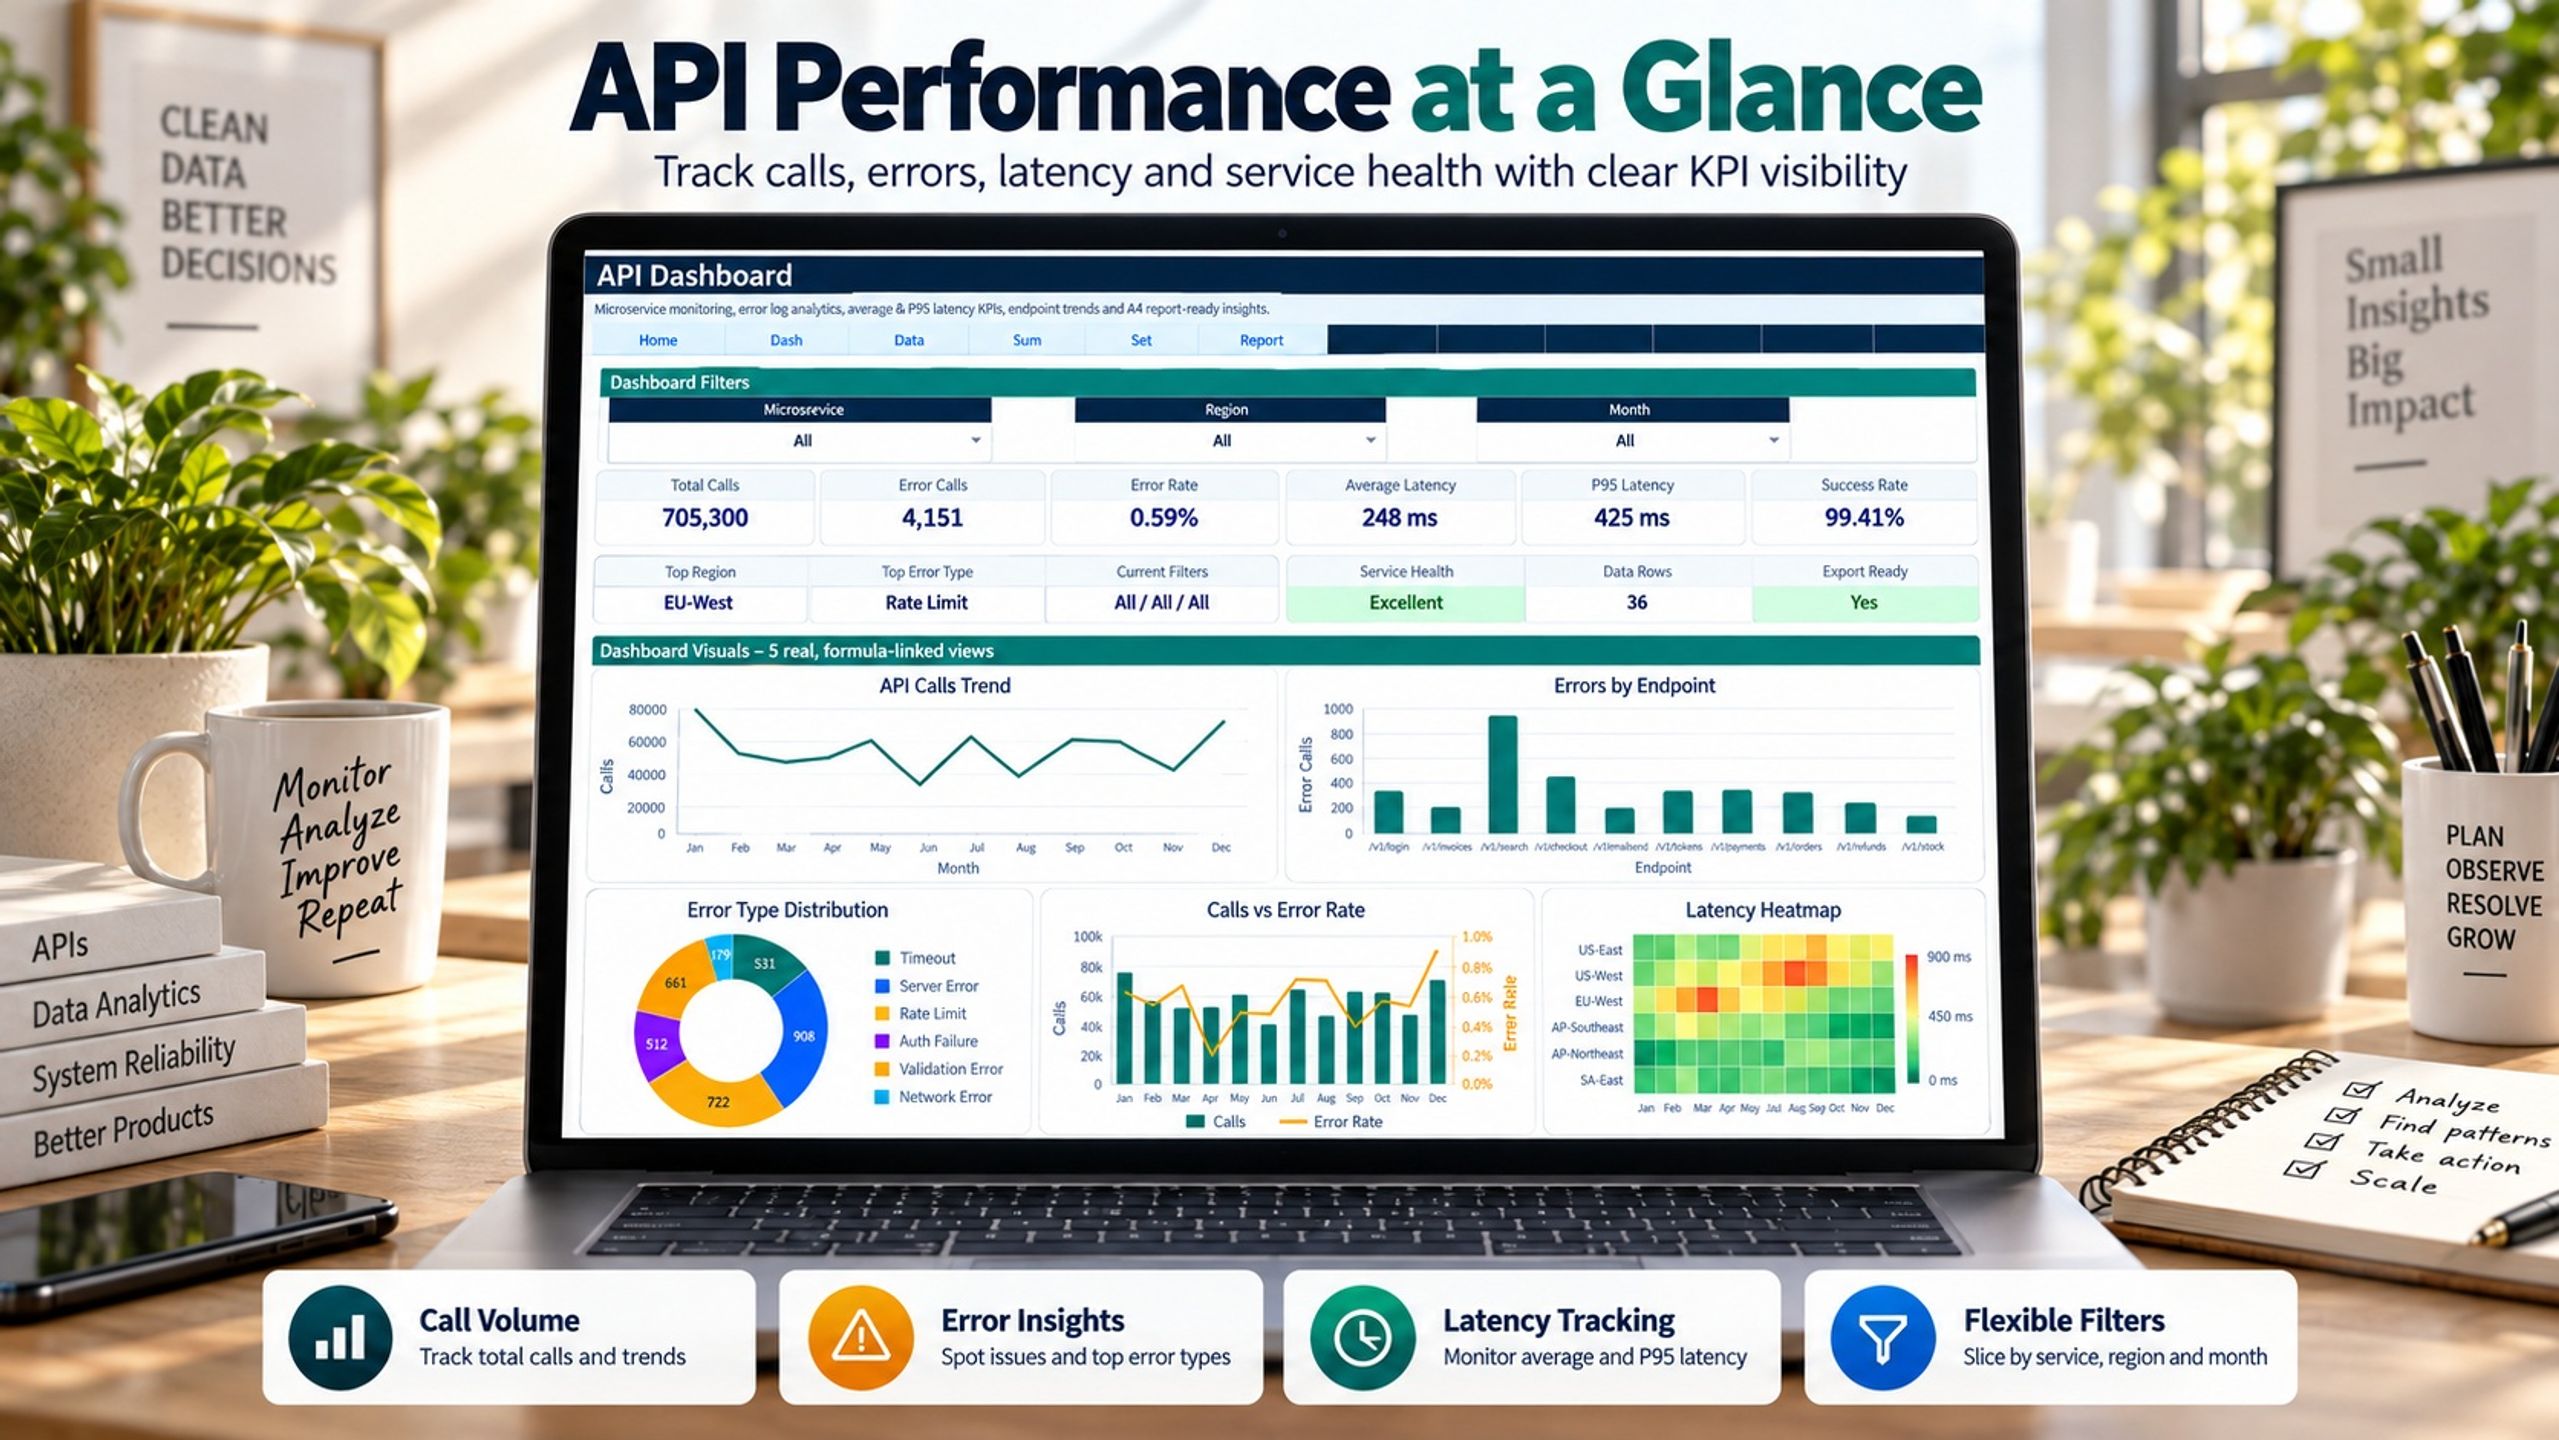
Filter your data by:
• Microservice
• Region
• Month
Track key KPIs including:
• Total Calls
• Error Calls
• Error Rate
• Average Latency
• P95 Latency
• Success Rate
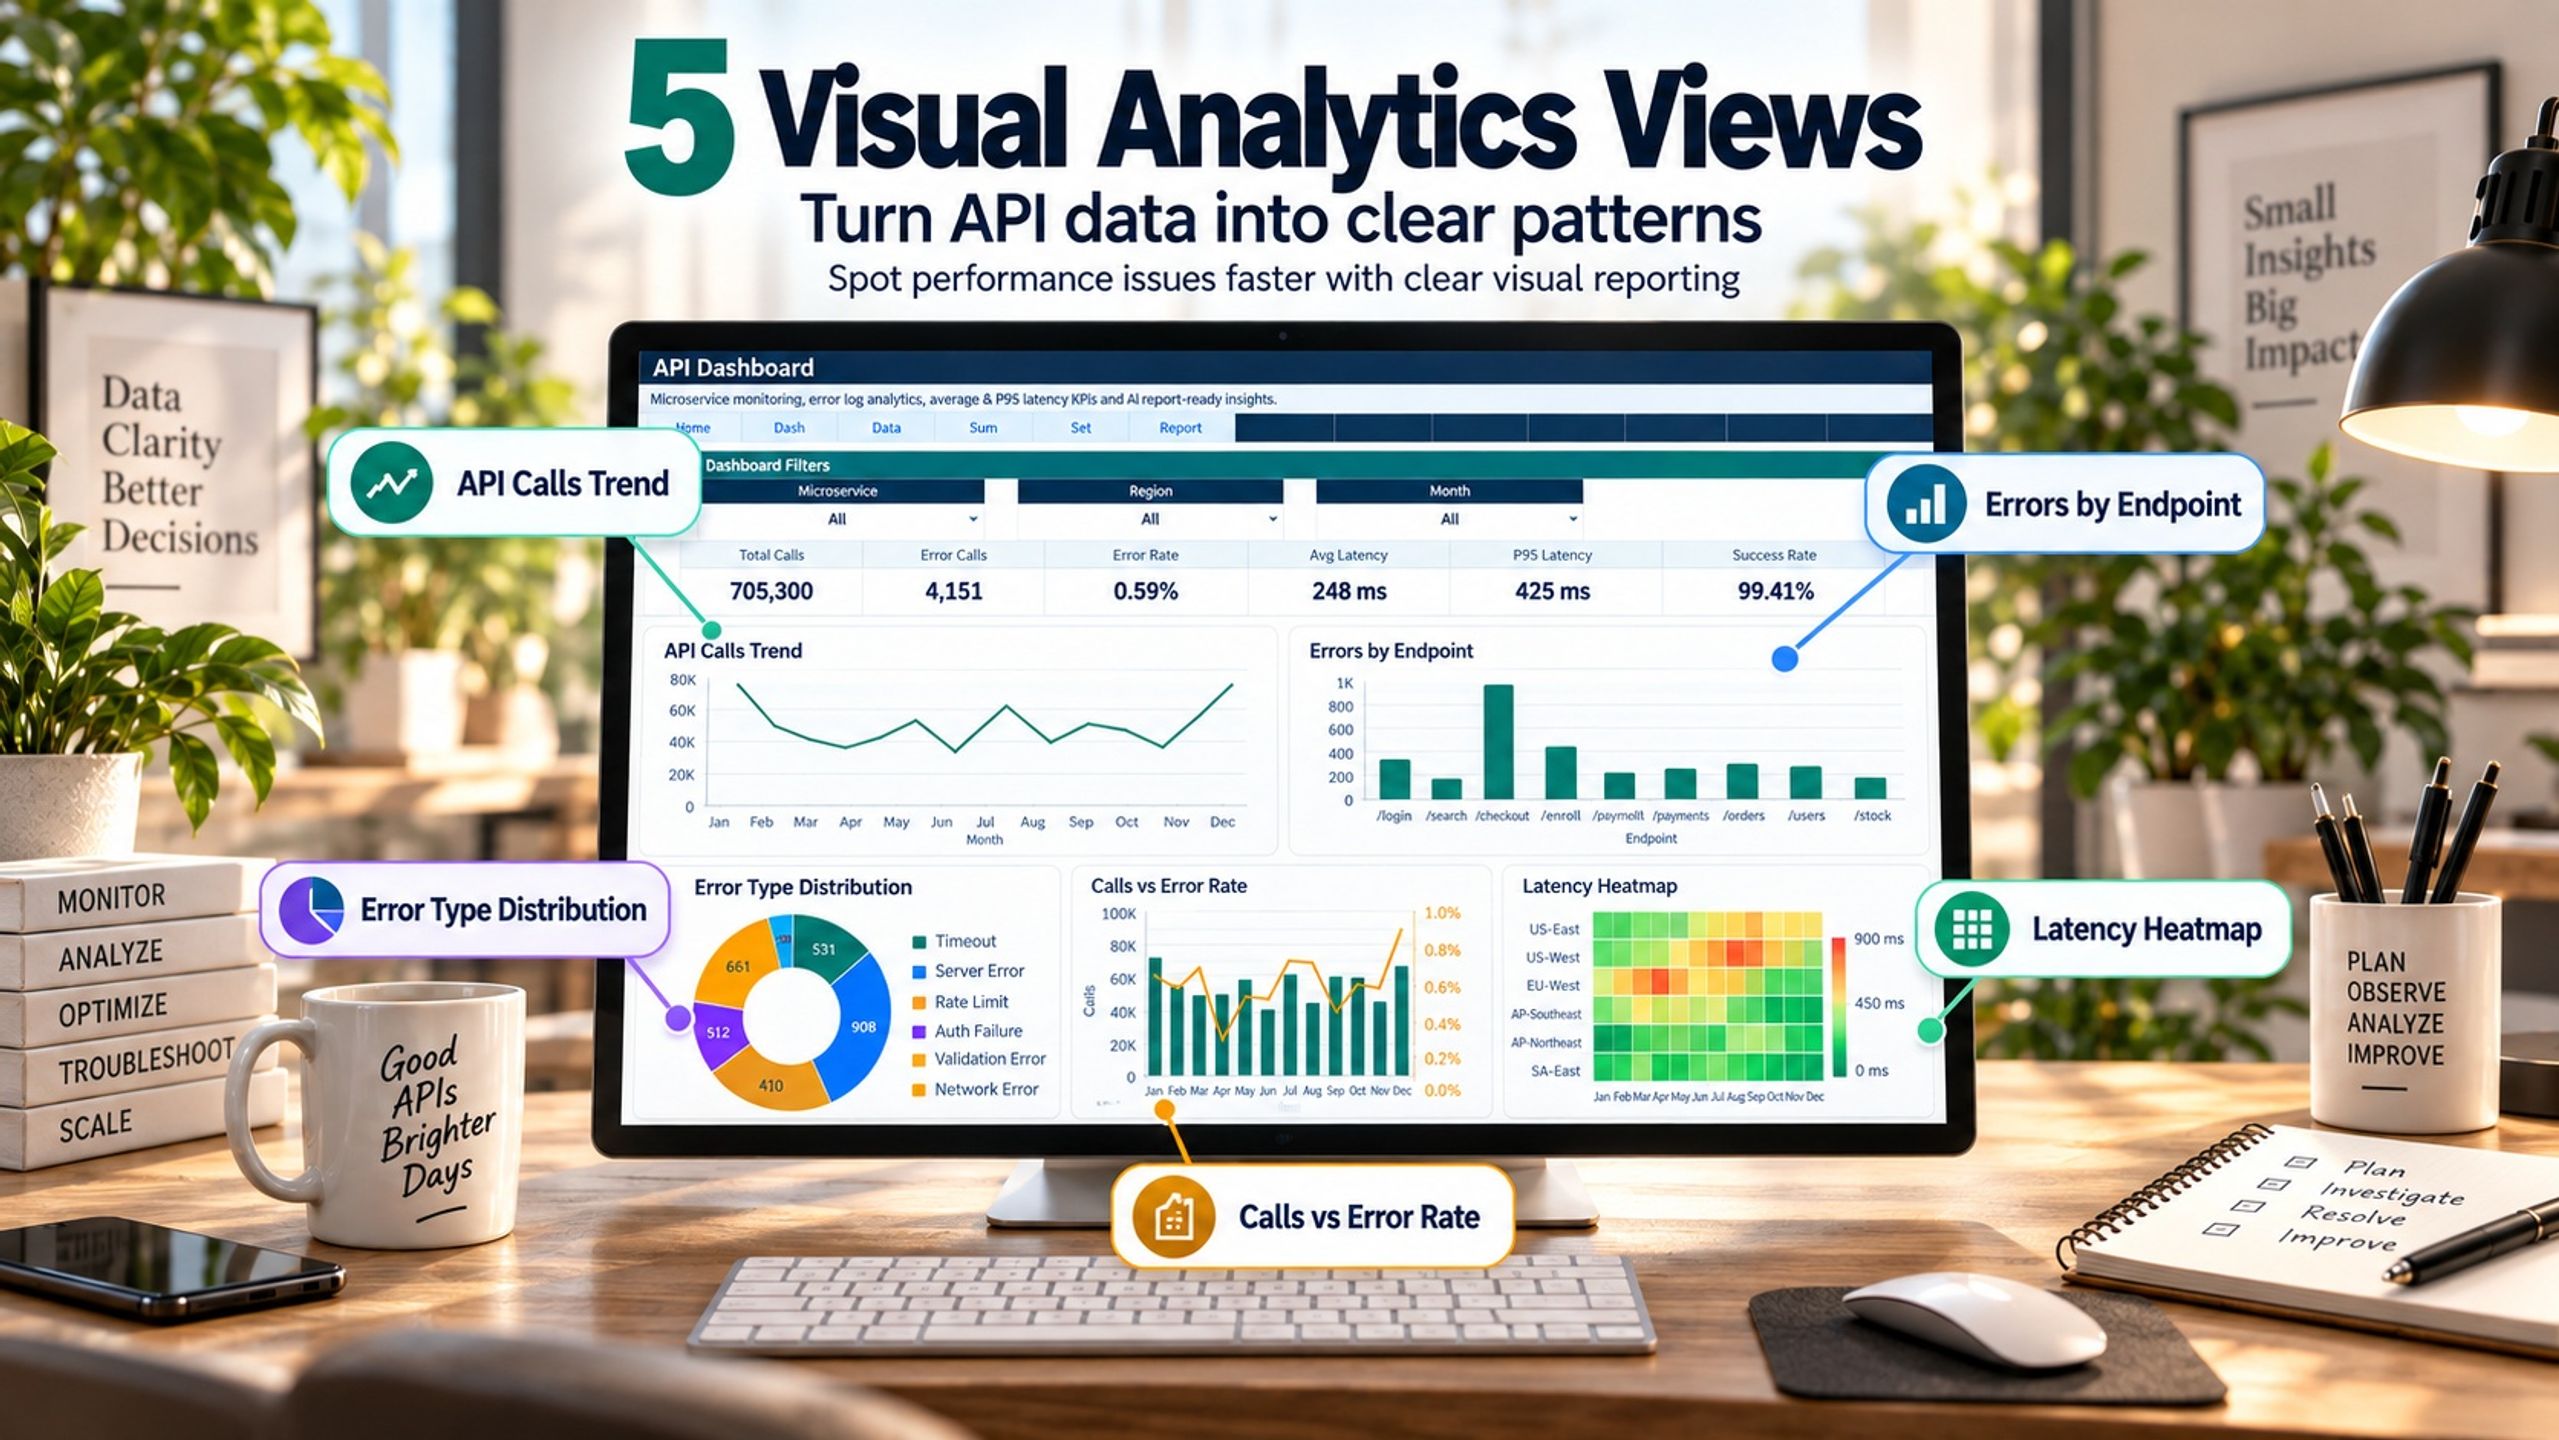
📈 VISUAL ANALYTICS
• API Calls Trend
• Errors by Endpoint
• Error Type Distribution
• Calls vs Error Rate
• Latency Heatmap
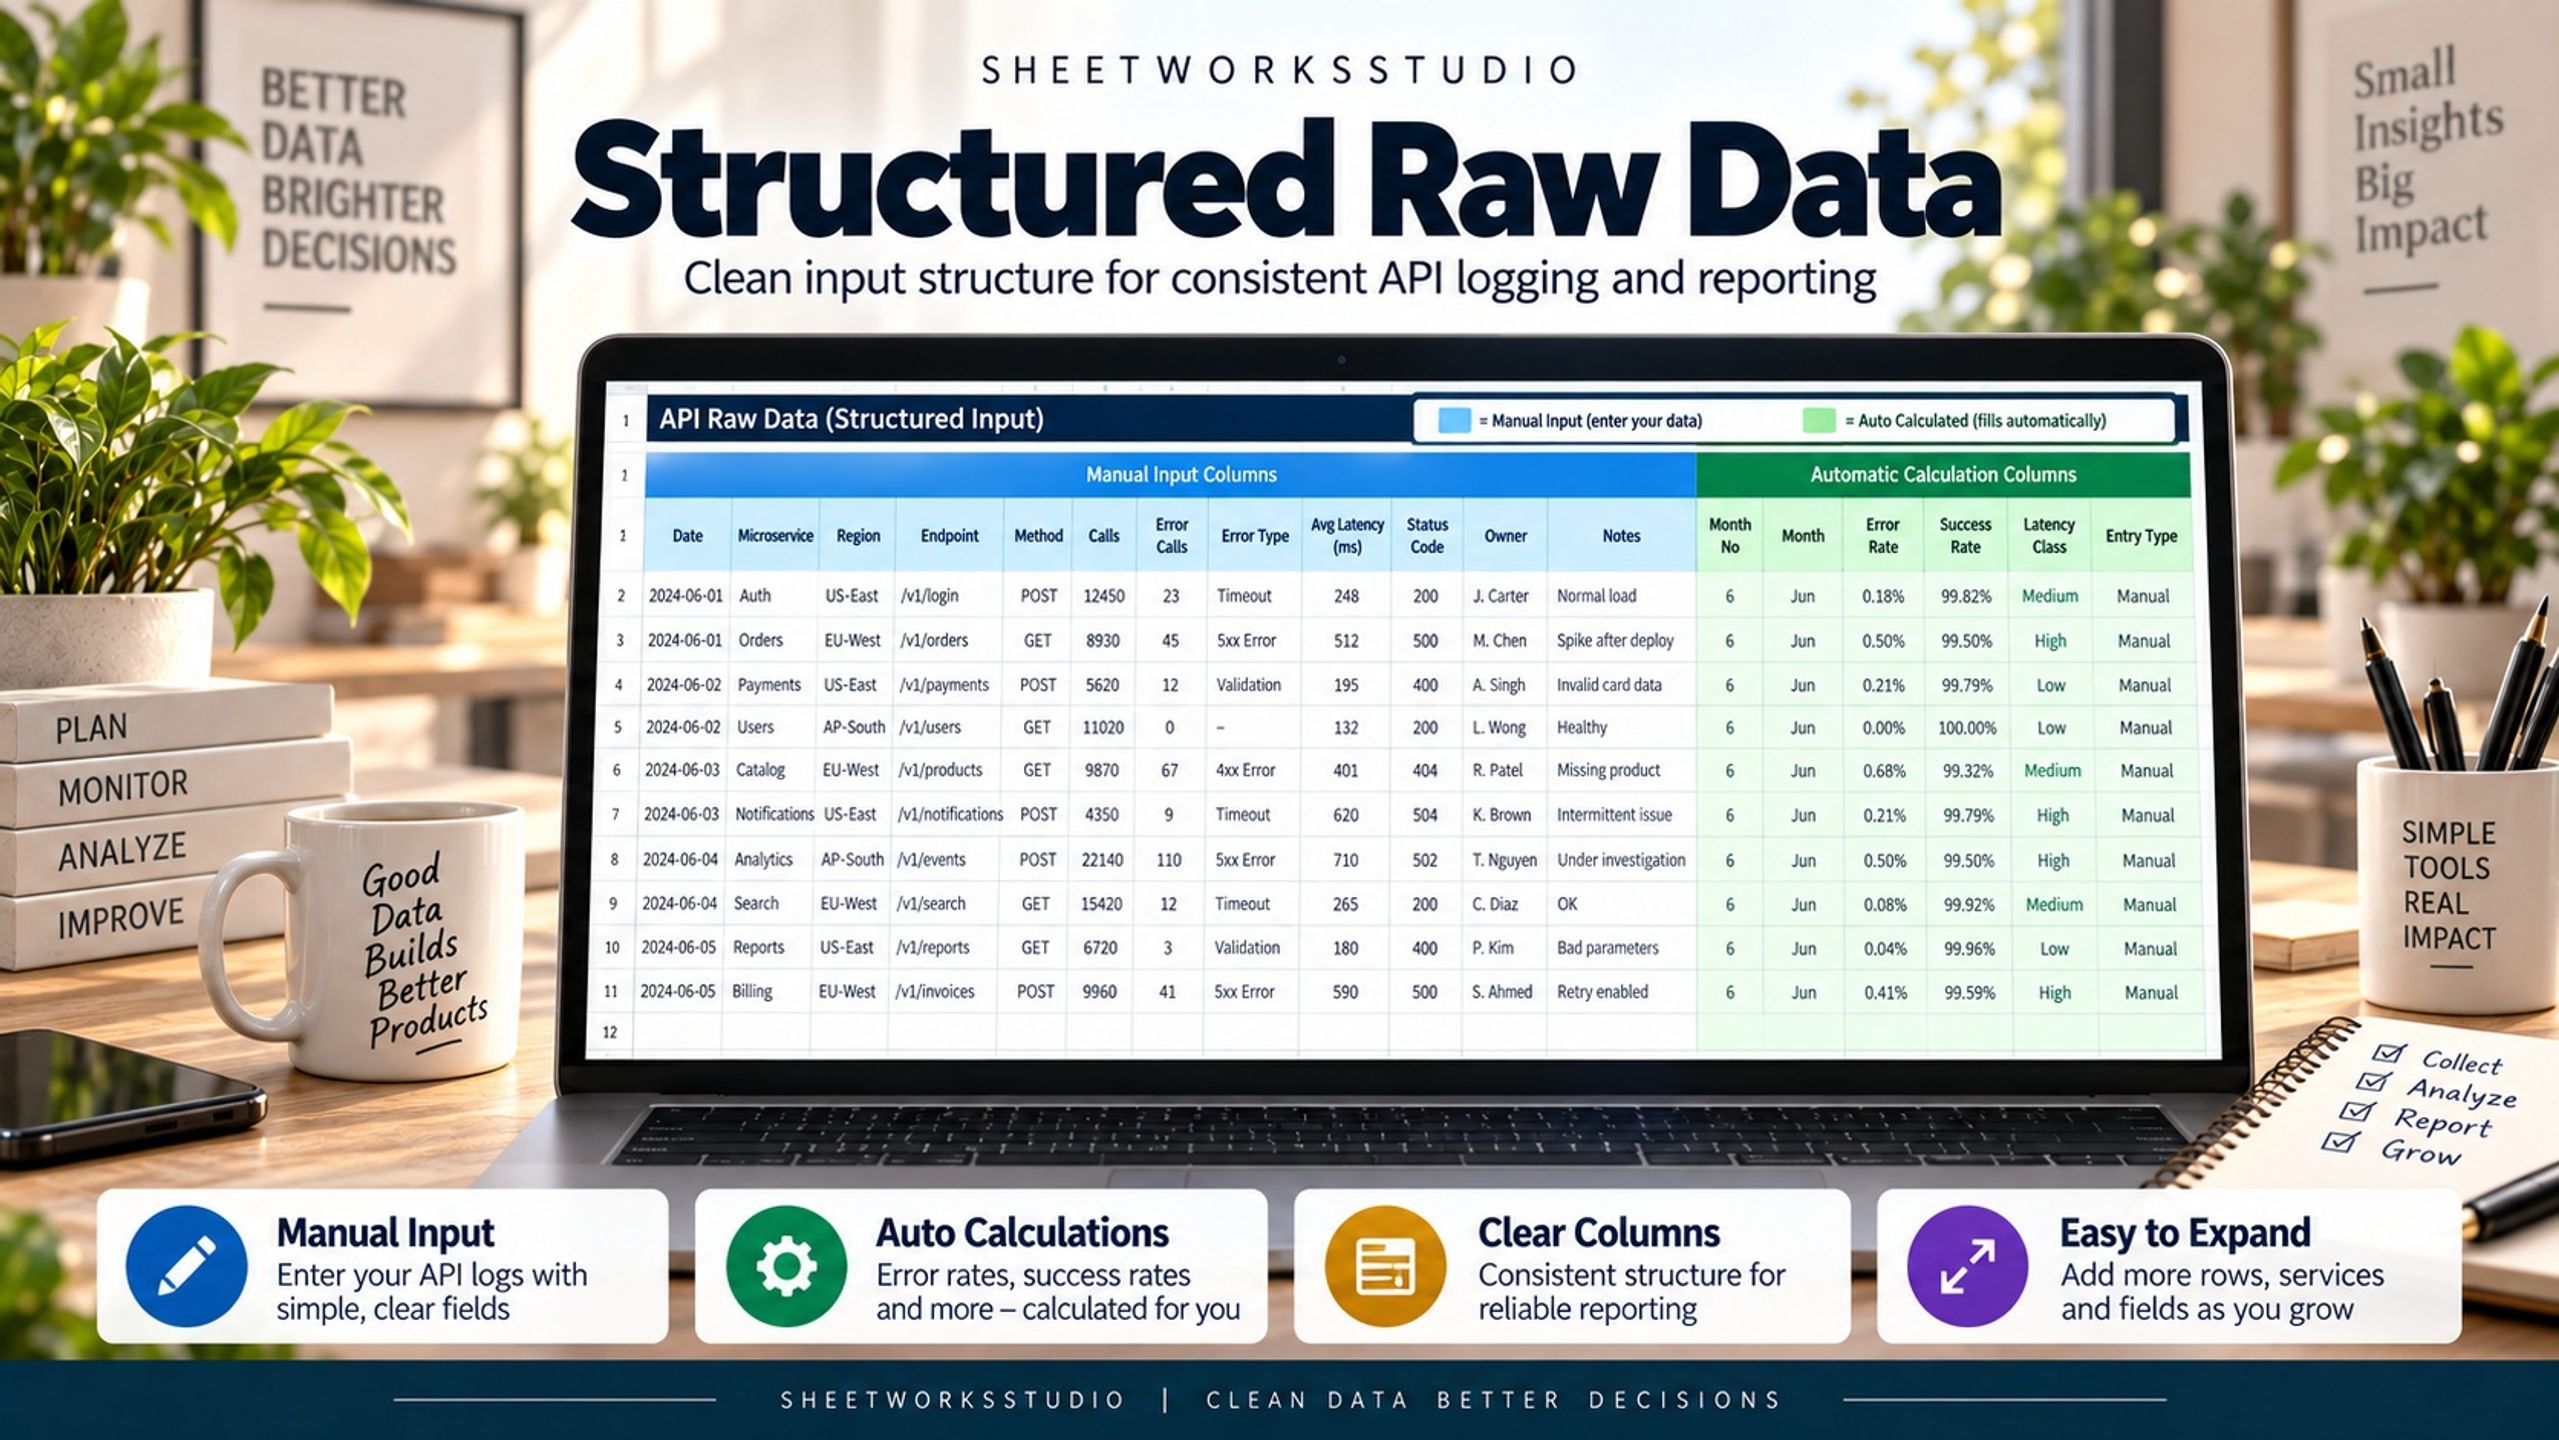
🗂️ STRUCTURED RAW DATA
Enter dates, services, regions, endpoints, methods, calls, errors, latency, status codes, owners and notes. Formula fields automatically calculate metrics such as error rate, success rate and latency class.
📄 A4-READY REPORT SHEET
Create a compact reporting view for meetings, technical reviews and internal documentation.
🎁 BONUS: API INCIDENT TRIAGE KIT
Includes:
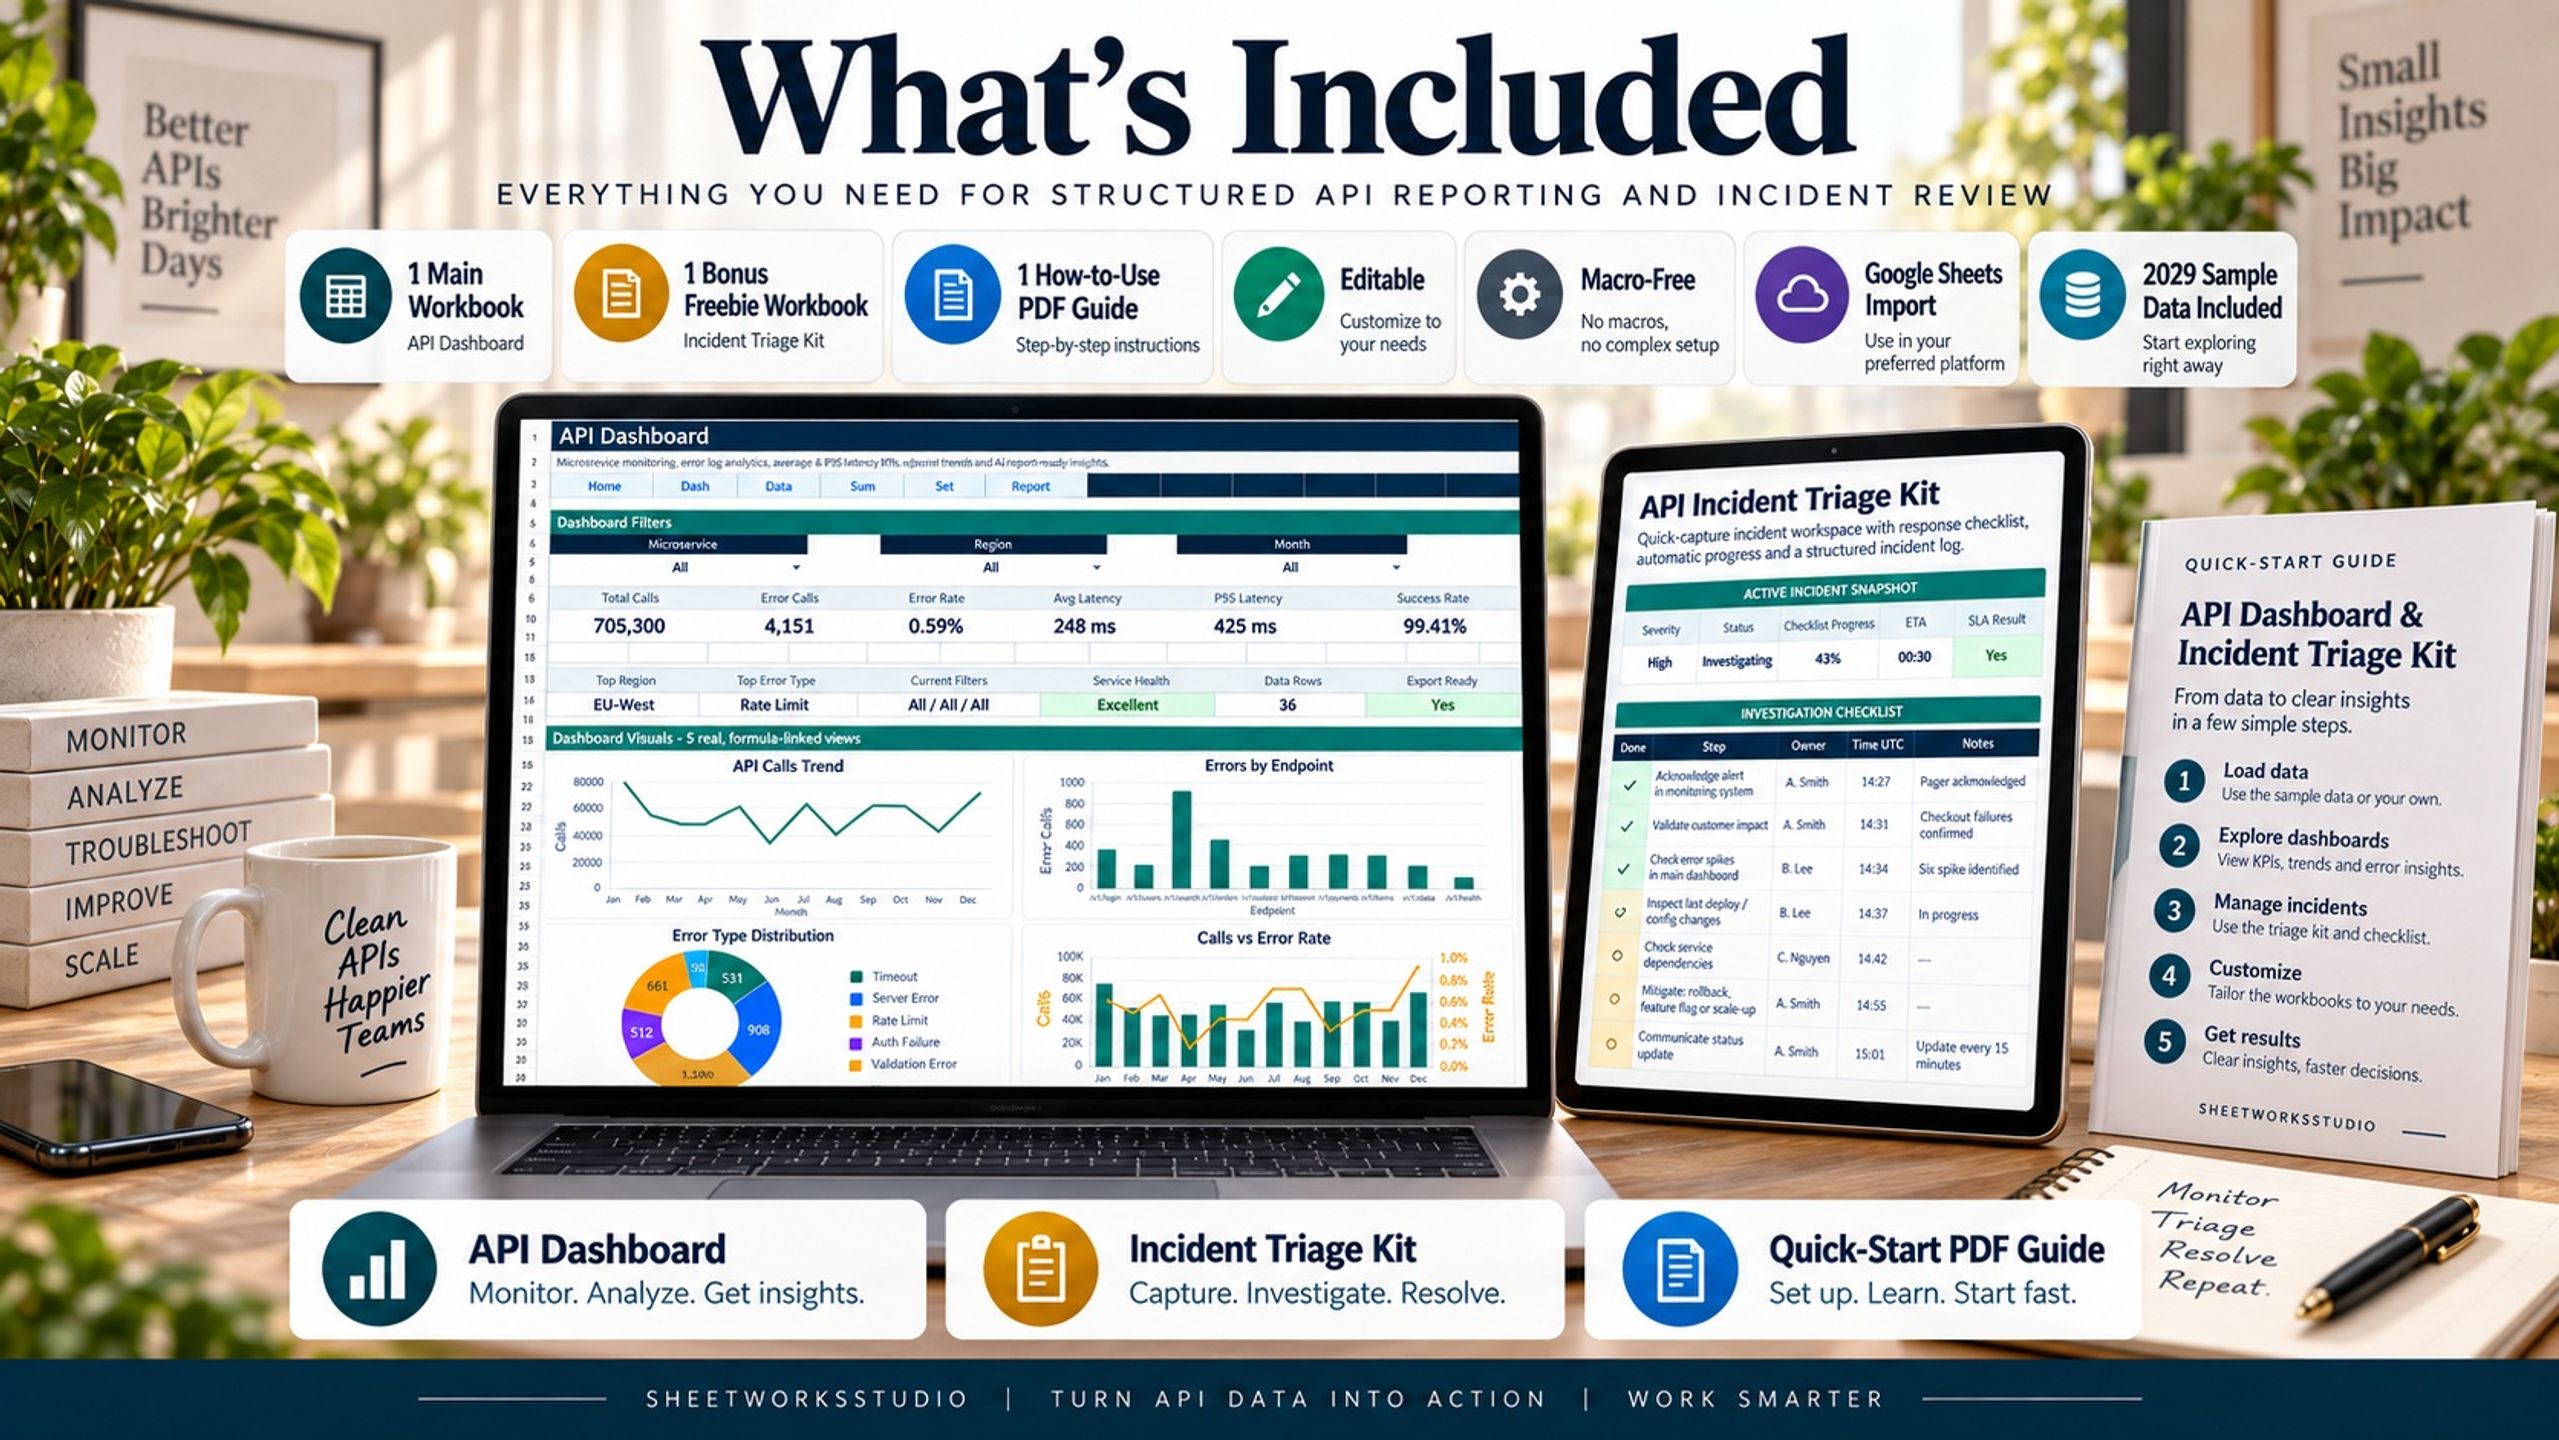
• Incident Triage Board
• Investigation Checklist
• Incident Log
• SLA / Uptime Calculator
• Monthly SLA Snapshot
📘 ALSO INCLUDED
• Main API Dashboard workbook
• Bonus Incident Triage workbook
• 8-page How-to-Use PDF Guide
• Realistic sample data
✅ Macro-free
✅ No VBA
✅ No external data connection
✅ Google Sheets compatible after import
Microsoft Excel provides the best visual experience.
⚠️ Spreadsheet template only. Not a live monitoring platform, SLA guarantee or professional technical, legal or regulatory advice.