SlipMint Ecom

Master e-commerce & dropshipping from zero to profitable store. Step-by-step courses, live mentorship, and a community of driven entrepreneu...
Abuja, NG
•
•Created byProfile pictureHassan Luckman
3 joined
Profile picture
Hassan LuckmanProfile picture@luckmanworldĀ·Aug 5

I've been testing this trading strategy on Forex and Gold (XAUUSD), and it has helped improve my discipline and trading process.


If you're looking to start your trading journey, you can create an Exness account using my referral link:


šŸ”—


After signing up, join my free Telegram community for market updates, trading ideas, and educational content:


šŸ“²


Whether you're a beginner or experienced trader, you're welcome to join.


āš ļø Trading involves risk. This post is for educational purposes only and is not financial advice.

Profile picture
soggymisuse17Profile picture@slipmintcorĀ·Jun 25

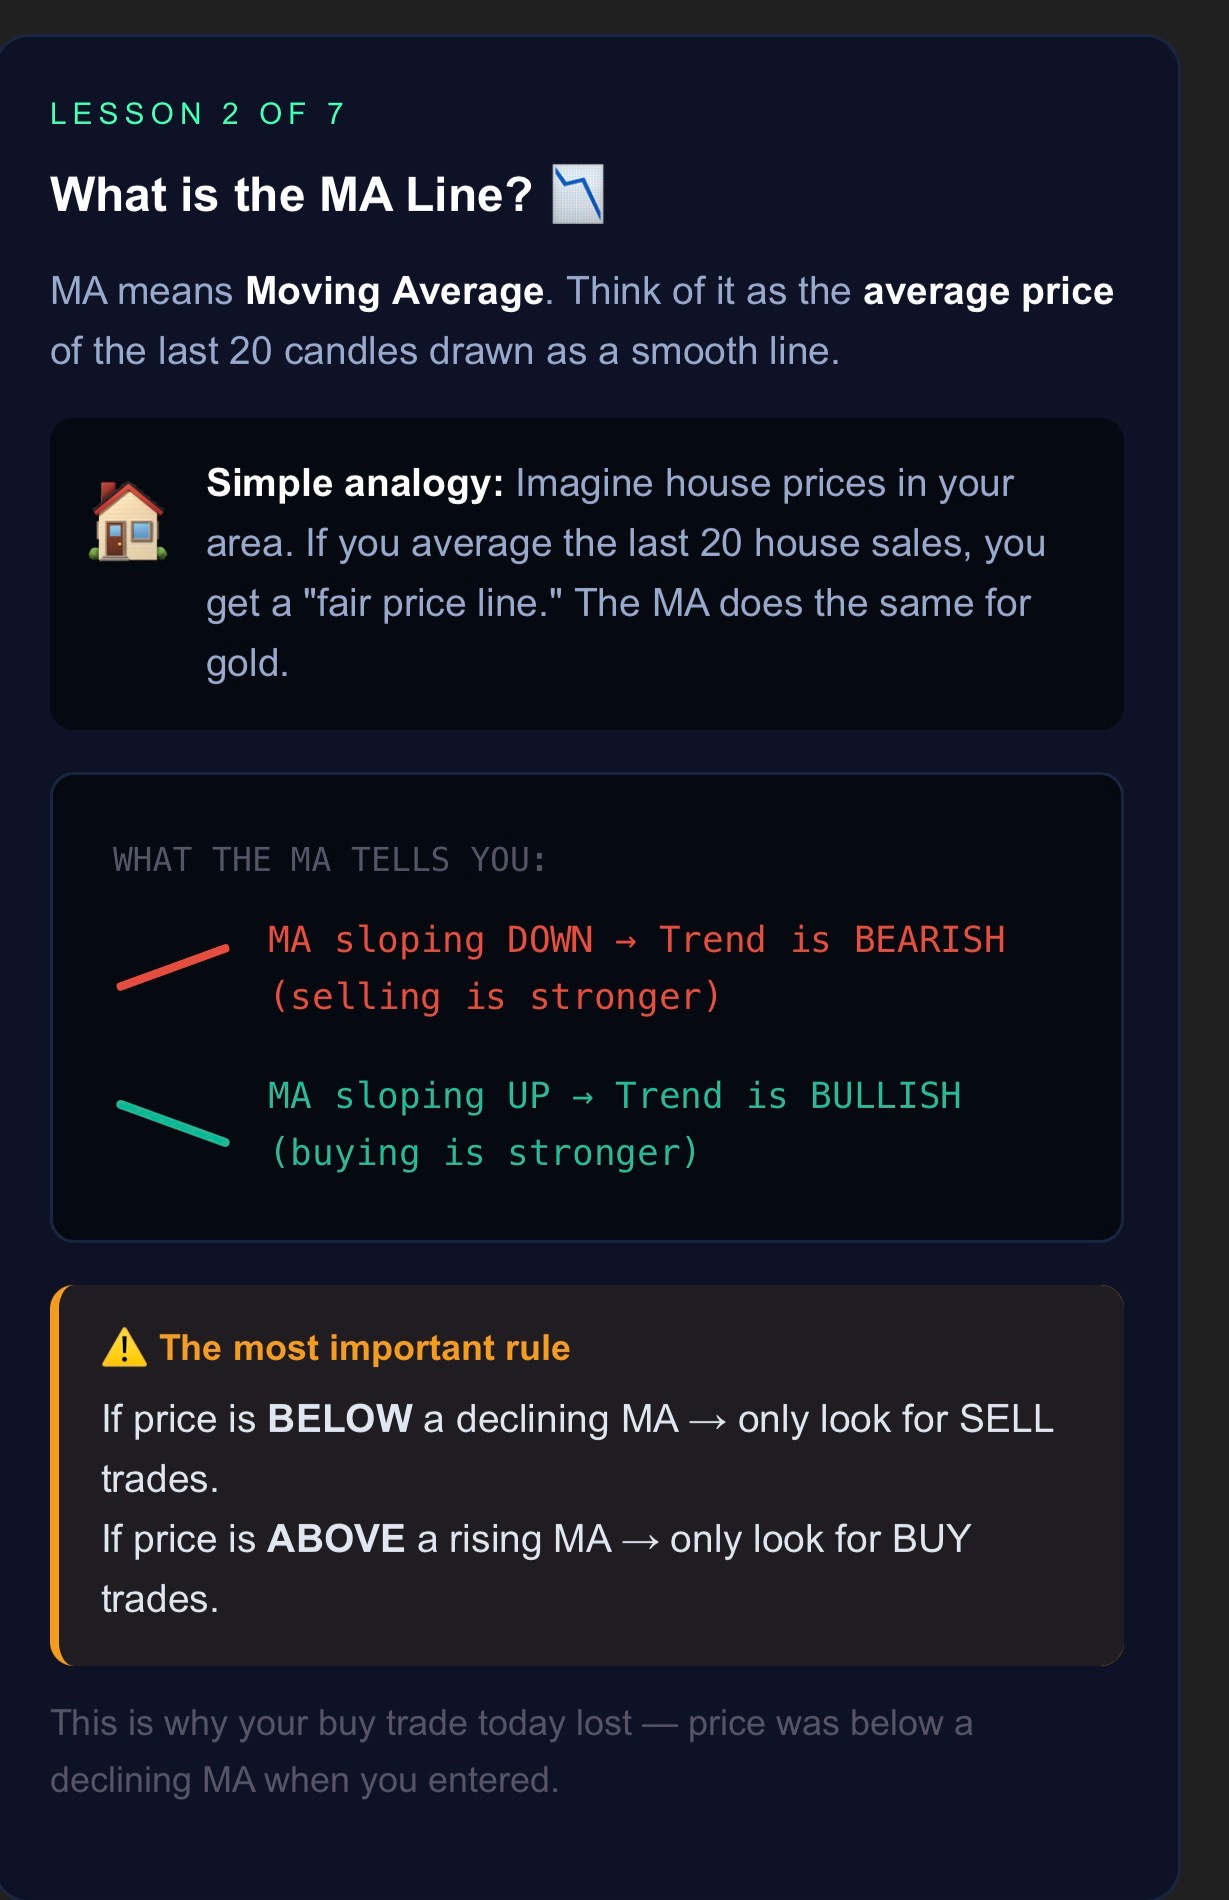
šŸ“‰ LESSON 2 | The Moving Average (MA)


That red curved line on your chart? That's the MA.


It shows the average price of the last 20 candles.


Here's how to read it:


ā†˜ļø MA sloping DOWN = Bearish trend → only SELL

ā†—ļø MA sloping UP = Bullish trend → only BUY


āš ļø Golden rule:

Price BELOW a declining MA = never buy

Price ABOVE a rising MA = never sell


file_ISMOKSciNnG34
Profile picture
Really Deally @foreverlitĀ·Jun 25

For founders, executives, innovators, and future industry leaders.

The Innovator's Blueprint is an advanced business transformation program designed to teach the principles behind innovation, strategic growth, organizational scaling, and institutional excellence.

If you're serious about building something that lasts, this is your roadmap.

šŸ”¹ Think strategically

šŸ”¹ Execute systematically

šŸ”¹ Scale intelligently

šŸ”¹ Lead transformational change

Your next level begins here.

https://whop.com/flowify-1c4d/innovator-s-blueprint/

Profile picture
Hassan LuckmanProfile picture@luckmanworldĀ·Jun 25

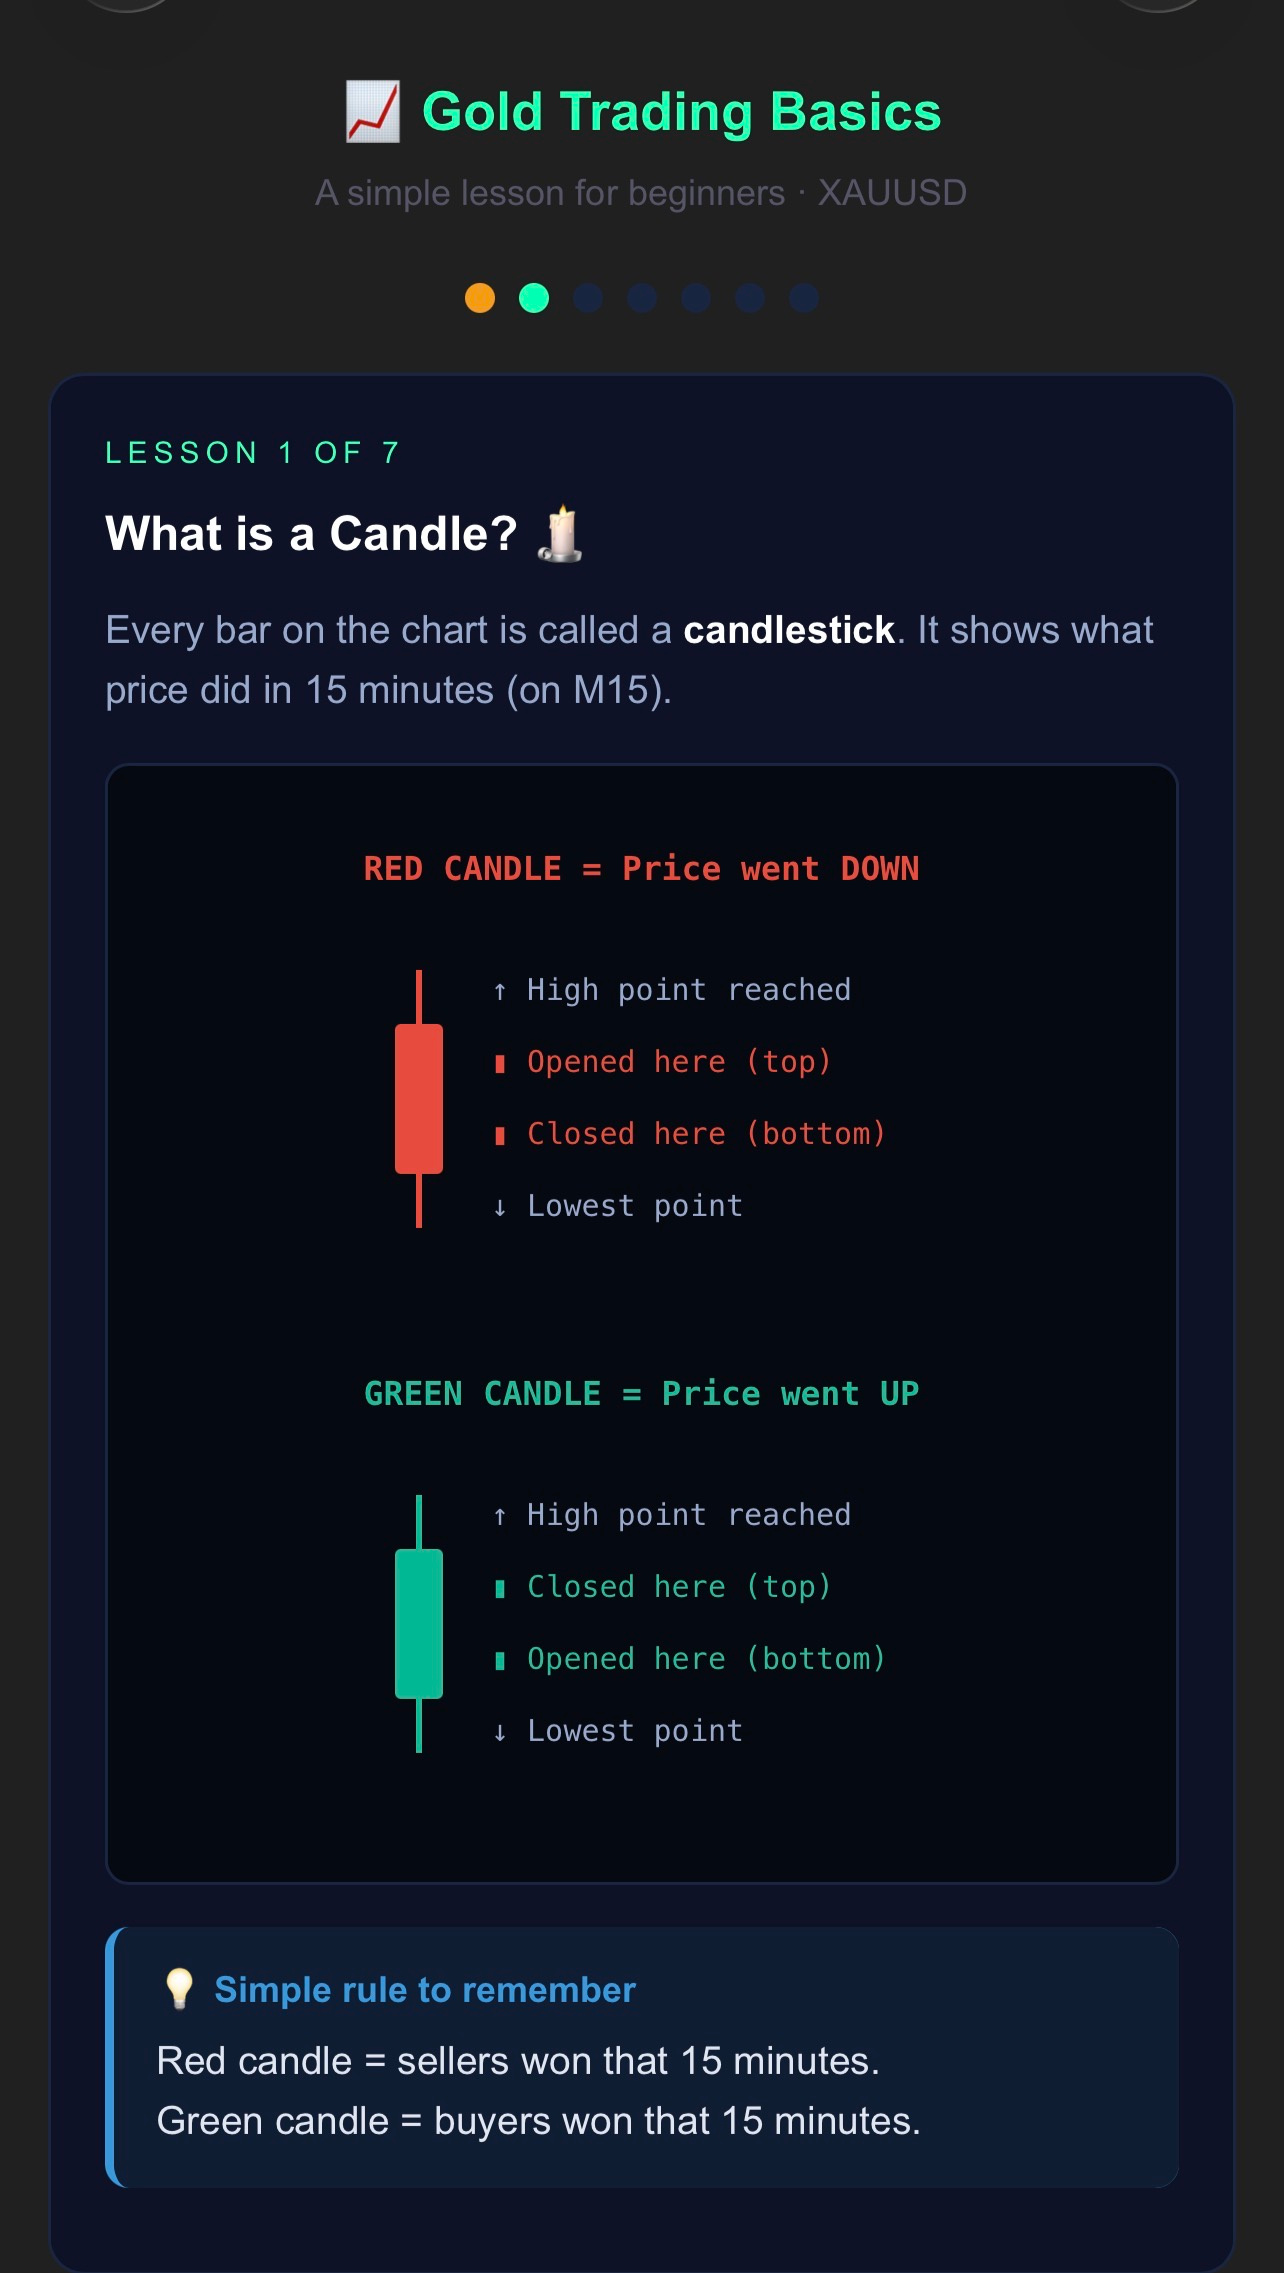
šŸ•Æļø LESSON 1 | What is a Candlestick?


Every bar on your gold chart tells a story.


šŸ”“ Red candle = price went DOWN

🟢 Green candle = price went UP


The body shows where price opened & closed.

The thin line (wick) shows the highest & lowest point.


Simple rule:

Red = sellers won that 15 minutes

Green = buyers won that 15 minutes


šŸ“Š This is the foundation of reading any chart.

—

file_h4OV76wx8ucQl