
CRT
$10/ month
2 members
CRT, Done-For-You: Auto-Map HTF Candle Ranges, Bias Shifts & Execution Zones
Got you — same structure, same tone, but cleanly adapted to CRT 👇
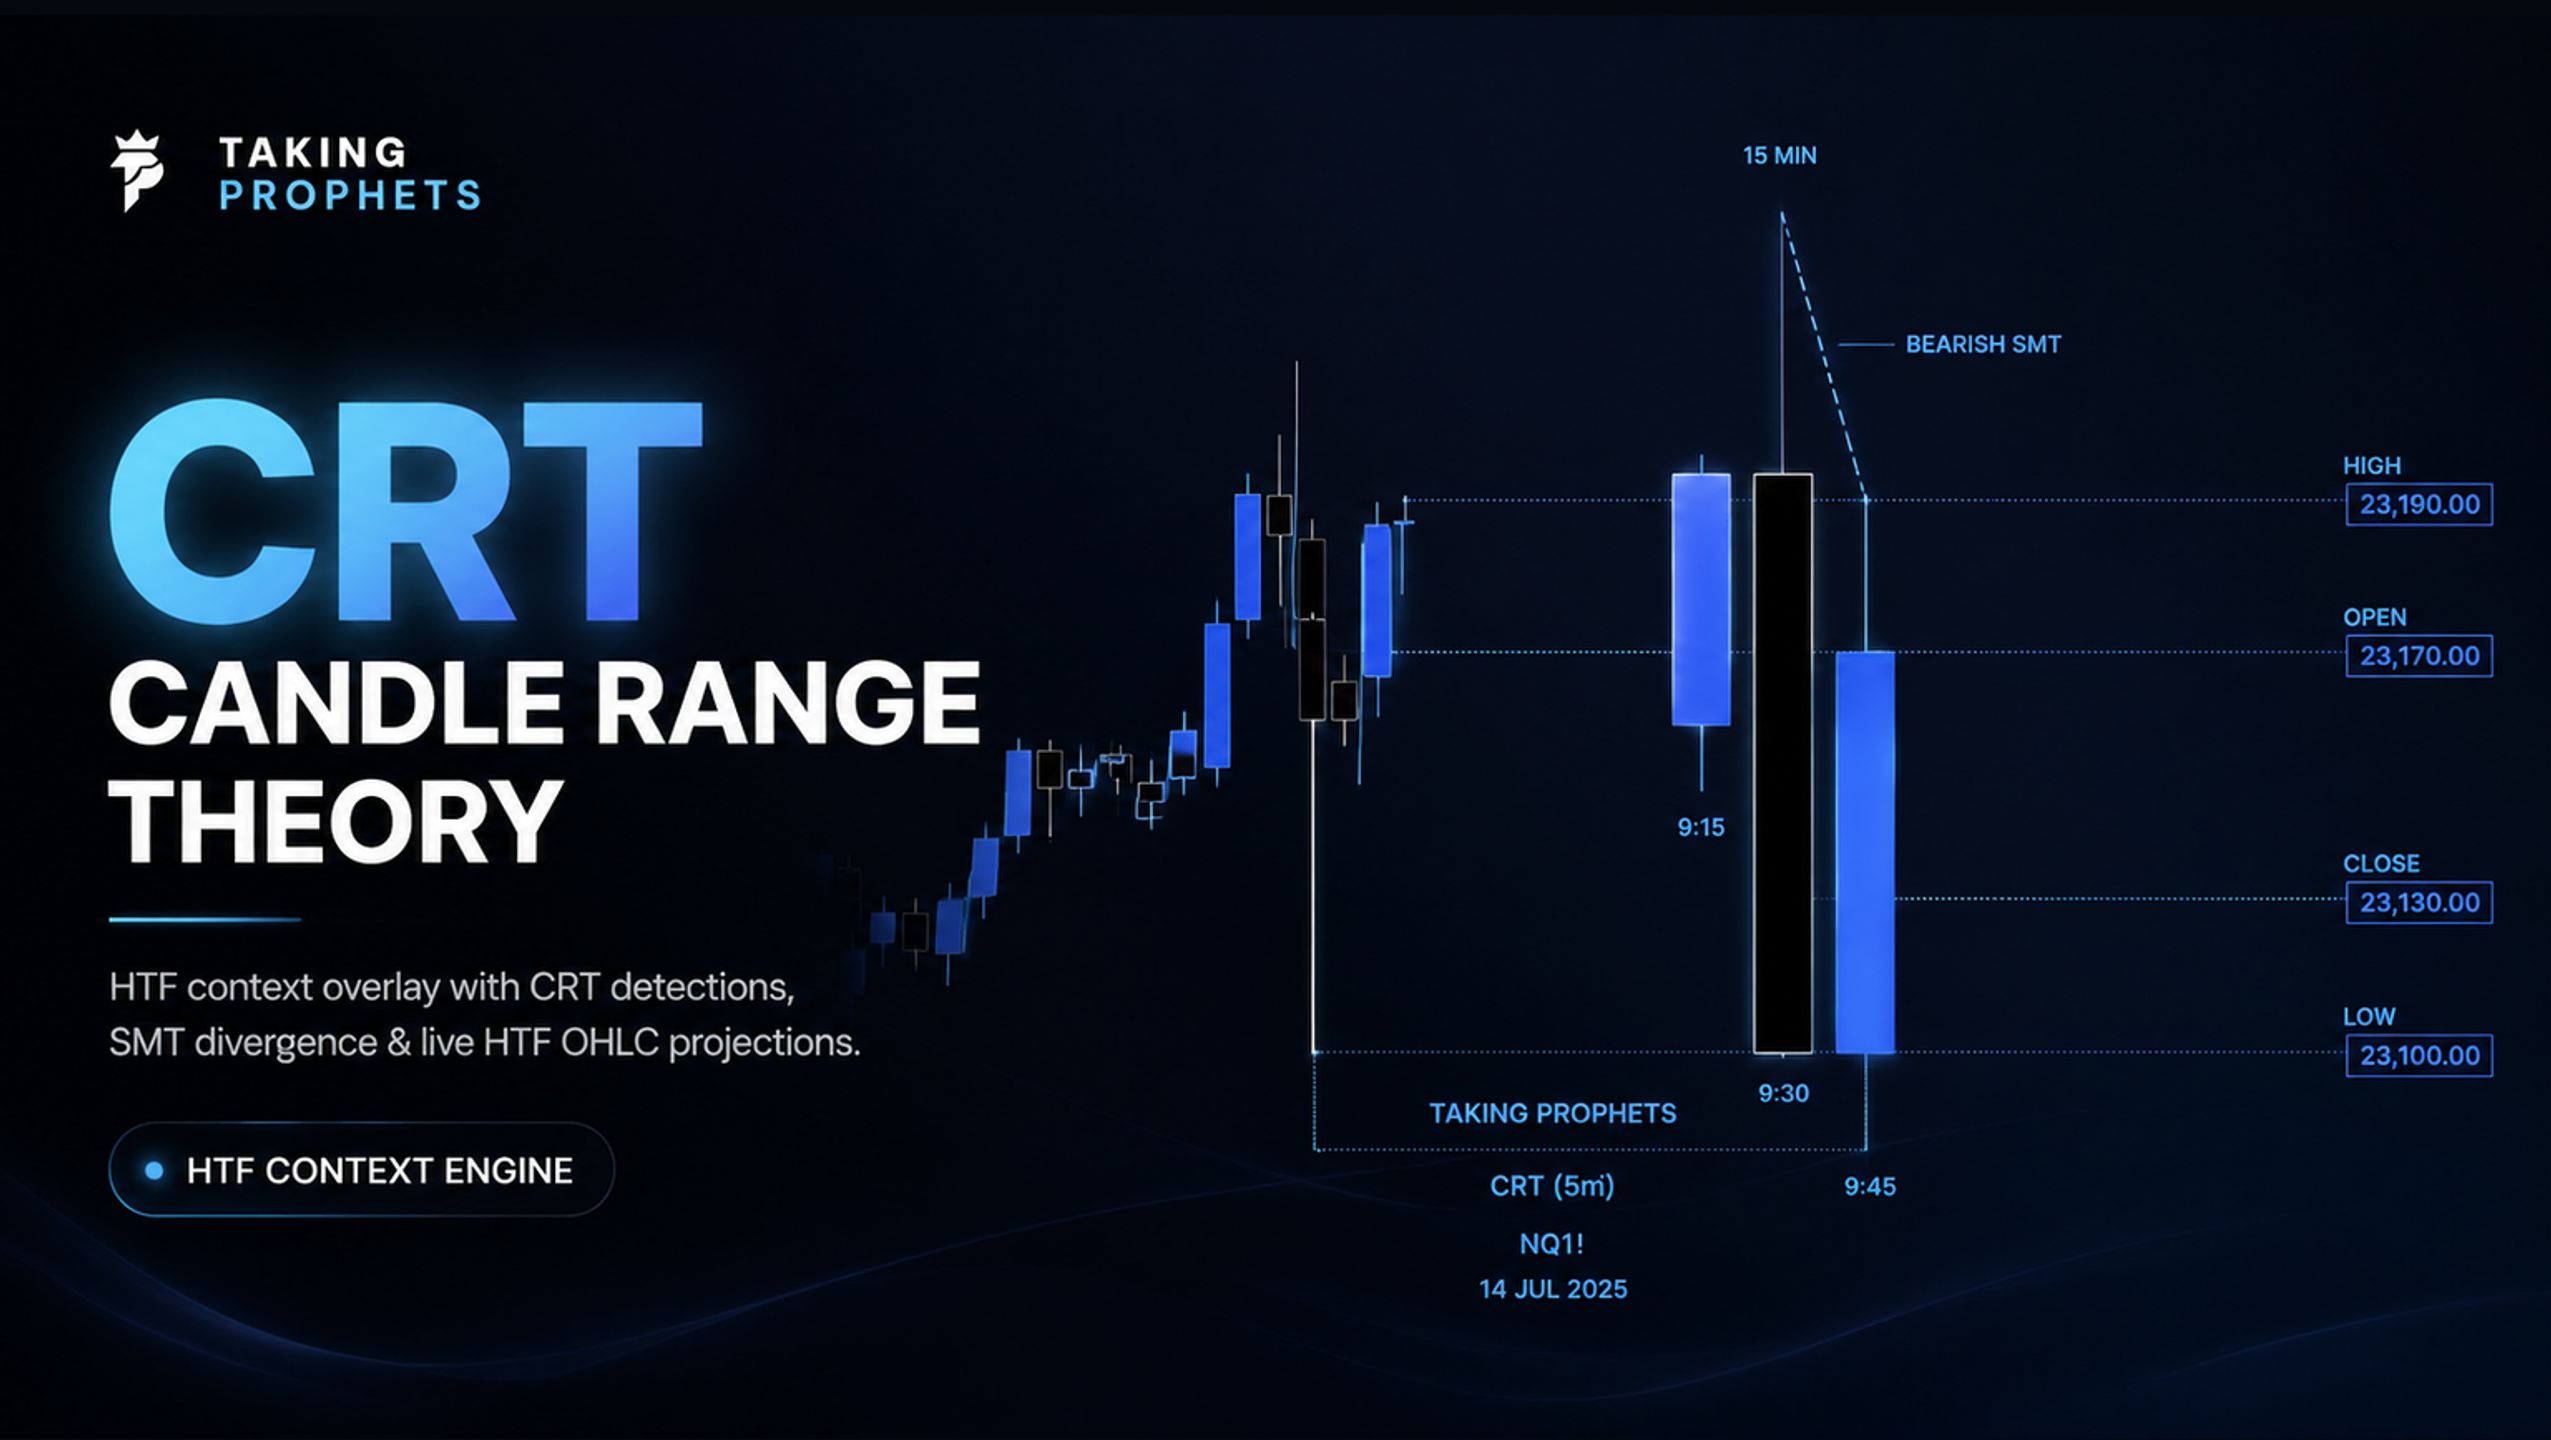
CRT (Candle Range Theory) is a higher-timeframe context tool that automatically maps candle ranges, phase shifts, and directional bias—so you don’t have to manually project them.
What it watches:
- Higher-timeframe candle ranges
- Range transitions & phase shifts
- HTF directional bias across sessions
What you see:
- Auto-projected HTF candle ranges
- Clearly defined range highs, lows, and equilibrium
- Visual phase shifts as price transitions between ranges
- A structured framework to align LTF execution inside HTF context
Why it helps:
- Candle Range Theory is powerful—but easy to mis-mark or misinterpret.
- CRT removes discretion from HTF range projection and bias mapping.
- Keeps you trading with structure, not guessing direction.
- Saves time and keeps your execution aligned with higher-timeframe intent.
Important:
- CRT is not a signal or a promise of results.
- It is a context, visualization, and framework tool designed to support Candle Range Theory analysis.
- Use for education and as part of your own trading process.
- Not financial advice.
Customer reviews
4.9113 ratings
Top reviews
- 12 days agoBest indicators in the game, makes this whole trading thing way easier + the discord is super helpful and informative when its comes to their stuffWritten 1 month after purchase
- 13 days agoNothing but good things to say about Taking Prophets, their community, indicators and support is some of the best I've seen in the industry. The Tp1 software has helped me get a clearer picture of how my strategy performs over time, being able to add my own scripts and backtest those. Overall, I’d ...Written 3 months after purchase
- 20 days agoI have been using their TP1 backtesting platform and its been a good experience so far compared to fxre..Written 7 months after purchase
- 1 month agoawesome community everyone is so friendly and helpful, get my questions answered anytime i ask something. also the backtester platform along with the built in journal feature, as well as the indicators you can use inside it is really useful to learn new strategies and actually fun to use. you truly ...Written 18 hours after purchase