CRT
CRT, Done-For-You: Auto-Map HTF Candle Ranges, Bias Shifts & Execution Zones
Got you — same structure, same tone, but cleanly adapted to CRT 👇
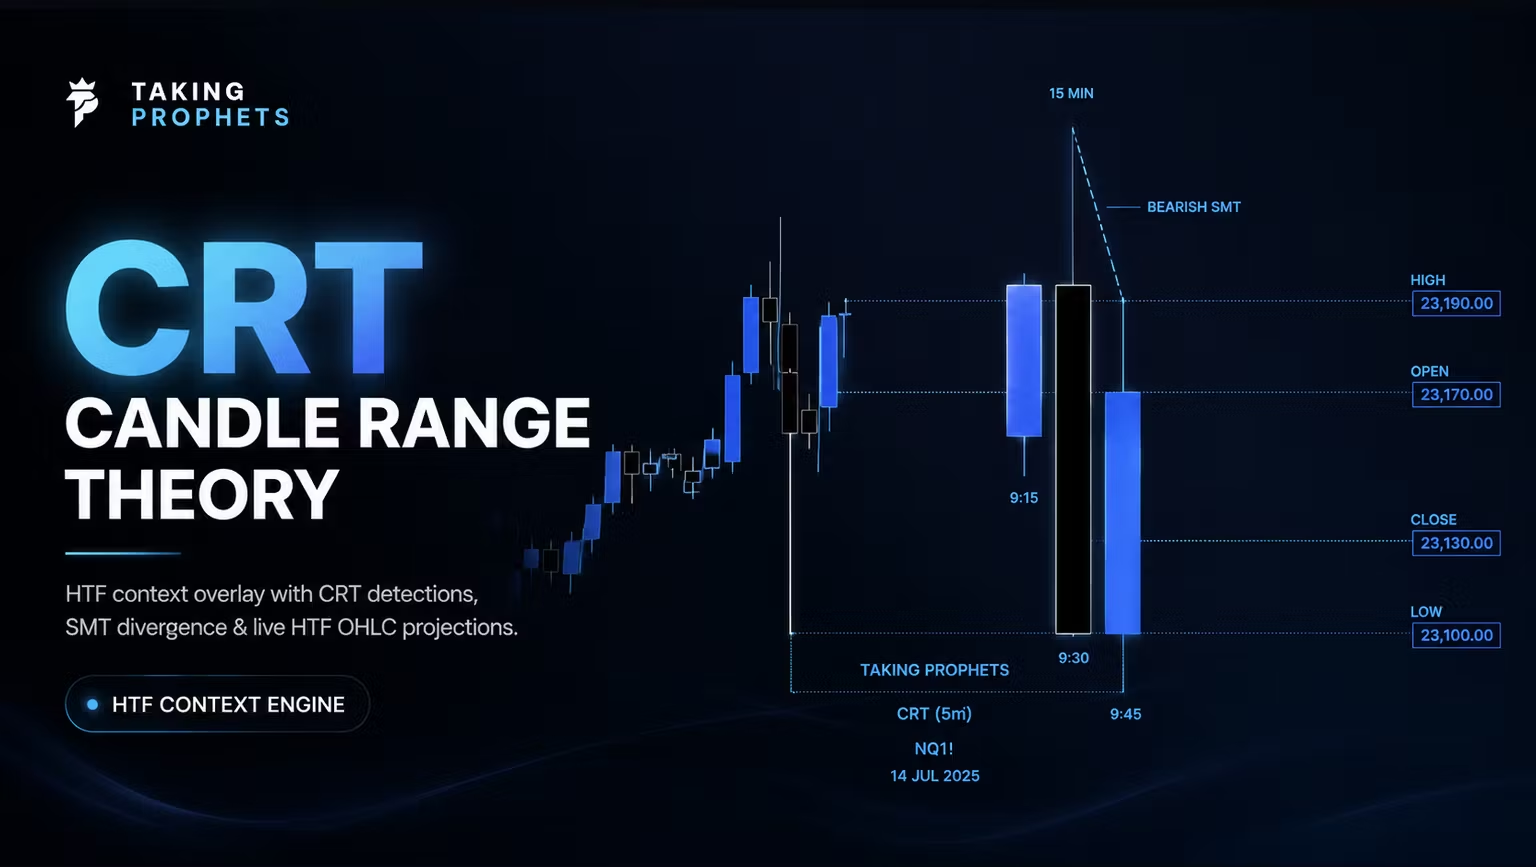
CRT (Candle Range Theory) is a higher-timeframe context tool that automatically maps candle ranges, phase shifts, and directional bias—so you don’t have to manually project them.
What it watches:
Higher-timeframe candle ranges
Range transitions & phase shifts
HTF directional bias across sessions
What you see:
Auto-projected HTF candle ranges
Clearly defined range highs, lows, and equilibrium
Visual phase shifts as price transitions between ranges
A structured framework to align LTF execution inside HTF context
Why it helps:
Candle Range Theory is powerful—but easy to mis-mark or misinterpret.
CRT removes discretion from HTF range projection and bias mapping.
Keeps you trading with structure, not guessing direction.
Saves time and keeps your execution aligned with higher-timeframe intent.
Important:
CRT is not a signal or a promise of results.
It is a context, visualization, and framework tool designed to support Candle Range Theory analysis.
Use for education and as part of your own trading process.
Not financial advice.
- 4 days ago
Amazing group wit the best signals out there love the doggy ifvg
- 7 days ago
10/10 Absolutely life changing group
- 8 days ago
10/10
- 8 days ago
IFVG Ultimate is the best indicator for ifvg models, i love that you can adjust it for yourself and your entry model + soo much timesaver