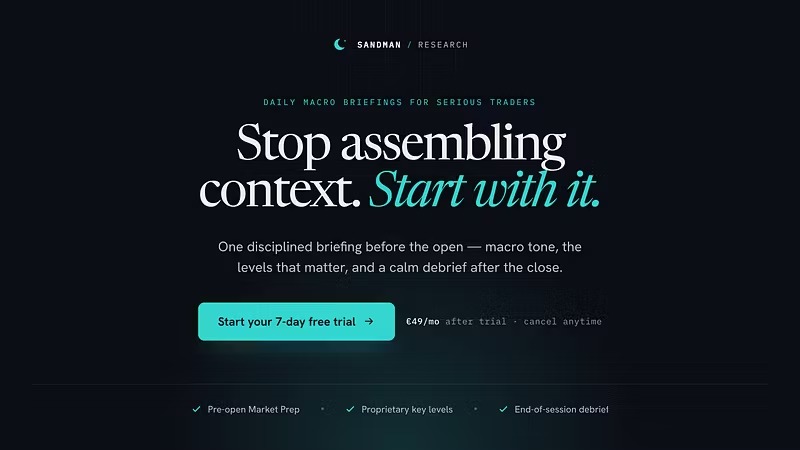
Sandman Research - Trading Desk

5.0 (2 Reviews)
The Macro Desk is an educational research platform teaching global macro analysis across every major session — Asia, Europe, and the US. Thr...
Location hidden
Created byProfile pictureMrSandman
15 joined
Profile picture
MrSandmanProfile picture@sandmanresearch·3d

One of today’s trades inside The Macro Desk 👇

Once again, on Gold.

This time, the setup started with an anomaly spotted in the Yield Curve. That dislocation kept us on alert on GC before the opportunity even presented itself.

As Gold approached a zone where we expected hedging flows to come into play, it gave us the short we were looking for, followed by a move that repriced the anomaly we had identified in rates.

Cross-asset read → hedging zone → confirmation → execution.

The whole trade played out live in the room, during the stream.

This is exactly the kind of framework and market reading we work on inside The Macro Desk.
file_12GsAGSSnRC9v
Profile picture
MrSandmanProfile picture@sandmanresearch·5d

Trade du jour : GC 🟡

Pendant qu’OPEX faisait ses OPEX things sur les equities, nous étions concentrés sur le Gold.

Lors de notre dernière leçon live, les membres ont découvert une nouvelle façon de lire le métal. Aujourd’hui, le setup s’est présenté en conditions réelles : on a stalké le short en direct.

Contexte posé.

Internals en avance.

Le prix a fini par suivre.

Pas besoin de courir après le move quand on sait déjà quoi observer avant qu’il parte.

Voici un petit preview de la session 👇

Bon week-end à tous !

Rejoins The Macro Desk — 7 jours d’essai offerts.

file_Vyz8jgB11pqEj
Profile picture
MrSandmanProfile picture@sandmanresearch·Jul 29

Fed holds. 3 hawkish dissents.
Warsh lets the market do the tightening.

Result?
Front-end dips. Long-end gets crushed.
30y briefly above 5.20% — highest since 2007.

Term premium is back.
The market is working.
Warsh is waiting.

How long can this division of labour last?

#FOMC #Rates #Treasury

Profile picture
MrSandmanProfile picture@sandmanresearch·Jul 28

Most traders found out about the risk when the market sold off.
Ours already knew.


The Chinese chip manufacturing tools announcement hit. Tech got crushed. NQ futures sold hard.

Traders with the right context walked in with a clear bias and the conviction to hold their shorts.


That’s the real edge.
Not reacting faster.
Understanding before what can move the market.


Information → Preparation → Execution.

This is what The Macro Desk is built for.

7 days free. See it yourself.


Educational macro research. Not financial advice.


file_yxhpQ9g1RjRne
Profile picture
MrSandmanProfile picture@sandmanresearch·Jul 22

US Session Debrief | Wednesday, July 22, 2026


Oil kept the inflation condition alive. The 20Y turned duration demand into the session’s real test.

The close


Brent settled at $94.07/bbl (+3.06%) and WTI at $86.83/bbl (+2.49%). Treasuries sold off, but the curve bear-flattened: the 2Y rose faster than the long end, consistent with reduced scope for near-term Fed easing rather than a disorderly term-premium event.


The $13bn 20Y auction tailed by 0.5bp and left dealers with an above-average allocation. That does not establish a structural duration buyers’ strike. It does establish that current yields required more concession to clear supply.


Desk assessment: Energy is still driving the policy repricing, while the 20Y result has made long-end demand a live condition rather than a background assumption.


Market mechanics

The rates move was front-end led. The 2Y gained 4.1bps, ahead of the 10Y and 30Y, narrowing 2s10s to 35.7bps. The market is pricing a higher probability that elevated energy costs delay the Fed’s easing capacity.

The 20Y auction added a separate long-end signal. A tail and heavier dealer absorption indicate softer private demand at current yields. Thursday’s $21bn 10Y TIPS auction now matters more: firm demand would contain the concern to one auction; another weak result would deepen the duration and inflation-compensation question.

Fed pricing shifted accordingly. Markets now price around 8.5bps for the next meeting and 35.6bps of easing through year-end, up from 31.9bps.


Equities

The equity market did not break, but the rotation was clear.

Utilities gained 2.29%, materials 1.45%, and energy 1.19%. Communication services fell 1.29%, consumer discretionary lost 0.84%, and small caps underperformed.

This was not broad risk reduction. It was a reallocation toward cash-flow visibility and direct commodity exposure, away from long-duration and cyclically sensitive assets.

After the close, Alphabet revenue beat consensus at $119.8bn. Tesla revenue also exceeded expectations at $28.24bn, but profitability disappointed. The next equity test is no longer headline demand; it is margins, capex, and cash-flow conversion under higher yields.


What matters next

  • ECB decision: Thursday, 14:15 CEST

  • US initial jobless claims: Thursday, 14:30 CEST

  • Canada retail sales: Thursday, 14:30 CEST

  • US $21bn 10Y TIPS auction: Thursday, 19:00 CEST

  • Intel earnings: after the US close


Research stance: Cautiously yield-bearish. The policy channel is confirmed, while the 20Y auction has elevated the long-end condition. The view strengthens if Brent reclaims $95.24, the 2Y holds above 4.300%, and the TIPS auction requires concession. It softens if energy disruption evidence fades, Brent falls below $91.45, and 10s lose 4.600%.

No investment advice. Independent research and scenario analysis. Markets carry risk; you are responsible for your own decisions. © Sandman Research 2026.


Profile picture
MrSandmanProfile picture@sandmanresearch·Jun 28

Still trading the open blind?

The bell doesn't wait. The Macro Desk gets you ready before it rings — the macro tone, the levels that actually matter, and a debrief at every close. No noise, no guru theater. Just the read.

What you get

🌅 Market Prep before the open — macro tone, the day's catalysts, and a clear plan to trade them.

🎯 Proprietary Options Levels — multi-asset levels that hold the full session, not just RTH.

📊 Custom Order Flow Indicators — proprietary MotiveWave studies that read the tape with you: see what's getting absorbed, where size is hiding, and when the flow turns.

📓 A debrief every close — what moved, why, and what it changes for tomorrow.

🗓️ Economic calendar + live sessions — so nothing on the tape catches you off guard.

Who it's for: Futures and index traders, macro-curious swing traders — anyone tired of reacting to headlines instead of front-running them.

Start free. 7 days, then €49/mo — about the cost of one prop firm challenge. Cancel anytime.

Educational macro research. Not financial advice.

Profile picture
MrSandmanProfile picture@sandmanresearch·Jun 22

The Flattening Has Not Been Faded Yet


Brent has given back the Hormuz gap, but 2s10s below 26bps says the market is still trading the Warsh Fed, not just lower oil.

file_390POoHjI6E15
Profile picture
MrSandmanProfile picture@sandmanresearch·Jun 18

The Fed has become hawkish. The bond market is trading something else.

On Wednesday, the first FOMC meeting chaired by Kevin Warsh surprised everyone with its hawkish tone: a revised dot plot higher, a year-end midpoint of 3.750%—representing an integrated increase—and a 131-word statement, the shortest since 2002. The market went from expecting price increases of around 21 basis points for 2026 to around 38 basis points.

And yet, on Thursday, Treasury yields rose. The 10-year Treasury yield fell 3 basis points to 4.457%, led by the midpoint of the yield curve. The 2-year Treasury yield, on the other hand, barely moved—anchored by the dot points.

The explanation can be summed up in one word: oil. The expected reopening of the Strait of Hormuz, Kuwait bringing its production back above 2 million barrels per day, and the signing of the US-Iran agreement on Friday in Geneva. Crude oil is seeking its post-war equilibrium, and a return to the pre-conflict range ($55-$65) is once again plausible. The timeframe suits crude oil, but not the Fed.

As a result, the dollar is trading the Fed's hawkish stance—the DXY at its highest level since May 25—while the yield curve trades energy disinflation. The 2s/10s flattened to 24.4 basis points during the session, a level not seen since before the spring tariff announcements.

On the stock market, the opposite is true: the Nasdaq gained 2.5%, driven by two semiconductor stories (Apple-Intel, rising memory prices). The stock market didn't react to the Fed's decision for a single second.

The next arbiter: next Thursday's core PCE auction, in an already packed 2/5/7 auction calendar.

Join Sandman Research before the next print - 7 days Free Cancel anytime

Profile picture
MrSandmanProfile picture@sandmanresearch·Jun 17

🔴 LIVE: WE CALLED THE FED'S ENTIRE PLAYBOOK — BEFORE THE PRESSER STARTED

While everyone's reacting to Warsh in real time, our members read the script hours ago.

Our FOMC Preview flagged it cleanly:

"A shorter, less guided statement would be consistent with a Chair who wants to reduce dependence on forward guidance."

Then Warsh walks up to the mic and says it almost word for word:

🗣️ "Financial markets perform best when reacting to incoming data rather than forward guidance."
🗣️ "Financial market prices are the most important source of information to guide central bankers."

That's not luck. That's reading the reaction function before the market does.

What our members had in hand BEFORE the gavel:

✅ The base case — hawkish hold, max optionality, no victory lap on inflation
✅ Why the dot plot — not the rate — was the real risk event
✅ The 4-way market map: dots vs. presser, and exactly when to fade the hawkish spike
✅ Why the energy shock ≠ an inflation regime — and why the Fed could afford to wait
✅ The trading bias: fade the extreme hawkish read unless all three boxes get checked

The market wanted drama. We told members the Fed would deliver restraint. 🎯

This is what we do every meeting. CPI. NFP. FOMC. Every major print — mapped, scenario'd, and traded before the headline hits.

📉 Stop reacting to the news.
📈 Start trading the reaction function.

Join Sandman Research before the next print - 7 days Free Cancel anytime

file_AF4DcjSNyRj8T
Profile picture
MrSandmanProfile picture@sandmanresearch·Jun 8

US CPI PREVIEW — WEDNESDAY JUNE 10, 08:30 ET

Built for prop firm traders trying not to blow their account on the print of the month.


THE SETUP

If you trade a funded account, this is the single biggest event between now and the June 17 FOMC. Most prop firms either restrict trading 2 to 5 minutes around the print, or hit you with widened spreads that turn a clean stop into a 3R loss. Either way, you cannot freelance this one.

Headline consensus +0.3% m/m, 4.2% y/y (prior +0.6% / 3.8%). Core consensus +0.5% m/m, 2.9% y/y (prior +0.4% / 2.8%). Cleveland Fed nowcast is at +0.46% m/m headline and +0.23% m/m core. Citi sits below the Street at +0.2% m/m core, betting on cleaner shelter prints now that the post-shutdown re-base distortion is behind us.

The Fed strip is loaded. After Friday's NFP beat (172k vs 85k), the market now embeds a full 25bp Fed hike by year-end versus only 16bp before the jobs print. Every basis point of that pricing is in play on Wednesday.


WHY THIS PRINT IS DANGEROUS FOR YOUR ACCOUNT

Three reasons.

One: the post-NFP repricing means a soft core CPI doesn't just stop the trend — it forces a violent unwind across the front end. DXY, gold, NDX, EUR/USD, all reverse together. If you are short equities or long dollar into the print without a defined exit, you give back two weeks of gains in 90 seconds.

Two: a hot core CPI confirms the tightening path, re-tests the recent 10Y high at 4.65%, flattens 2s10s, and drags equity indices back to Friday's lows. The tape moves fast and slippage on prop platforms widens to where your stops do not fill at the marked level.

Three: the energy backdrop is unresolved. Crude is bid on Iran-Israel escalation. Any core print that even hints at energy pass-through into goods triggers a regime shift — and your usual technical levels stop working because the macro overrides the chart.


THE FOUR SCENARIOS

Scenario A — core comes in soft (+0.2% to +0.3% m/m). Probability around 30%.

Reaction map: DXY sells off back below 100, EUR/USD reclaims 1.16, gold rips toward 4,400, 10Y rallies 8-12bps, NDX and SPX bid hard into the close. The trade is long risk on the first pullback in the first 30 minutes, not the spike.

Scenario B — core in line (+0.4% to +0.5% m/m). Probability around 45%.

Reaction map: range trade, vol crushes after the initial pop, DXY pinned around 100, EUR/USD chops 1.15-1.16, equities digest with sector rotation. Worst possible scenario for breakout traders, best for range scalpers. Wait 15 minutes before entering anything.

Scenario C — core hot (+0.6% m/m or above). Probability around 20%.

Reaction map: front-end UST sells off, 10Y tests 4.65% then 4.68% YTD high, DXY through 100.50, EUR/USD to 1.14, NDX retests Friday's 28,500 low, gold gets hit on rates impulse. The trade is short equity/long dollar on the first dead-cat bounce in the first 30 minutes.

Scenario D — supercore surprise (services ex-shelter accelerates). Probability around 5%.

Tail risk. Markets price the Fed-credibility discount on Warsh's first meeting. Long-end UST gives way, curve steepens hard, gold catches a bid on regime concern. Rare but if it lands, it is the move of the month.


THE LEVEL THAT MATTERS

EUR/USD 1.1500. Hold = the post-NFP move was already complete pricing. Break = scenario C is the path. This is the single cleanest line on the chart going into the print.


WHAT THE STREET CONSENSUS IS MISSING

The Fed has the option to deliver a hawkish hold on June 17 and let the data do the talking. That option becomes far more attractive in a C scenario. Front-end pricing does not yet reflect that asymmetry. If core prints +0.6% or above, the move on the strip is bigger than the move on the equity index.


WHY YOU NEED A DESK FOR THIS

Most prop firm traders read three commentaries before CPI and end up more confused, not less. The bid-ask of opinions widens, not narrows.

The Macro Desk publishes one Event Preview 24 hours before every Tier 1 print. Scenario probabilities, reaction map, named levels, game plan for the first 5/30/120 minutes after release. After the print, a Live Debrief lands within 90 minutes telling you which scenario actually played and what to do with your remaining session.

Built for traders with accounts to defend, not portfolio managers writing year-end notes.


FOUNDING MEMBER ACCESS

49,99 EUR per month, locked in for life for the first 50 subscribers. Goes to 99,99 EUR per month after.


7-day free trial. You read the CPI Preview, the Wednesday Live Debrief, and the full week of Preps before you decide.

Not investment advice. Independent research and scenario analysis only. © Sandman Research 2026.