AlphaSignalLTD

AlphaSignal LTD builds advanced TradingView indicators and Discord alerts to help traders analyze liquidity, volume, market structure, and...
Location hidden
β€’
β€’Created byProfile pictureAlpha Signal LTD
52 joined
Profile picture
Alpha Signal LTDProfile picture@alphasignalltdΒ·5d


This is what Alpha KNN Matrix Pro looks like running live on BTC/USD.

Every time price sets up something the model has seen before, it does three things:

  1. Searches thousands of bars of history for the closest structural matches

  2. Filters those matches by current context β€” trend, position in range, momentum (shown live in the corner: Ctx: Up | Pos 0.91 | Mom 0.39)

  3. Projects three separate scenario paths, each scored by how closely it matches historical analogs (S1: 0.634, S2: 0.795, S3: 0.775 in this example)

No single fixed prediction. No black-box arrow. Just: here's what happened last time price looked like this, scored three different ways, so you can weigh it against your own read of the chart.

That's the whole philosophy β€” stop guessing, start checking against real historical evidence.

πŸ‘‰ See how it works on your own charts:

file_BulDVq8c0raEo
Profile picture
Alpha Signal LTDProfile picture@alphasignalltdΒ·Aug 16

Alpha KNN Matrix Pro 2026 β€” Historical Pattern-Matching & Scenario Forecasting Indicator for TradingView

What Is Alpha KNN Matrix Pro 2026?

Alpha KNN Matrix Pro is a scenario-modeling indicator built around a simple question: when has the market moved like this before, and what tended to happen next?

Instead of applying one fixed formula to every candle the way a typical oscillator does, it continuously scans your chart's own price history using a k-Nearest Neighbors (KNN) search β€” a pattern-recognition method borrowed from quantitative research β€” to find historical sequences that closely resemble what's forming right now. It then projects forward based on what those historical "look-alikes" actually did afterward.

What Does It Help You Analyze?

  • Historical analogs β€” which past market structures most closely resemble the current one, and by how much (measured across four different similarity methods)

  • Plausible near-term paths β€” three separate projected scenarios drawn from real historical outcomes, not a single fixed forecast

  • Market context β€” whether the current trend, position within range, and momentum match the conditions under which the historical analog occurred

  • A reference bias signal β€” when the single closest historical match leans clearly bullish or bearish, with its own accumulating win-rate for context

Key Features

  • Historical Matching β€” automatically correlates current price action with historical data to find similar behavioral patterns

  • Scenario Projection β€” displays three potential price paths (Scenario 1, 2, 3), each labeled with a projected % move and similarity score

  • Context Filtering β€” refines matches by Trend, Position-in-range, and Momentum so comparisons stay structurally consistent

  • 4 similarity methods β€” Cosine, Pearson, Euclidean, and Spearman rank correlation, each capturing a different notion of "similar"

  • Configurable Pattern Representation β€” compare on raw price, % change, or bar-to-bar slope

  • Adjustable Correlation Length & Forecast Length β€” control how specific the pattern match is and how far ahead it projects

  • Forecast: Long / Forecast: Short reference markers β€” with projected move, similarity score, and accumulated win rate shown on hover

  • Signal tuning controls β€” minimum similarity score, cooldown between signals, and minimum projected move, so you control frequency vs. conviction

  • Built on time-series search-efficiency techniques (PAA + symbolic hashing) so it re-evaluates every closed bar without slowing down your chart

Who Is It For?

  • Traders who want a data-driven second opinion instead of relying purely on subjective forecasting

  • Traders already using SMC, Order Flow, or structure-based strategies who want an additional confluence layer

  • Traders comfortable interpreting probability-based scenarios rather than fixed buy/sell signals

  • Anyone who wants to build contingency plans around multiple plausible outcomes instead of a single prediction

How Traders Use It

  1. Check market context first β€” assess current Trend and Momentum via the built-in dashboard.

  2. Review the three projected scenario paths and their similarity scores to see how price behaved in comparable historical spots.

  3. Use the Forecast: Long/Short reference marker as one additional input β€” not a standalone trigger β€” when the closest analog leans clearly in one direction.

  4. Combine the scenarios with your existing strategy (SMC, Order Flow, price action, etc.) to confirm or challenge a setup.

  5. Let the win-rate figure build up over a reasonable sample size on your specific instrument and timeframe before drawing conclusions from it.

Core philosophy: stop guessing the market β€” let historical evidence inform your strategy, alongside your own risk management and judgment.

Stop guessing the market. Let historical evidence guide your strategy. See how price has behaved in similar historical setups β€” before you take the trade.

[Request Access to Alpha KNN Matrix Pro 2026 β†’ ] (Invite-only script β€” activated through the Whop Store after purchase)

Download file manual product here

file_ijLYx3qEvHLJp
pdf
Alpha_KNN_Matrix_Manual.pdfDocument Β· 19.9 kB
Profile picture
Alpha Signal LTDProfile picture@alphasignalltdΒ·Aug 14

Stop Calculating. Start Trading. Anchored VWAP signals + automatic position sizing + full trade planning β€” in one indicator.

Every signal from AlphaSignal Oracle comes pre-built: Entry, Stop-Loss, and up to 3 Take-Profit levels, plotted directly on your chart. Set your dollar risk once β€” the engine calculates your exact lot size automatically, across Forex, Crypto, Futures, Gold, and CFDs.

No more manual math. No more guessing position size. No more second-guessing whether a breakout has real volume behind it β€” the built-in filter checks that for you.

What you get:

  • Anchored VWAP engine that adapts to current market structure

  • Volume-confirmed entry signals β€” filters out low-conviction fake-outs

  • Auto-calculated lot size based on your fixed risk, across every asset class

  • Entry, SL, and 3 scaled TP levels drawn automatically

  • Live Performance Dashboard + Smart Risk Assistant

  • Full PDF manual included at access

Get instant access and add it to your chart today.

Access AlphaSignal Oracle VWAP Dynamics β†’

One-time setup. Works on every instrument you already trade.

file_EXxpr8XJaszH1
Profile picture
Alpha Signal LTDProfile picture@alphasignalltdΒ·Aug 14

AlphaSignal Oracle VWAP Dynamics β€” Anchored VWAP Trading Indicator with Automated Risk Management for TradingView

What Is AlphaSignal Oracle VWAP Dynamics?

AlphaSignal Oracle VWAP Dynamics is a complete trading suite built around a professionally engineered Anchored VWAP engine β€” the same category of tool institutional desks use to read a market's true average price. Instead of treating every candle equally like a simple moving average, it weighs price by actual volume, then anchors to the market's key turning points so the reference line always reflects current structure, not stale history.

It's built for traders across Forex, Crypto, Futures, Indices, Gold, Silver, Oil, Stocks, and CFDs, adapting automatically to whichever instrument you're on.

What Does It Help You Analyze?

AlphaSignal Oracle helps you read three things at once, directly on your chart:

  • Where fair value actually sits β€” via the anchored VWAP bands, which shift as market structure shifts

  • Whether a breakout has real conviction β€” through a dynamic volume threshold that filters out low-volume fake-outs

  • Exactly how much to risk β€” through a real-time position-sizing engine tied to your account and instrument

The goal isn't to hand you a black-box signal. It's to compress entry, risk, and trade management into one clean workflow so you can make a decision in seconds instead of manually calculating lot sizes and stop distances every time.

Key Features

  • Anchored VWAP engine with dynamic bands that reflect current market structure, not fixed history

  • Precision entry signals filtered by a dynamic volume-threshold algorithm to reduce low-conviction fake-outs

  • Automated trade planning β€” Entry, Stop-Loss, and up to 3 Take-Profit levels (TP1–TP3) plotted directly on the chart

  • Institutional-grade risk engine β€” set a fixed dollar risk per trade and it calculates suggested lot size automatically, with auto-detection of contract size and exchange point values across asset classes

  • Auto-move to break-even after TP1, optional, to help protect capital as a trade develops

  • Four stop-loss methods and three flexible take-profit tiers

  • Two live dashboards: a Performance Dashboard (trade count, win/loss, win rate, profit factor) and a Smart Risk Assistant (live volatility read, recommended lot size, instrument detection check)

  • Live Mode and Backtest Mode in one toggle β€” real-time trading view vs. spread-aware historical evaluation over a chosen window

  • Full alert support for every key event

  • Works across Forex, Gold, Silver, Oil, Crypto, Futures, Indices, Stocks, and CFDs with automatic contract-value detection

Who Is It For?

  • Day traders and intraday traders who want structured, volume-confirmed entries instead of guesswork

  • Traders who currently size positions manually and want that risk math automated and consistent

  • Traders across multiple instruments (Forex, Crypto, Futures, Gold) who want one tool instead of switching indicators per market

  • Traders who want a repeatable process: signal β†’ risk sizing β†’ stop-loss β†’ scaled take-profits, without leaving the chart

How Traders Use It

  1. Add AlphaSignal Oracle to your chart and set your target dollar risk per trade.

  2. Watch for price to compress within the outer VWAP bands, then confirm a breakout only when volume clears your set threshold.

  3. Let the engine plot your Entry, Stop-Loss, and TP1–TP3 automatically β€” no manual lot-size math.

  4. In a trending market, use the structural stop-loss as a trailing reference to scale into pullbacks.

  5. Once TP1 hits, optionally trail your stop to break-even to protect the rest of the position.

  6. Use the Smart Risk Assistant and Performance Dashboard as an ongoing, objective reference alongside your own risk rules β€” not as a guarantee.

This is a decision-support and trade-execution tool. It's designed to remove manual calculation and inconsistency from your process β€” your risk management judgment still drives the outcome.

Trade with clarity. Manage risk with confidence. Add AlphaSignal Oracle VWAP Dynamics to your chart, set your target risk once, and let the system handle entry, stop-loss, and take-profit placement β€” automatically.


file_D3shJlIrEn4Fx
Profile picture
Alpha Signal LTDProfile picture@alphasignalltdΒ·Aug 9

πŸš€ Oracle VWAP Dynamics β€” Complete Manual & Video Tutorial Now Available

Getting started with AlphaSignal Oracle VWAP Dynamics is now easier than ever.

We’ve added a complete User Manual + Step-by-Step Video Tutorial to help you understand the indicator, configure your settings, and get the most out of its powerful VWAP and market structure tools.

πŸ“˜ Complete User Manual

The included manual provides a clear overview of Oracle VWAP Dynamics, including:

  • βœ… Indicator setup & configuration

  • πŸ“Š Understanding Dynamic VWAP

  • 🎯 VWAP bands and key price levels

  • πŸ“ˆ Market structure analysis

  • πŸ›‘οΈ Risk management features

  • πŸ”” Real-time trading signals

  • βš™οΈ Recommended settings and usage guidelines

Whether you're new to VWAP trading or an experienced trader, the manual gives you a convenient reference whenever you need it.

πŸŽ₯ Step-by-Step Video Tutorial

We've also created a full video walkthrough showing you exactly how to set up and use Oracle VWAP Dynamics on TradingView.

The tutorial covers the complete process from manual setup β†’ indicator configuration β†’ understanding the signals β†’ practical usage.

This makes it easier to follow along and start using the indicator with confidence.

πŸ”₯ Why Oracle VWAP Dynamics?

Oracle VWAP Dynamics is designed to help traders analyze:

  • Dynamic VWAP levels

  • Market structure

  • Potential support & resistance

  • Trading zones

  • Real-time signals

  • Risk management and trade planning

It can be used across Crypto, Forex, Futures, Indices, Commodities, and Stocks.

πŸ“₯ Everything You Need in One Place

After getting access to Oracle VWAP Dynamics, you'll have access to both:

πŸ“˜ Complete Manual
Learn the concepts, features, and recommended workflow.

πŸŽ₯ Video Tutorial
Follow the setup and usage process step-by-step.

πŸ”—

Our goal is simple: make sure you don't just get the indicator β€” you know how to use it.

πŸ‘‰ Get Oracle VWAP Dynamics and start your setup today :

#OracleVWAPDynamics #AlphaSignal #VWAP #VWAPTrading #TradingView #TradingIndicator #VWAPStrategy #CryptoTrading #ForexTrading #FuturesTrading #DayTrading #TradingStrategy

pdf
AlphaSignal_Oracle_Manual.pdfDocument Β· 28.2 kB
Profile picture
Alpha Signal LTDProfile picture@alphasignalltdΒ·Jul 22

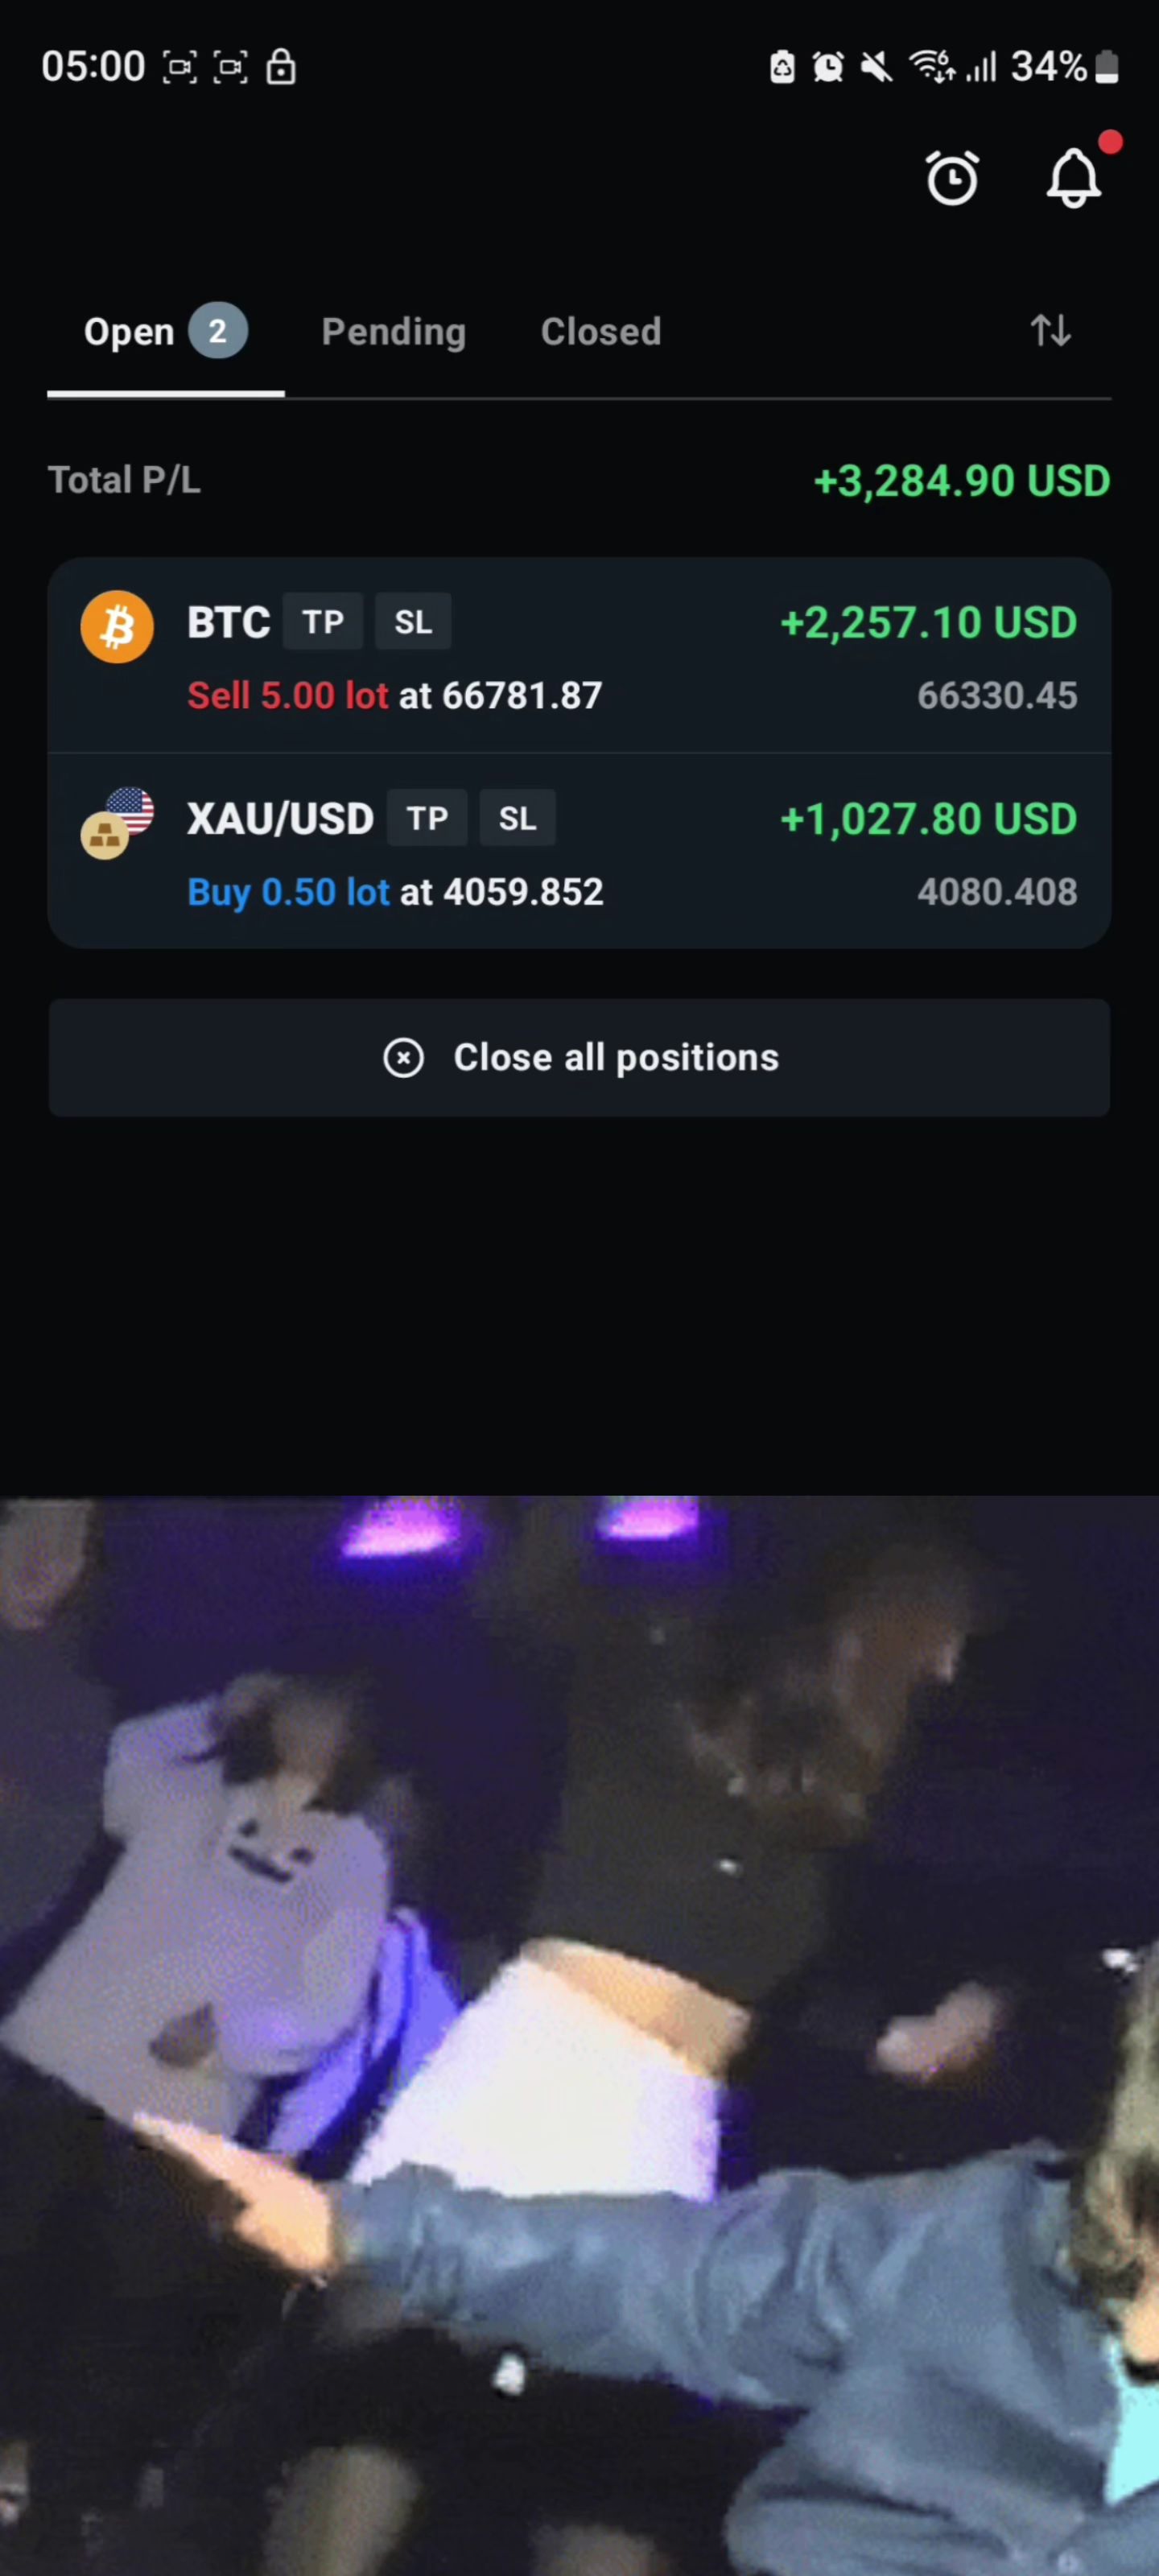
THE BREAKDOWN: How I Caught the Moves in That Video (Using Our Unreleased Indicator)

If you just watched the video showing those recent profits, you probably have one question: How did you know the exact level where the market was going to reverse?

Let me be completely transparent with you. It wasn’t luck. It wasn’t a "gut feeling" about the market, and it definitely wasn't from using lagging retail indicators like RSI or MACD.

Those results are the direct output of trading with Titan Flow X β€”the massive architectural upgrade our quant team has been building behind the scenes.

Instead of guessing where the market might turn, I simply followed the institutional footprint. Here is the exact 3-step blueprint I used to print those results:

Step 1: Identifying the Institutional Boundary Retail traders draw arbitrary trendlines. I don't. I wait patiently for the price to interact with our Dynamic Institutional VWAP Bands. These bands track the exact standard deviation channels that algorithmic funds use to determine overbought or oversold zones. I don't even look at a setup until we reach these borders.

Step 2: Spotting the "Brick Wall" (Iceberg Risk Detection) This is the game-changer. Buying at a support level is useless if an institution has a massive sell-wall sitting right above you. When the price entered my zone in the video, our system's Iceberg Risk Detection instantly flagged an anomalous cluster of resting orders (The Yellow Nodes). I didn't have to guess if there was buying pressureβ€”I could physically see the "brick wall" of institutional liquidity stepping in to defend the level.

Step 3: Flawless Execution Once the Yellow Nodes confirmed the resting liquidity, I executed with the flow of the smart money. This system forces you to be highly selective. By averaging only ~1 high-probability setup per day, it completely eliminates overtrading while maintaining a win rate of over 70% across multiple assets.

Stop Being Exit Liquidity. If you can't see the order flow and resting liquidity, you are flying blind. Titan Flow X gives you the X-ray vision required to trade with the institutions, not against them.

πŸ”₯ THE LAUNCH IS IMMINENT Titan Flow X will be released exclusively right here on our Whop Store very soon.

πŸ‘‰ ACTION REQUIRED: Make sure you are following our Whop page and have your email/app notifications turned ON. We will be dropping a highly limited Launch Discount for our earliest adopters, and you do not want to miss it.

Get ready to completely change how you see the charts. πŸš€

file_FAAjW58m3bLwU
file_asz6uFH2eWYrb
Profile picture
Alpha Signal LTDProfile picture@alphasignalltdΒ·Jul 21

🚨 PROOF: Why Titan Flow X Delivers >70% Win Rates Across Multiple Markets

Hey Alpha Signal Community,

We don't talk in theory. When we announce an upgrade like Titan Flow X (Iceberg Risk Edition), we back it up with hard data.

Today, we are sharing the raw execution performance across diverse markets (Crypto, Futures, Forex) over the past 25–26 days on the 15-minute timeframe.

πŸ“Š THE NUMBERS DON'T LIE (Check attached charts):

  • πŸ† Gold Futures (GC): Absolute dominance with an 81.25% Win Rate (13 Wins - 3 Losses) and a massive 2.32 Profit Factor.

  • πŸͺ™ Bitcoin (BTC/USD): Clean precision with a 71.43% Win Rate (20 Wins - 8 Losses) and a 1.98 Profit Factor.

  • πŸ“ˆ Nasdaq (NQ) & Gold Spot: Consistently holding robust Win Rates around 70%.

(Note: You can inspect individual trade setups, Stop Losses, Take Profits, and massive Iceberg liquidity clustersβ€”highlighted in yellowβ€”directly on the attached charts).

WHY DOES IT WORK SO WELL?

The edge doesn't come from a magic indicator. It comes from Institutional Market Structure.

This system completely cures retail overtrading. Averaging roughly 1 trade per day, it forces you to sit on your hands until price interacts with Dynamic VWAP Bands AND validates through anomalous Iceberg Risk clusters.

You no longer have to guess where a reversal will happen. You can physically SEE where the institutional wall is built.

πŸ”₯ ARE YOU READY?

Titan FLow X is officially dropping soon on our Whop Store.

πŸ‘‰ Action Steps:

  1. Make sure you are following our store on Whop.

  2. Turn on your app/email notifications so you can grab the limited Launch Discount as soon as it goes live.

See you inside the ecosystem! πŸš€

file_4gb2YdYY4DWZh
file_rXut0qTuysNcr
file_Ek33hyLsldaGQ
file_UnSRmHDKoXq1w
Profile picture
Alpha Signal LTDProfile picture@alphasignalltdΒ·Jul 16

🚨 UPCOMING RELEASE ANNOUNCEMENT: The Next Evolution of Institutional Order Flow is Here.

[Headline] Introducing Titan OrderFlow Pro + VWAP (Iceberg Risk Edition): Stop Guessing Where the Smart Money is Hiding.

For months, the original Titan Order Flow has been the core execution tool for our most successful traders. But the market evolves, institutional algorithms adapt, and so must our technology.

Behind the scenes at Alpha Signal LTD, our quantitative team has been engineering a massive upgrade. We are fusing the power of real-time liquidity mapping with institutional volume-weighted pricing.

Get ready for the Titan OrderFlow Pro + VWAP.

Why We Built This Upgrade

Most retail traders use VWAP (Volume Weighted Average Price) as a simple line on a chart. Institutions use it as a strict boundary for execution. But knowing the VWAP isn't enough if you don't know where the resting liquidity (Iceberg Orders) is sitting relative to that price.

If you are buying at the VWAP lower band, but there is a massive institutional sell-wall sitting just above it, your trade is going to get crushed.

Titan OrderFlow Pro solves this by visualizing both dimensions simultaneously: Dynamic VWAP Standard Deviation Bands combined with a Real-Time Horizontal Liquidity Profile.

What’s New in the Pro Upgrade?

We have entirely rebuilt the visual and algorithmic architecture to give you X-ray vision into the market structure:

  • πŸ“Š Dynamic Institutional VWAP Bands: Visually track the exact standard deviation channels used by algorithms to determine overbought, oversold, and mean-reversion zones.

  • 🧱 Iceberg Risk Detection (The Yellow Nodes): The system instantly identifies and highlights massive, anomalous clusters of resting orders (Icebergs). When you see the yellow bar, you know exactly where the "brick wall" of institutional liquidity is sitting.

  • πŸ”΄/πŸ”΅ Real-Time Buyer vs. Seller Depth: The horizontal histogram actively tracks where supply (Magenta) and demand (Cyan) are piling up, allowing you to execute with the localized trend, not against it.

  • βš™οΈ Built-In Strategy Tester & Live Metrics: We added an integrated performance panel so you can track your exact edge without leaving the chart.

The Proof is in the Data

We don't release tools based on theory. We release them based on statistical evidence.

During our recent 86-day structural stress-test on the BTC/USDT 15-Minute chart, the Titan OrderFlow Pro algorithm demonstrated a sustainable, highly-selective edge:

  • Active Trading Days: 86 Days

  • Total Trades Executed: 93 (Highly filtered, ~1.1 trades per day to prevent overtrading)

  • Win Rate: 67.74% (63 Wins / 30 Losses)

  • Profit Factor: 1.13

This is not a "get rich quick" holy grail. This is a realistic, professional-grade edge designed to grind out consistent profitability while strictly managing risk.

Prepare Your Charts

This is the ultimate ecosystem for traders who want to map the exact locations of supply and demand while timing their entries with VWAP precision.

Titan OrderFlow Pro + VWAP is dropping very soon exclusively on the Alpha Signal Whop Store.

πŸ‘‰ Make sure your Whop notifications are turned ON so you don't miss the launch discount!

file_8fzj3h6opEjZ6
Profile picture
Alpha Signal LTDProfile picture@alphasignalltdΒ·Jul 9

Not every rocket is yours to catch.

The traders who last the longest aren't the ones chasing every big moveβ€”they're the ones stacking small wins with patience, consistency, and discipline. One good decision at a time leads to real growth.

file_17CdTejKXZUwG
Profile picture
Alpha Signal LTDProfile picture@alphasignalltdΒ·Jul 9


Stop Trading Blind. Start Seeing Market Liquidity.

Most traders enter after the move has already started.

Alpha Signal Iceberg Hunter helps you analyze hidden liquidity behavior, abnormal volume activity, candle rejection, and potential absorption zones directly on TradingView.

Built for traders who want clearer setups, better confirmation, and a more structured trading process.

What You Get

βœ… TradingView indicator access
βœ… Hidden liquidity & volume analysis
βœ… Entry, Stop Loss, and Take Profit levels
βœ… Partial TP structure
βœ… Break-even risk management
βœ… Discord signal alerts for selected markets
βœ… Setup guide and community support

Alpha Signal Iceberg Hunter is not a random buy/sell signal tool.

It is a rule-based trading framework designed to help you understand where liquidity may be forming, where price may reject, and how to manage risk before entering a trade.

Built For Traders Who Want To:

πŸ” Avoid chasing false breakouts
πŸ“Š Read volume behavior with more clarity
🎯 Plan entries, SL, and TP with structure
⚑ Reduce emotional trading decisions
πŸ€– Receive selected Discord trading alerts

No indicator can guarantee profits.

But better market context can help you make better trading decisions.

πŸ‘‰ Get Alpha Signal Iceberg Hunter today and start trading with more clarity.

Risk Disclaimer: Alpha Signal Iceberg Hunter is an analytical and educational trading tool. It is not financial advice and does not guarantee trading results. Trading involves risk.

file_awsmj6Om2BT4w