

Only the front month fell
Data as of the Oct 2, 2026 close.
The dollar is being bought because people need it, not because they believe in it.
Payrolls came in at +29k against +90k expected. Core PCE has slowed to about 2% annualized over three months. The market has nearly priced out an October hike, which now sits in the mid-teens.
Yields went up anyway. The 10-year closed the week at 5.28%, up from 5.18%. The MOVE index, the bond market's volatility gauge, is still above 100.
When rates swing like this, margin requirements rise. Add month-end funding demand, and traders have to source dollars just to keep positions open. That's the bid under the dollar. Positioning in the dollar index has barely moved.
Under that headwind, a few assets have stopped going down. That's the thread this week.
WTI: only the front month fell
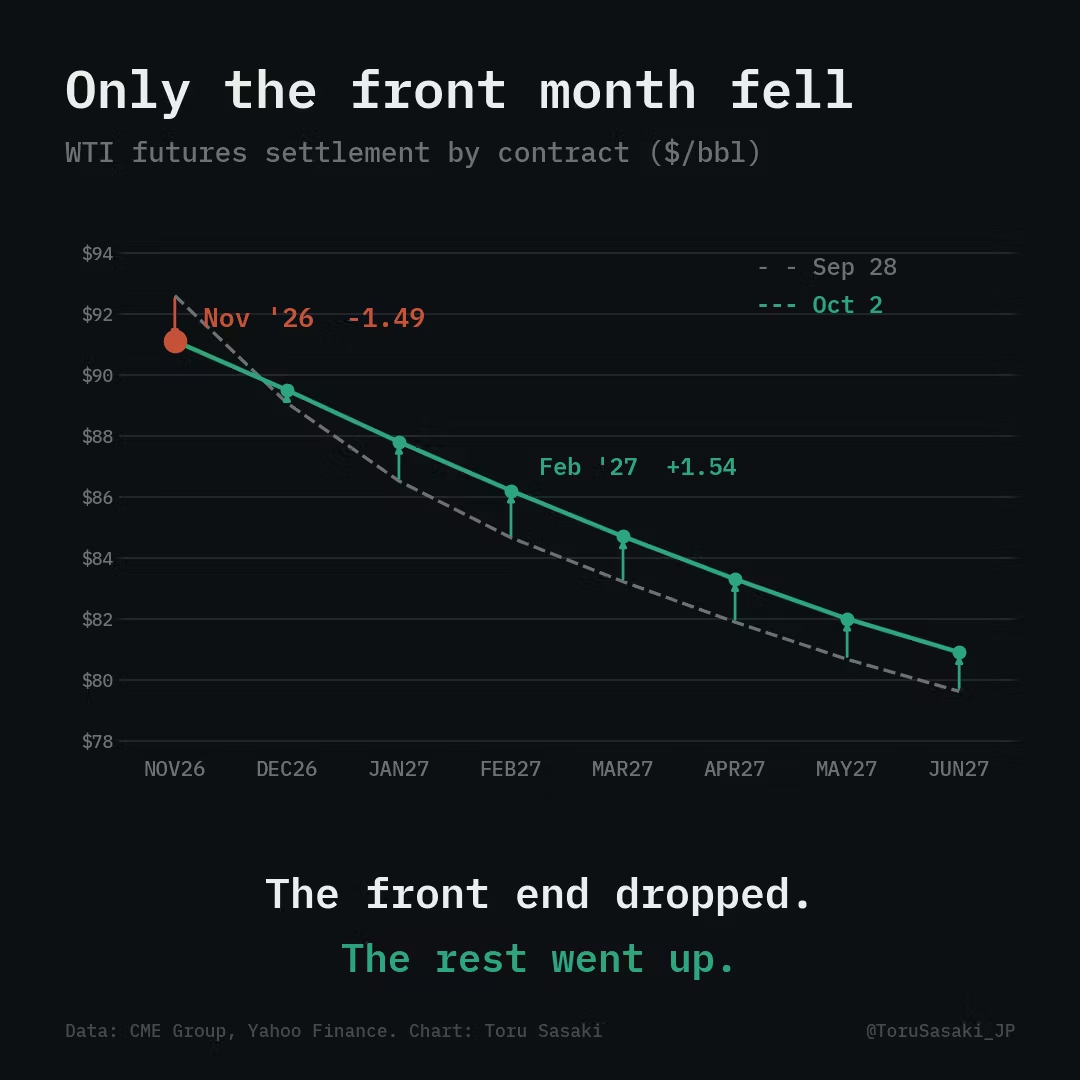
On the week, the November WTI contract fell 1.4% to about $91. December rose 0.8%. March 2027 rose 2.7%.
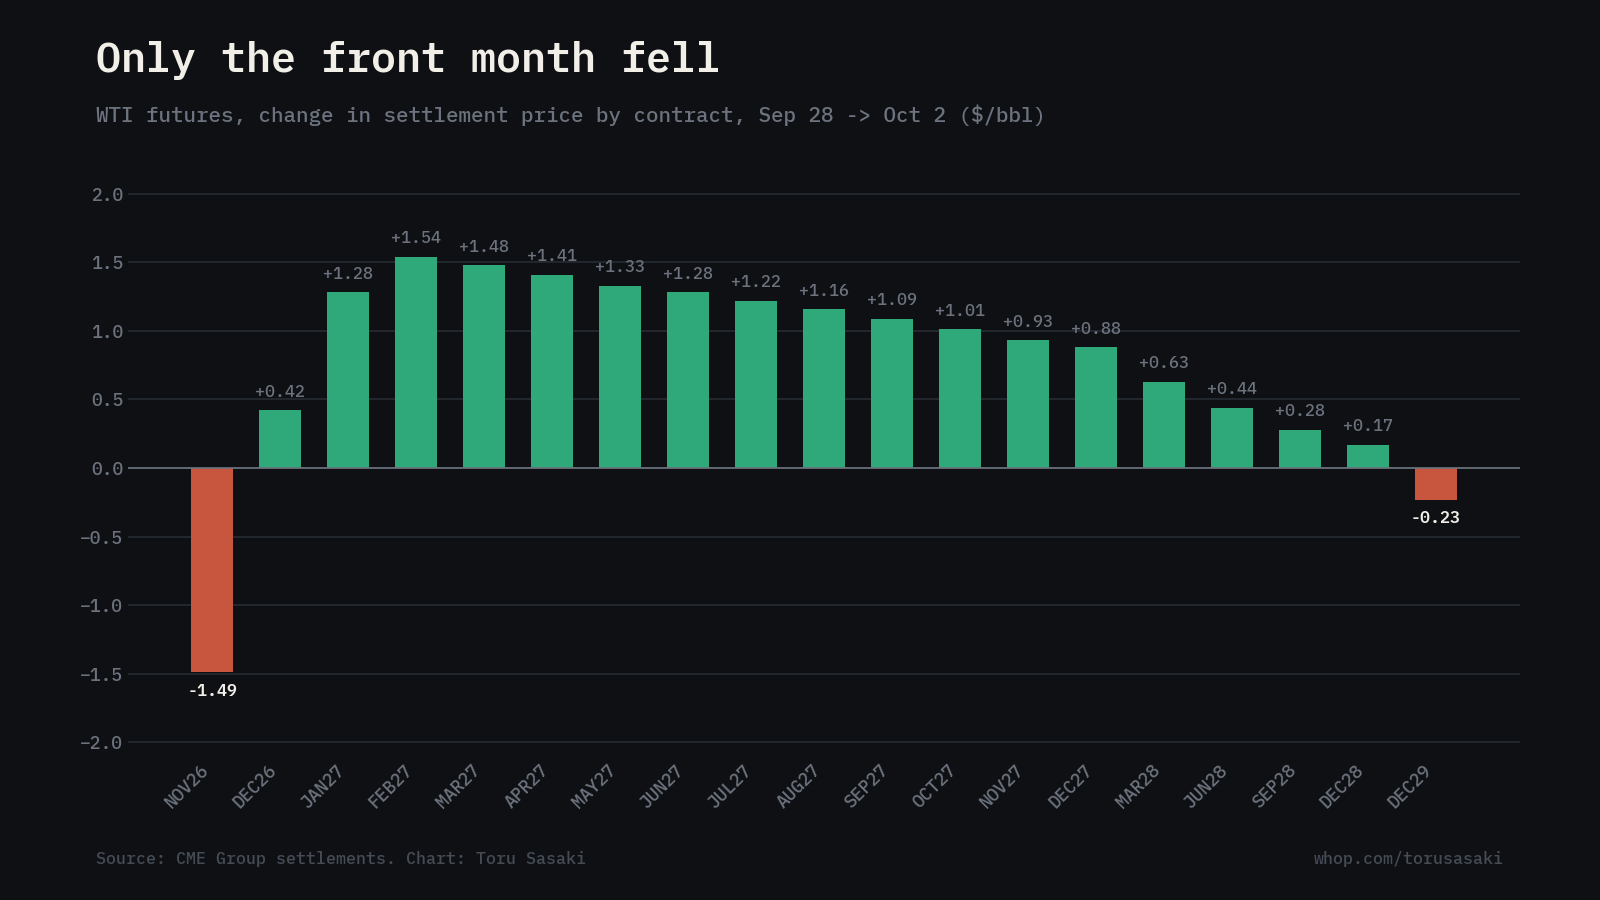
Every contract from December 2026 through December 2028 settled higher. Only the front month dropped.
That shape tells you this isn't a demand scare. It's a plumbing problem.
US refineries are in seasonal maintenance. EIA data showed utilization at 92.5% and crude runs down about 554,000 barrels a day. Refineries that aren't running can't take crude. So barrels pile up at Cushing, the delivery point for the contract, and the nearest contract has no one to take delivery.
The products side says the opposite of "glut." In the same EIA report, crude stocks rose 0.9 million barrels, but gasoline fell 1.7 million and distillates fell 2.3 million. Distillates now sit about 14% below their five-year average. Crude is backing up because it can't be turned into fuel fast enough, not because nobody wants fuel.
Brent barely moved. This is a US-local jam.
Who's trapped
From Sep 29 to the end of the week, as price fell from $94 to $90, about 28,000 new short contracts came in. Only 8,000 to 9,000 left. Roughly 20,000 are still there.
Each time price pushed toward $90, it bounced.
Now look at what it costs to hold those shorts.
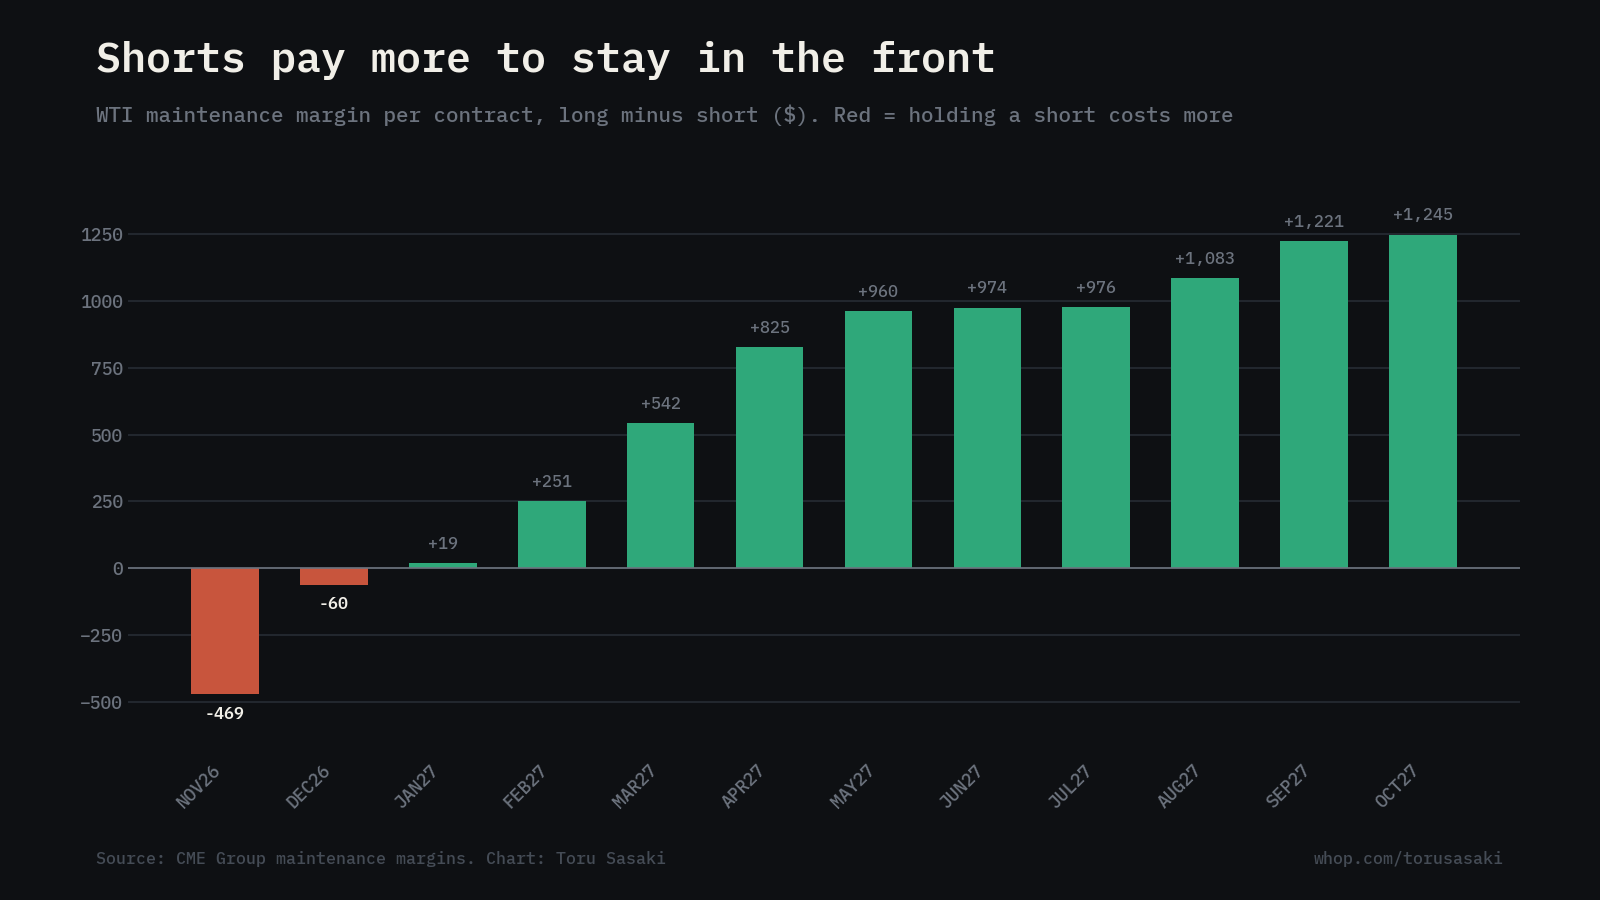
For November, CME's maintenance margin is $9,052 for a short and $8,583 for a long. December is close to even. From January on, longs cost more.
Exchanges set margin by the risk they see. Right now, the risk sits on the short side of the next two months. The positioning is leaning one way, and the margin table says the exchange knows it.
A $3 to $4 bounce would put most of those 20,000 shorts underwater. Past that, $100 is not a stretch. My read is that once refineries come back, the front-month discount closes, and it can close fast.
When will you know?
The public signal is an EIA report showing Cushing stocks drawing. That's when you can say refineries are running again.
Price won't wait for it. Some players can call a refinery and ask. Some buy satellite data. Oil is a physical market, and the people who see the barrels know first.
So if you know someone shorting the front month because "oil is done," wish them luck with the accident.
Gold: below $4,150, the sellers thin out
Gold dropped hard on Monday, broke $4,300, and closed the week at $4,162.
$4,150 matters. Around that level, producers start reducing their short hedges. Near $4,050, physical buyers start testing bids. CFTC data shows the combined short hedges of producers and swap dealers, measured in dollars, have shrunk a lot. People holding metal are no longer in a hurry to sell it.
Open interest fell below 400,000 contracts this week. Everyone watches that number. Some will treat it as a place to buy.
The tell to watch: gold that stops falling while yields keep rising. If you see that and it looks wrong, it's usually physical buying underneath.
Bitcoin: it rose in the week rates misbehaved
MOVE above 100. A stronger dollar. Liquidity drained by corporate tax payments and month-end repo. In past weak phases, any one of those would have knocked Bitcoin down.
It rose.
Spot is doing the lifting. Price is climbing faster than futures open interest, so this isn't leverage. The futures curve looks skeptical, not euphoric. ETF inflows have recovered on a two-week average, and Strategy disclosed another 1,665 BTC on Sep 28.
The options market tells a more specific story. On Oct 2, after price spiked to about $87,250 on the payrolls miss and got pushed back, the week's largest block trades were bets on a landing, not a breakout. One call ratio spread, bought for about $20,000 in net premium, pays the most at $96K on Oct 30 and loses above $100K. A series of $90K / $95K / $100K butterflies centered on $95K.
Big money is betting on up. Not on unlimited up.
The market also hasn't dropped its downside insurance. Bitcoin crashed after each of the last three US midterms, and the market remembers.
Short-term holders' average cost sits around $73,000 to $74,000. From there, there's room before profit-taking pressure builds. I think $90K+ is clearly in view. Past that, I don't know.
The week ahead
Oct 7 is the day. A 10-year auction, with 3-year and 30-year auctions on either side, and the FOMC minutes the same afternoon. Bitcoin's 100-day moving average is also crossing above its 200-day around Oct 5 to 7. The mood around minutes day has flipped Bitcoin more than once.
The thing to watch across all three: does the MOVE index finally come down? If it does, margin frees up, and that money goes looking for risk.
Numbers instead of trendlines.
— Toru
---
This letter is for research and education only. It is not investment advice, and nothing here is a recommendation to buy or sell anything. Make your own decisions.